Relationship between Objective and
Subjective Atmospheric Visibility and Its
Influence on Willingness to Accept or Pay in
China
Kangkang Yu1☯, Zhenghao Chen1☯, Jian Gao2,3☯*, Yuechong Zhang2,3‡, Shulan Wang2,3‡, Fahe Chai2,3‡
1School of Agricultural Economics and Rural Development, Renmin University of China, Beijing, P.R. China,2State Key Laboratory of Environmental Criteria and Risk Assessment, Chinese Research Academy of Environmental Sciences, Beijing, P.R. China,3Collaborative innovation center of atmospheric
environment and equipment technology, Nanjing, Jiangsu, P.R. China ☯These authors contributed equally to this work.
‡These authors also contributed equally to this work.
Abstract
This study is to distinguish the objective and subjective measures of atmospheric visibility, and investigate the relationship between the two measures as well as the effect on the peo-ple’s behavioral intentions on air pollution in China. A mixed method was adopted in this study combining both lab experiments to measure objective atmospheric visibility and a questionnaire survey to measure subjective atmospheric visibility. The regression results show that: (a) The people’s perception of atmospheric visibility is based on objective infor-mation about the ambient air (Relative Humidity, PM2.5, Atmospheric Visibility) and there are some turning points that could enable people to distinguish good and poor air quality; (b) The people’s perception of visibility has a significant effect on either their willingness-to-accept (WTA) the visibility or on their willingness-to-pay (WTP) for improving the air quality; (c) The subjective atmospheric visibility also mediates the effect of objective measures on WTA or WTP; (d) The higher the level of pro-environmental attitude is, the more people will pay to improve the air quality, and this effect is much stronger than that effect of perception; and (e) The respondents from North China Plain, Yangtze River Delta and the relative clean areas have higher level of perception.
Introduction
China has experienced a huge economic growth in the past three decades, with an annual growth rate of 10% for the gross domestic product, and the remarkable growth of its economy has resulted in increased energy consumption as well as air pollution and visibility
damnifica-tion[1]. Atmospheric Visibility is one indicator for measuring air quality and also one of the
most significant factors in evaluating air pollution [2]. The Visual Air Quality (VAQ) is often
OPEN ACCESS
Citation:Yu K, Chen Z, Gao J, Zhang Y, Wang S, Chai F (2015) Relationship between Objective and Subjective Atmospheric Visibility and Its Influence on Willingness to Accept or Pay in China. PLoS ONE 10 (10): e0139495. doi:10.1371/journal.pone.0139495
Editor:Aijun Ding, Nanjing University, CHINA
Received:June 8, 2015
Accepted:September 13, 2015
Published:October 7, 2015
Copyright:© 2015 Yu et al. This is an open access article distributed under the terms of theCreative Commons Attribution License, which permits unrestricted use, distribution, and reproduction in any medium, provided the original author and source are credited.
Data Availability Statement:All relevant data are within the paper.
estimated by Light Extinction (Bext), Deciview, Visibility (Vis) and Particulate Matter (PM2.5).
Evaluation of the relationship between PMs and Bext, is critical in establishing control
mea-sures to alleviate visibility degradation [3–6]. Compared with Bext, the haze index and visibility
show a linear relationship [7,8].
Researchers used to use the pictures simulated by computer programs or a series of real photos to describe the visibility of the city view in a certain region in order to evaluate the level
of the people’s assessment and acceptance of the visual air quality [9–11]. In terms of the
for-mer method, software called WinHaze is often adopted to finally generate digital photos, while the latter picks up real photos according to a few indicators. For example, in the report about
people perceptual visibility, Davidson et al [12] asked the respondents to evaluate several
pho-tos showing the visibility in Washington D.C., according to their attitude toward the visual air quality in each of the assigned photos. The relationship between VAQ/PM and acceptance were then analyzed from the results. The level of acceptance is usually measured by a Contin-gent Valuation Method (CVM). In terms of the research on visibility, having shown the respondents a series of photos of the same place with different levels of visibility, the research-ers position them in a certain context in which the visibility has been changed to see if they think that it is acceptable and if so, how much they would be willing to pay for producing such
a change. For example, in the early 1980s, Schulze et al [13]estimated how much all the
national parks in the southern and western parts of America would have to spend to avoid a reduction in visibility, and some researchers have attempted to conduct small-scale studies to
address similar problems [14,15]. These studies not only have geographical limitations, but
also only evaluate the change in visibility at a single level; therefore, it is doubtful that these results could be used in other places, which would constrain the generalizability. In order to
address this problem, Rae [16] expanded the research scope to the benefits brought by reducing
air pollution in urban areas, although he fails to stipulate the absolute value of the change in visual air quality. In some of the aforementioned studies, the respondents are not in the real context, while other studies evaluate the effect of visibility on tourists during their visit to
national parks [17–19]. However, this kind of research is also biased because tourists may not
only spend money to enjoy the beautiful views, but on other tourism amenities.
Although the early researchers in the fields of environment science and environment
man-agement have tried to build a bridge between visual air quality and the people’s behavioral
intentions, it is not easy to draw a direct linkage between objective atmospheric visibility and human behaviors. Apart from objective measures, some studies in the field of environmental
psychology have also begun to focus on the people’s perception of visibility and assessment on
the basis of this perception. In terms of visual landscape assessment, human perception is the
core of the definition that“an area, as perceived by people, whose character is the result of the
action and interaction of natural and /or human factors”[20]. The distinction between the
objectivist approach, in which the visual quality is viewed as being inherent to the ambient air, and the subjectivist approach, in which the visual air quality is considered to be constructed by
the observer [21], is parallel to the long-standing debate about whether beauty is“in the object”
or“in the eye of the beholder”in the philosophy of aesthetics [22].
Similar to landscape assessment, we argue that there are some differences between the visi-bility level perceived by the people and the level calculated based on lab experiments. The key
questions are why there are differences and how they would affect the people’s behavior. So far,
there have been no good answers to these questions. While environmental psychology, which focuses on the relationship between humans and the natural environment, has been the basis
of much of the research on the people’s cognition of the environment and their behaviors
toward it, only a few of these studies combine both an objective and subjective perspective. In this study, we adopt both objective atmospheric visibility based on lab experiments and
subjective atmospheric visibility based on a questionnaire survey in order to investigate the
relationship between these two measures as well as its effect on the people’s behavioral
intentions.
Methods
A mixed method was adopted in this study. As explained earlier, we collected objective data by means of experiments and subjective data by conducting a survey. This study has been approved by Renmin University of China and the data were analyzed anonymously. The par-ticipants provide their online informed consent to participate in this study. If they agree with the instruction in the consent, they will finish the online questionnaire. However, if they do not agree with it, they can drop up participating in the survey. We have downloaded all the ques-tionnaires online together with the instruction on the first page. All these copies have been doc-umented in a hard disk by the research team. Furthermore, the ethic committee approved this procedure. The processes of developing the measure and collecting the data are explained in the following subsection.
Objective Measures
In studies of visibility, researchers who adopt a contingent valuation method (CVM) would normally show the respondents a series of photos that represent different levels of visibility in the same place. In this study, the photos shown to the respondents were chosen from those taken in October 2011 on the roof of the observation station in the campus of the Chinese Research Academy of Environmental Sciences, which is located near a residential area in the
northern part of Beijing (116°24’E, 40°02’N) outside the fifth ring road of the city. The distance
from the sampling site to the 2008 Olympic Games stadium is only 5.7 km and the Olympic vil-lage is less than 3 km away. The instruments were set up in a three-room observational station
located on the rooftop of a three-tier building [23].
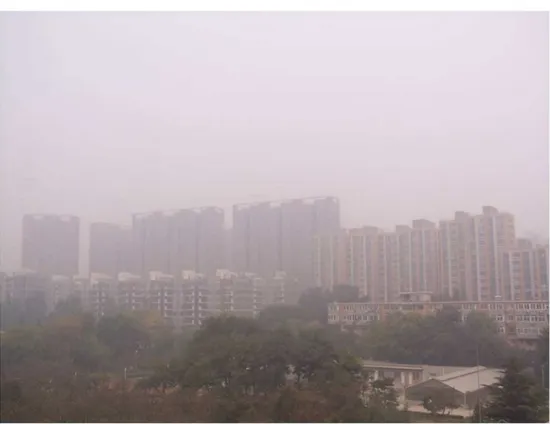
There are five photos in total, which are all about heavy pollution (according to“Ambient
air quality standards”GB 3095–2012) but the haze degree is from severe to slight (according to
“Observation and forecasting level of haze”QX/T 113–2010). The details are shown in Figs1–
5. The mass concentrations of PM2.5and PM10were continuously measured using two beta
attenuation monitors (Thermo FH62C14, and BAM 1020, Metone Co.), equipped with a smart heater to condition the sample air stream according to the designated reference methods of the guidelines of the USEPA. The limits of the detection of the techniques are all sufficient to accu-rately measure the relatively high concentration of aerosols at the study sites. The mass
concen-trations of PM2.5and PM10were amended by the filter samples, which were taken at the same
site and balanced and weighted in a lab with stable temperature and humidity. The variation of temperature (T), pressure (Pre), solar radiation (SR), total ultraviolet (UV), relative humidity (RH), visibility (Vis) and wind speed (WS)/directions (WD) were measured by VISALA instru-ments. The upper limit of the visibility sensor was 20 km.
In particular, the place where the people live may also affect their perception and attitude
toward the environment. According to the pollution characteristics and pollution level [24],
Fig 1. Photo No.1 in CVM (Haze Degree: Severe, RH = 83.5%, PM2.5 = 170.6μg/m3, PM10 = 411.0μg/m3,
Vis = 1.6 km, AQI = 461.
doi:10.1371/journal.pone.0139495.g001
Fig 2. Photo No.2 in CVM (Haze Degree: Moderate, RH = 69.5%, PM2.5= 202.5μg/m3, PM10= 400.2μg/
m3, Vis = 2.2 km, AQI = 450).
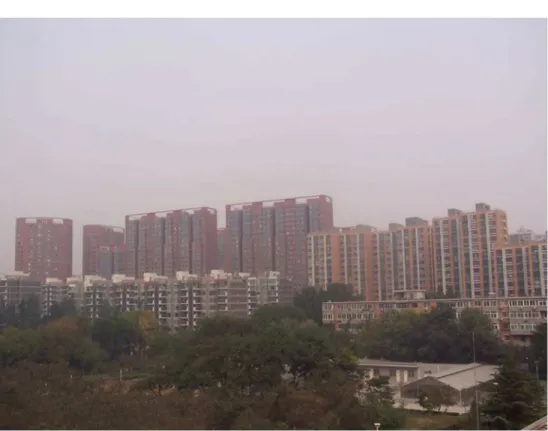
Fig 3. Photo No.3 in CVM (Haze Degree: Light, RH = 70.4%, PM2.5= 139.6μg/m3, PM10= 291.5μg/m3,
Vis = 3.2 km, AQI = 402).
doi:10.1371/journal.pone.0139495.g003
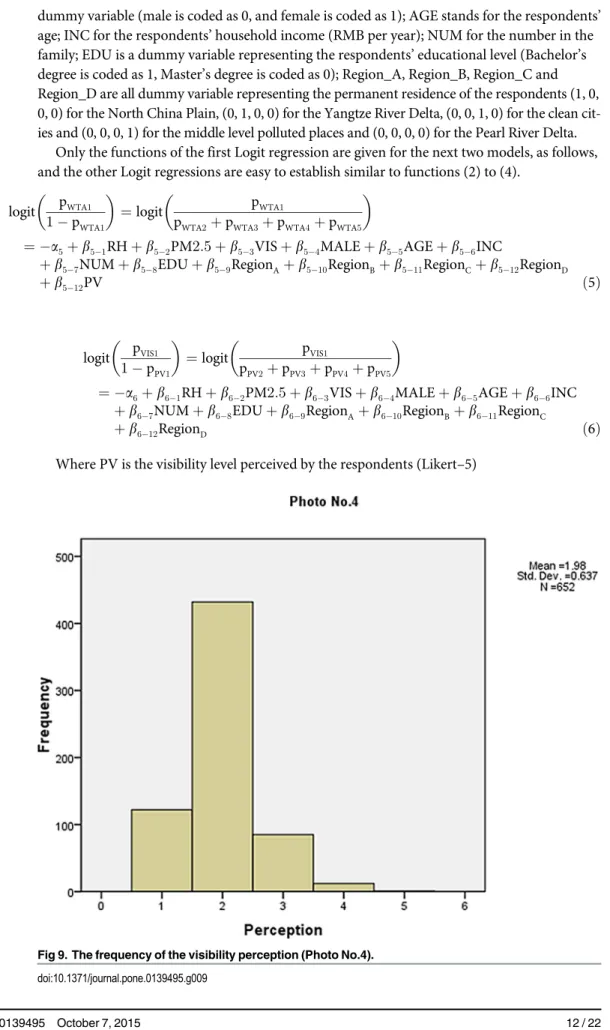
Fig 4. Photo No.4 in CVM (Haze Degree: Slight, RH = 64.2%, PM2.5= 131.4μg/m3, PM10= 311.7μg/m3,
Vis = 4.9 km, AQI = 431).
(Huaibei, Suzhou, Bengbu, Hefei, Chuzhou, Maanshan, Wuhu, Chaohu, Tongling, Xuancheng, Huangshan), and South part of Shandong (Zaozhuang, Linyi, Jining, and Heze); c) small city-clusters or cities with good air quality but poor economy, such as Kunming in Yunnan Prov-ince, Haikou in Hainan ProvProv-ince, and Xiamen in Fujian Province; and d) small city-clusters or cities with middle level air quality between the North China Plain and the Yangtze River Delta, such as Shandong Peninsula, Liaoning province, Sichuan province, Shanxi province. In addi-tion, there is one special city cluster, the Pearl River Delta including all 13 cities in Guangdong province, which is quite different from the regions above as either its air quality or its economic conditions has been significantly improved in the past ten years.
To implement the empirical test, this study developed four dummy variables: Region_A, if the place is in the North China Plain it will be 1 or it will be 0; Region_B, if the place is in the Yangtze River Delta, the value will be 1 or it will be 0; Region_C, if the place is in the clean areas, the value will be 1 or it will be 0; and Region_D, if the place is in the middle level polluted cities, the value will be 1 or it will be 0. Thus, if the value of each variable is 0, the place will be in the Pearl River Delta.
Subjective Measures
Questionnaire studies aim to describe behavior and gather people’s perceptions, opinions,
atti-tudes and beliefs about different issues, which are widely used to describe populations or
prac-tices and establish a relationship between two or more variables [25]. Therefore, this study
mainly adopts this method to measure the people’s perception of visibility, their attitude and
behavior toward the environment, as well as the effect of their demographic characteristics.
Fig 5. Photo No.5 in CVM (Haze Degree: Mild, RH = 54.6%, PM2.5 = 116.5μg/m3, PM10 = 253.9μg/m3,
Vis = 6.9 km, AQI = 349).
Subjective atmospheric visibility, Willingness-to-accept (WTA) and Willingness-to-Pay (WTP). Previous studies use CVM corresponding to environment evaluation to assess the
economic value of environmental changes [26,27]. This involves using questionnaire surveys to
identify whether the respondents are willing to accept or pay for a certain environment
man-agement policy or service [28].
According to Davidson et al [2001], the respondents in this study were asked to assess the atmospheric visibility and the level of their acceptance after they had seen the five photos
shown to them. Two questions were asked about each photo, the first of which was“Do you
think the landscape shown in the photo is highly visible?”with a five-point Likert scale from
poor visibility to good visibility, while the second was“If the visibility outside is like that shown
in the photo, would you like to go out?”with a five-point Likert scale from dislike to like. In
other words, the former is designed to measure their perception of visibility (PV), while the lat-ter measures their willingness to accept the current visibility (WTA in brief).
According to the previous studies [29,30], a scenario was assumed that the government is
trying to adopt a pro-environment project to reduce the days when the air pollution and poor visibility occurs as shown in the photo, while the cost of this project would come from tax directly or indirectly. Then the respondents were asked how much money (per RMB in a year) they are willing to pay, if the cost would be paid from their household income. This amount of money represents the variable of willingness-to-pay (WTP in brief). To get a normal distribu-tion, this study adopts the logarithm form of WTP as the dependent variable.
Pro-environmental attitude (PEA). Environmental attitude is a psychological tendency expressed by evaluating the natural environment with some degree of favor or disfavor, and a crucial construct in the field of environmental psychology, discussed in more than half of all
publications in this area [31]. Since 1960s, there have been social surveys and measurements of
environmental attitude such as the early New Environmental Paradigms [32], the
Environmen-tal Concern Scale [33] and the Ecology Scale [34]. According to Milfont and Duckitt [35],
envi-ronmental attitude is divided into two kinds: protection and utilization.
Many researchers support the relationship between environmental attitude and
pro-environmental behaviors [36,37]. However, only the cognition under a specific context
deter-mines the specific behaviors, so this study is trying to define a specific pro-environmental
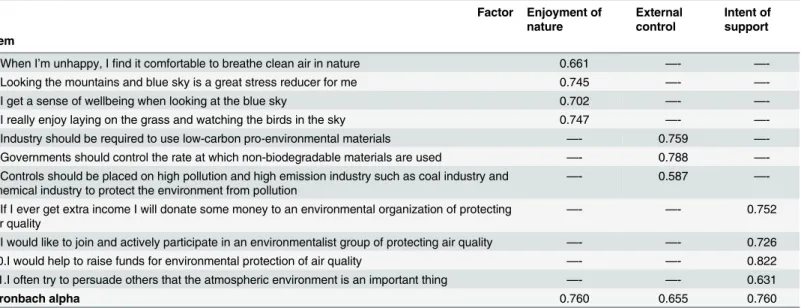
atti-tude toward the atmospheric environment.Table 1shows the items of this construct. A
five-point Likert-scale from“1 = strongly disagree”to“5 = strongly agree”were employed. Factor
loading reveals that all the items yield loadings greater than 0.5 and the Cronbach alpha of each dimension is higher than 0.6. A second-order confirmative factor analysis also shows a good fit (χ2/df =, 2.399, RMSEA = 0.046, NFI = 0.950, RFI = 0.933; IFI = 0.970, TLI = 0.960; CFI = 0.970). Thus, the revised measures fit our research context very well and the variable of PEA is the average score of the three dimensions.
Other control variables. According to Shen and Saijo [38], this study considered gender, age, household income, the number of family members, and education level, as control vari-ables. Thus, the respondents were also asked to provide their demographic characteristics in the questionnaire.
Gender (GEN) is a dummy variable, the score of which is 1 when the respondent is male and 0 when the respondent is female.
Age (AGE) is an ordinal variable with four levels which are“18 and below”,“18 to 35”,“36–
60”and“60 and above”.
Household income (INC) is also designed as an ordinal variable with four levels which are
“less than 10000 RMB”,“between 10000 and 49999”,“between 50000 and 99999”, and“more
than 99999”. The number of family members (NUM) is an ordinal variable with three levels:“3
Education level (EDU) is defined as an ordinal variable from lower to higher levels which
are“middle school or lower”,“high school”,“bachelor”, and“master”.
Data Collection
The questionnaire was then translated into Chinese by professional researchers and back-trans-lated into English by someone not involved in the research in order to allow experts to examine
each survey item on both versions to establish meaning conformity [39]. Both versions were then
evaluated by seven academic researchers who served as expert judges to assess face validity.
According to Converse and Presser [40], if researchers have the resources to do more than one
pretest, it might be best to use a participatory pretest first, then an undeclared test to check the choice of analysis and the standardization of the survey. Therefore, we also conducted two rounds of undeclared pretests for 175 college students (125 valid). During each pretest, respon-dents were not informed that it is a pretest and the survey was given just as we intend to conduct it in the field. Since all items used to measure each construct were derived from a thorough litera-ture review, only minor modifications such as re-organizing the order of a few questions and also
rewording headings and introductions for a better flow were suggested by the panel experts [41].
The method of dissemination was electronic, which is more convenient and efficient. The research team distributed invitations through a Chinese survey database to ask candidates to com-plete the questionnaire online. The research team finished three rounds of collection from July to November in 2013. In the first round, a total of 569 invitations were distributed and 220 valid questionnaires were finally collected, which yielded a valid response rate of 38.7%. In the second round, 1055 invitations were distributed and 214 valid questionnaires were returned, yielding a valid response rate of 20.3%. In the third round, 1050 invitations were distributed and 218 valid were returned, yielding a valid response rate of 20.8%. There is no significant difference of demo-graphical distribution of the respondents in the three rounds. When combining the three sets of data together, we finally obtained 652 valid questionnaires with a response rate of 24.4%. As each respondent was asked to assess five photos, the total number of records was five times the original
sample, which accounted for 3260 pieces of data. The sample frame is shown inTable 2.
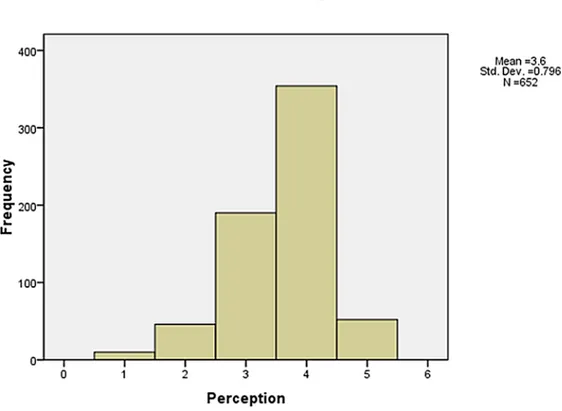
The frequency of the visibility perception is shown in Figs6–10. Not as simple as the
objec-tive measures of visibility, the respondents assessed the same photos differently, although most
Table 1. The results of explorative factor analysis.
Factor Enjoyment of nature External control Intent of support Item
1.When I’m unhappy, Ifind it comfortable to breathe clean air in nature 0.661 —-
—-2.Looking the mountains and blue sky is a great stress reducer for me 0.745 —-
—-3.I get a sense of wellbeing when looking at the blue sky 0.702 —-
—-4.I really enjoy laying on the grass and watching the birds in the sky 0.747 —-
—-5.Industry should be required to use low-carbon pro-environmental materials —- 0.759 —-6.Governments should control the rate at which non-biodegradable materials are used —- 0.788 —-7.Controls should be placed on high pollution and high emission industry such as coal industry and
chemical industry to protect the environment from pollution
—- 0.587
—-8.If I ever get extra income I will donate some money to an environmental organization of protecting air quality
—- —- 0.752
9.I would like to join and actively participate in an environmentalist group of protecting air quality —- —- 0.726
10.I would help to raise funds for environmental protection of air quality —- —- 0.822
11.I often try to persuade others that the atmospheric environment is an important thing —- —- 0.631
Cronbach alpha 0.760 0.655 0.760
Fig 6. The frequency of the visibility perception (Photo No.1).
doi:10.1371/journal.pone.0139495.g006 Table 2. Sample frame.
Valid N %
Gender Female 373 57.2
Males 279 42.8
Age 18–35 554 85.0
36–60 98 15.0
Household Income (RMB) 9999 or less 19 2.9
10000–49999 153 23.5
50000–99999 250 36.8
100000 or more 240 36.8
Number of Families Less than 3 102 15.6
3–5 523 80.0
More than 5 27 4.1
Education A middle school degree or below 1 0.2
A high school degree 32 4.9
A Bachelor’s degree 542 83.1
A Master’s degree or above 77 11.8
Location North China Plain 254 39.0
Yangtze River Delta 180 27.6
Pearl River Delta 50 7.6
The middle level of polluted cities 77 11.8
The clean cities 91 13.9
of them made a correct judgement. The difference between the subjective and objective levels demonstrates the necessity to explore the mechanisms behind.
Results
We adopted regressions to test the relationship among the key variables using the software STATA 10.0. In addition, to test the mediating effect of subjective atmospheric visibility repre-senting the generative mechanism through which objective measures influence WTA/WTP, we adopted the well-known procedure for determining mediation presented by Baron and Kenny
[42]. The results are presented in the next sections.
The effects on WTA
If the dependent variable is not simply segmented into high WTA and low WTA but into ordered multiple categories including five levels from dislike to like, there will be four Logit regression models, which is a Cumulative Logit Model (CLM). Since the WTA in this study is
from level 1 to level 5, the corresponding probabilities are pWTA1, pWTA2, pWTA3, pWTA4,
pWTA5and the models fitted are as follows:
logit pWTA1
1 p
WTA1
¼logit pWTA1
pWTA2þpWTA3þpWTA4þpWTA5
¼ a1þb1 1RHþb1 2PM2:5þb1 3Visþb1 4MALEþb1 5AGEþb1 6INC
þb1 7NUMþb1 8EDUþb1 9RegionAþb1 10RegionBþb1 11RegionC
þb1 12RegionD ð1Þ
Fig 7. The frequency of the visibility perception (Photo No.2).
logit pWTA1þpWTA2
1 ðp
WTA1þpWTA2Þ
¼logit pWTA1þpWTA2
pWTA3þpWTA4þpWTA5
¼ a2þb2 1RHþb2 2PM2:5þb2 3Visþb2 4MALEþb2 5AGEþb2 6INC
þb2 7NUMþb2 8EDUþb2 9RegionAþb2 10RegionBþb2 11RegionC
þb2 12RegionD ð2Þ
logit pWTA1þpWTA2þpWTA3
1 ðp
WTA1þpWTA2þpWTA3Þ
¼logit pWTA1þpWTA2þpWTA3
pWTA4þpWTA5
¼ a3þb3 1RHþb3 2PM2:5þb3 3Visþb3 4MALEþb3 5AGEþb3 6INC
þb3 7NUMþb3 8EDUþb3 9RegionAþb3 10RegionBþb3 11RegionC
þb3 12RegionD ð3Þ
logit pWTA1þpWTA2þpWTA3þpWTA4
1 ðp
WTA1þpWTA2þpWTA3þpWTA4Þ
¼logit pWTA1þpWTA2þpWTA3þpWTA4
pWTA5
¼ a4þb4 1RHþb4 2PM2:5þb4 3Visþb4 4MALEþb4 5AGEþb4 6INC
þb4 7NUMþb4 8EDUþb4 9RegionAþb4 10RegionBþb4 11RegionC
þb4 12RegionD ð4Þ
Where RH is the relative humidity; PM2.5represents the mass concentration of particles
smaller than 2.5μm; Vis is the objective atmospheric visibility shown in the photos; MALE is a
Fig 8. The frequency of the visibility perception (Photo No.3).
dummy variable (male is coded as 0, and female is coded as 1); AGE stands for the respondents’
age; INC for the respondents’household income (RMB per year); NUM for the number in the
family; EDU is a dummy variable representing the respondents’educational level (Bachelor’s
degree is coded as 1, Master’s degree is coded as 0); Region_A, Region_B, Region_C and
Region_D are all dummy variable representing the permanent residence of the respondents (1, 0, 0, 0) for the North China Plain, (0, 1, 0, 0) for the Yangtze River Delta, (0, 0, 1, 0) for the clean cit-ies and (0, 0, 0, 1) for the middle level polluted places and (0, 0, 0, 0) for the Pearl River Delta.
Only the functions of the first Logit regression are given for the next two models, as follows, and the other Logit regressions are easy to establish similar to functions (2) to (4).
logit pWTA1
1 p
WTA1
¼logit pWTA1
pWTA2þpWTA3þpWTA4þpWTA5
¼ a5þb5 1RHþb5 2PM2:5þb5 3VISþb5 4MALEþb5 5AGEþb5 6INC
þb5 7NUMþb5 8EDUþb5 9RegionAþb5 10RegionBþb5 11RegionCþb5 12RegionD
þb5 12PV ð5Þ
logit pVIS1
1 p
PV1
¼logit pVIS1
pPV2þpPV3þpPV4þpPV5
¼ a6þb6 1RHþb6 2PM2:5þb6 3VISþb6 4MALEþb6 5AGEþb6 6INC
þb6 7NUMþb6 8EDUþb6 9RegionAþb6 10RegionBþb6 11RegionC
þb6 12RegionD ð6Þ
Where PV is the visibility level perceived by the respondents (Likert–5)
Fig 9. The frequency of the visibility perception (Photo No.4).
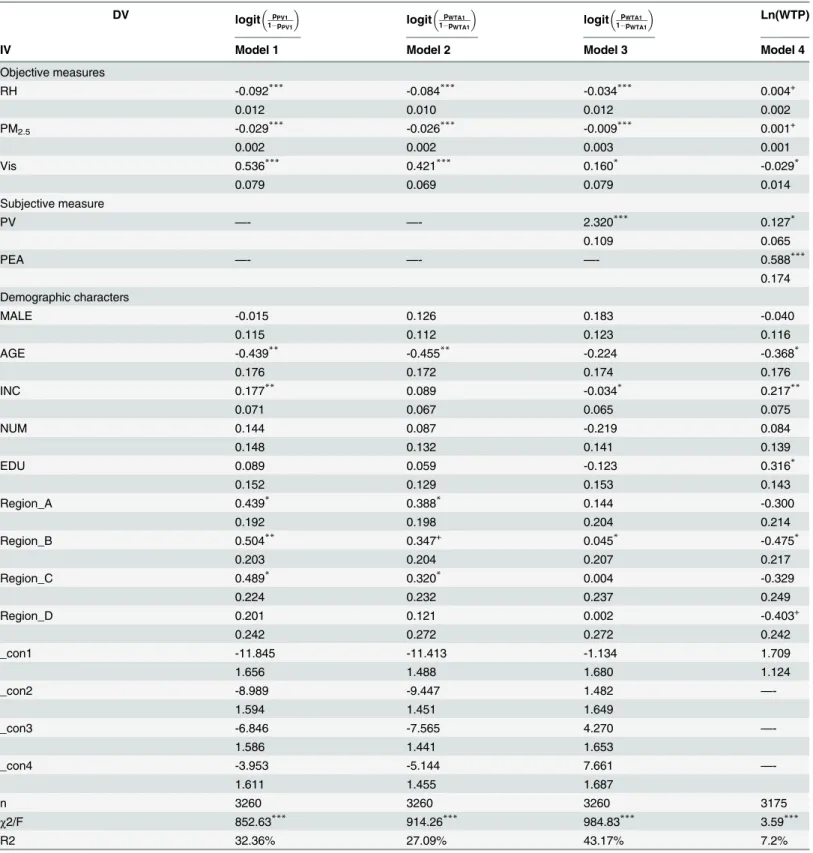
As shown inTable 3, and Model 1 tests the effect of objective visibility measures, including
RH, PM2.5and Vis, on PV; Model 2 tests the effect of objective visibility measures, including RH,
PM2.5and Vis, on WTA when controlling the respondents’demographic characteristics; and
Model 3 tests the effect of measure PV on WTA when controlling objective visibility measures
and the respondents’demographic characteristics. The results illustrate that RH and PM2.5both
have a significant negative effect on WTA (β= -0.084,p<0.001;β= -0.026,p<0.001), while Vis
has a significant positive effect on WTA (β= 0.421,p<0.001). However, when the subjective
measure of visibility was entered together with the objective measures, these effects became
smaller but still significant, while the effect of PV was positive and significant (β= 2.320,
p<0.001). As the effects of RH, PM2.5and Vis on PV are all significant (β= -0.092,p<0.001;β=
-0.029,p<0.001;β= 0.536,p<0.001), the mediating effect of PV is supported. Besides, Region_A,
Region B and Region_C all have significant positive effect on PV (β= 0.439,p<0.05;β= 0.504,
p<0.01;β= 0.489,p<0.05), while only Region_B has a significant positive effect on WTA (β=
0.045,p<0.05). In addition, the control variables such as AGE has significant and negative effects
on both PV and WTA, while INC has a positive effect on PV but a negative effect on WTA.
The significant key relationships in Model 1 are described in Figs11–13, with the vertical
axis representing the probability of five levels of PV and the horizontal axis representing the objective measure of visibility. When the level of RH increases to a value of around 70, the dis-tance between the probability of the lower level of PV and the probability of the higher level of
PV increases. Also, when the level of PM2.5increases to a value of around 160μg/m3, the
proba-bilities also become distinctive. Although this is not significant for the relationship between Vis
and PV, it seems that a value of Vis of around 5 is the turning point.Fig 14illustrates the
rela-tionship in Model 3 with the vertical axis representing the probability that there are five levels of WTA and the horizontal axis represents PV. The red line to the blue line stands for the lowest
Fig 10. The frequency of the visibility perception (Photo No.5).
Table 3. The results of regressions.
DV logit pPV1 1 pPV1
logit pWTA1 1 pWTA1
logit pWTA1 1 pWTA1
Ln(WTP)
IV Model 1 Model 2 Model 3 Model 4
Objective measures
RH -0.092*** -0.084*** -0.034*** 0.004+
0.012 0.010 0.012 0.002
PM2.5 -0.029*** -0.026*** -0.009*** 0.001+
0.002 0.002 0.003 0.001
Vis 0.536*** 0.421*** 0.160* -0.029*
0.079 0.069 0.079 0.014
Subjective measure
PV —- —- 2.320*** 0.127*
0.109 0.065
PEA —- —- —- 0.588***
0.174 Demographic characters
MALE -0.015 0.126 0.183 -0.040
0.115 0.112 0.123 0.116
AGE -0.439** -0.455** -0.224 -0.368*
0.176 0.172 0.174 0.176
INC 0.177** 0.089 -0.034* 0.217**
0.071 0.067 0.065 0.075
NUM 0.144 0.087 -0.219 0.084
0.148 0.132 0.141 0.139
EDU 0.089 0.059 -0.123 0.316*
0.152 0.129 0.153 0.143
Region_A 0.439* 0.388* 0.144 -0.300
0.192 0.198 0.204 0.214
Region_B 0.504** 0.347+ 0.045* -0.475*
0.203 0.204 0.207 0.217
Region_C 0.489* 0.320* 0.004 -0.329
0.224 0.232 0.237 0.249
Region_D 0.201 0.121 0.002 -0.403+
0.242 0.272 0.272 0.242
_con1 -11.845 -11.413 -1.134 1.709
1.656 1.488 1.680 1.124
_con2 -8.989 -9.447 1.482
—-1.594 1.451 1.649
_con3 -6.846 -7.565 4.270
—-1.586 1.441 1.653
_con4 -3.953 -5.144 7.661
—-1.611 1.455 1.687
n 3260 3260 3260 3175
χ2/F 852.63*** 914.26*** 984.83*** 3.59***
R2 32.36% 27.09% 43.17% 7.2%
Note: Thefirst line in each cell is the coefficient, while the second line is the standard error. +p<0.1
*p<0.05
**p<0.01
level of WTA to highest level of WTA; therefore, as PV increases, the probability of the lowest level of WTA drops quickly and the probability of the highest level of WTA rises quickly.
The effects on WTP
As explained earlier, willingness-to-pay is measured as a continuous variable and the logarithm form is taken to keep normal distribution. Thus, in Function (7), ln(WTP) is the dependent
variable, while the objective measures (RH, PM2.5, and Vis) and the subjective measure-
per-ception of visibility (PV) are independent variable, controlling the variables of demographic characters and pro-environmental attitude (PEA) as it is emphasized as a key factor affecting environmental behaviors in environmental psychological studies.
lnðWTPÞ ¼a7þb7 1RHþb7 2PM2:5þb7 3Visþb7 4MALEþb7 5AGEþb7 6INC
þb7 7NUMþb7 8EDUþb7 9RegionAþb7 10RegionBþb7 11RegionC
þb7 12RegionDþb7 13PV
þb7 14PEA ð7Þ
Where PEA is the level of pro-environmental attitude of the respondents (Likert–5)
Fig 11. The relationship between Vis and PV.
As Shown inTable 3, Model 4 is testing the effects on willingness-to-pay. The results show that among the objective measures, only objective atmospheric visibility has a significant but
negative effect on WTP (β= -0.029, p<0.05). Also, the effect of subjective atmospheric
visibil-ity is significant and positive on WTP (β= -0.029, p<0.05), but it is much smaller than the
effect on WTA (β= 0.127, p<0.05). In particular, the effect of pro-environmental attitude is
positive and very significant (β= 0.588, p<0.001). Furthermore, Region B has a significant but
negative effect on WTP (β= -0.475,p<0.05), while Region_D only has a marginal and positive
effect on WTP (β= -0.403,p<0.1). In addition, the control variable AGE has a significant and
negative effect on WTP, and obviously INC has a significant and positive effect on WTP.
Discussion
Both objective measures and subjective measures of visibility are important in designing the
urban landscape. The former, which consists of physical“hard”measures observed by
techno-logical instruments, illustrates how well environmental characteristics meet the criteria that
Fig 12. The relationship between RH and PV.
was believed to be necessary for a good life, while the latter based on“soft”psychological responses, such as perceptions, enables a study of the way in which people assess whether or
not environmental characteristics satisfy their needs. The results show that the people’s
percep-tion of visibility is also based on objective informapercep-tion about the ambient air (RH, PM2.5and
Visibility), which means that one part of the people’s judgment comes from knowledge
gener-ated from the information collected and processed in society, while the other part may be
based on certain psychological factors. The people’s pro-environmental behavior could also be
guided in the right direction with the distribution of more accurate information. It is also found that there are some turning points that could enable people to distinguish good and bad
air quality. The shape of the curves offers the points, namely, after RH = 70%, PM2.5= 160μg/
m3, Visibility = 5km, the respondents had a clear perception of the visibility shown in the
pho-tos being either good or poor.
The results based on regressions support the fact that the subjective measure of visibility mediates the effect of the objective measure of visibility on willingness-to-accept or
Fig 13. The relationship between PM2.5 and PV.
willingness-to-pay. Figs15and16show the results based on regressions that subjective atmo-spheric visibility mediates the effect of all three objective indicators. The lower the level of RH
and PM2.5as well as the higher level of visibility shown in the photo, the more respondents
would assess a higher level of atmospheric visibility, and the more respondents would illustrate a higher level of willingness to accept this condition or pay for improving the air quality. It is easy to understand that a higher perception of visibility leads to the greater intention to go out-side, which reflects the willingness to accept. However, pushing people to pay for the improve-ment of visibility is not consistent with the normal awareness. This suggests that under the same condition, if the people perceive the ambient visibility is much better than the other peo-ple do, they would like to more strongly support the pro-environmental policies. In other words, the over-fit between subjective and objective atmospheric visibility indicates a positive affection, which stimulates more invests in getting a better feedback. Therefore, underlying the effect of subjective atmospheric visibility on WTA, there may be another mediator of positive affection, which would be investigated in the further study.
Fig 14. The relationship between PV and WTA.
The main difference between the two figures is that pro-environmental attitude has a much more significant effect on willingness-to-pay than subjective atmospheric visibility does, which is consistent with the existing studies. It means that the higher the level of pro-environmental attitude is and the higher the level of subjective atmospheric visibility, the more people will pay to improve the atmospheric visibility, but the former effect is much stronger. This is because the underlying mechanisms are different that one is the power of attitude and the other is from the view of perception which is based on the objective attributes of the environment. In China, the public has not paid more attention on visibility than before, after smoggy weather affected a total area of 1.43 million square kilometers and a population of 800 million people at the start
of 2013 [43]. In fact, in a long time, the Chinese people have overlooked the influence of the
poor air quality and they just begin to aware the tense situation according to more and more information about air pollutions exposed by the media. However, it will take a long time for them to realize the importance of taking conscious actions to protect the atmospheric environ-ment. Thus, the results of this study also enlighten the government that it is essential to raise
people’s awareness of the subjective measures of visibility, and more important, cultivate their
pro-environmental attitude to gain further pro-environmental support.
Furthermore, it is found that the respondents from North China Plain, Yangtze River Delta or the clean areas have higher level of subjective atmospheric visibility. In other words, the peo-ple living in the most heavily polluted regions or the cleanest regions intend to have higher
Fig 15. The tested mediating effects for WTA.
doi:10.1371/journal.pone.0139495.g015
Fig 16. The tested mediating effects for WTP.
level of visibility perception than the others. The reasons may be that the respondents from North China Plain and Yangtze River Delta where the polluted issue is quite serious are sensi-tive to the low level of visibility, so their perception of visibility would rise to a much higher level even when the objective level of pollution decreases a little bit. While the respondents from the unpolluted areas, they may not be sensitive to the air quality because of the small vari-ance and they may have less experience to distinguish a bad condition and a worse one, so their perception of visibility would still be higher than the others even under a low level of air qual-ity. With an increasing number of air pollution episodes and low visibility days reported by the media from the end of 2010, the Chinese government has begun to take more actions to reduc-ing air pollutant emissions and improvreduc-ing air quality across cities, municipalities, and prov-inces. However, it is very difficult to make a general plan for different regions in China. The findings of this study could also help the local government to implement corresponding poli-cies targeting at the people in the specific region. For example, the promotion of environmental protection would arouse the people in the most heavily polluted or the cleanest regions, while this may not be significant in other places.
Limitations
This study has some limitations, the first of which is that respondents were only given five pho-tos to distinguish the visibility. Although every attempt was made to diversify the degree of air quality shown in these photos, it would have been better to show more photos randomly. Future studies could design a number of experiments in which the respondents are asked to answer the questions straightly after showing them a random group of photos. Secondly, these photos are taken in natural conditions, but there is a method whereby the landscape can be simulated by combining the objective indicators. Future studies could try to use certain soft-ware to achieve this and compare the results with the real photos. Thirdly, although the mea-sure of willingness-to-pay is direct and convenient, it is quite difficult for the respondents to give the accurate amount of payment and the amounts estimated by heterogonous populations are often dispersed in a wide range. Thus, future studies could try many other different
meth-ods, such as biding experiments [44] and choice modeling [45] etc. Finally, only some basic
demographic characteristics of the respondents were controlled in the models, whereas more complex psychological factors, such as their value orientation, affection and so on could also affect their behavioral intention, which could be considered in future studies.
Conclusions
Many studies of visibility only focus on objective measures while neglecting the importance of subjective ones. However, the quality of the urban environment may be investigated from the
perspective of either an“expert”or a“lay person”, so this study distinguished the objective
measures from the subjective measures of visibility. Based on both a lab experiment and a field
survey, data was collected to support the framework that the people’s perception of visibility
mediates the effect of objective measures of visibility on their willingness to accept the air qual-ity or pay for the improvement. Therefore, attention to the subjective atmospheric visibilqual-ity is critical to gain the pro-environmental support of a people whose behavioral intentions would be guided by more accurate information about the air quality. Also, the environment-protec-tion promoting policy, public participaenvironment-protec-tion or air polluenvironment-protec-tion control strategy should be
diversi-fied in different regions of China, since the residential context could also affect people’s
Author Contributions
Conceived and designed the experiments: JG YZ SW FC. Analyzed the data: ZC. Wrote the paper: KY.
References
1. Chan CK, Yao X. Air pollution in mega cities in China. Atmospheric Environment 2008; 42: 1–42.
2. Watson J G. Visibility: Science and Regulation. Journal of the Air and Waste Management Association 2002; 52(6): 628–713. PMID:12074426
3. Bell ML, Dominici F, Ebisu K, Zeger SL, Samet JM. Spatial and temporal variation in PM2.5 chemical composition in the United States for health effects studies. Environmental Health Perspectives 2007; 115: 989–995. PMID:17637911
4. Hueglin C, Gehrig R, Baltensperger U, Gysel M, Monn C, Vonmont H. Chemical characterisation of PM2.5, PM10 and coarse particles at urban, near-city and rural sites in Switzerland. Atmospheric Envi-ronment 2005; 39: 637–651.
5. Lonati G, Giugliano M, Butelli P, Romele L, Tardivo R. Major chemical components of PM2.5 in Milan (Italy). Atmospheric Environment 2005; 39: 1925–1934.
6. Querol X., Alastuey A., Rodriguez S., Plana F., Ruiz C.R., Cots N. et al. PM10 and PM2.5 source appor-tionment in the Barcelona Metropolitan area, Catalonia, Spain. Atmospheric Environment 2001; 35: 6407–6419.
7. Pitchford M, Malm W. Development and applications of a standard visual index. Atmospheric Environ-ment 1994; 28(5): 1049–1054.
8. Malm CW. Introduction to Visibility. Fort Collins, CO: Cooperative Institute for Research in the Atmo-sphere; 1999.
9. Bishop I, Rohrmann B. Subjective responses to simulated and real environments: A comparison. Land-scape and Urban Planning 2003; 65(4): 261–277.
10. Bishop ID, Ye WS, Karadaglis C. Experiential approaches to perception response in virtual worlds. Landscape and Urban Planning 2001; 54(1–4): 117–125.
11. Ode A, Fry G, Tveit MS, Messager P, Miller D. Indicators of perceived naturalness as drivers of land-scape preference. Journal of Environmental Management 2009; 90(1): 375–383. doi:10.1016/j. jenvman.2007.10.013PMID:18280633
12. Davidson K, Deck L, Houle C. Assessing people opinions on visibility impairment due to air pollution: Summary report. Research Triangle Park, NC: U.S. Environmental Protection Agency; 2001.
13. Schulze WD, Brookshire DS, Walther E, Kelley K. Methods development for environmental control ben-efits assessment, Vol. X: The benben-efits of preserving visibility in the national parklands of the Southwest. Washington, DC: U.S. Environmental Protection Agency, Office of Research and Development; 1981.
14. Rahmatian M. Extensions of the disaggregate bid experiment: Variations in framing. Journal of Environ-mental Management 1986; 22(3): 191–202.
15. Tolley G, Randall A, Blomquist G, Fabian R, Fishelson G, Frankel A et al. Establishing and valuing the effects of improved visibility in Eastern United States. Washington, D.C.: U.S. Environmental Protec-tion Agency; 1984.
16. Rae D. Benefits of improving visual air quality in Cincinnati: Results of a contingent valuation survey. Palo Alto, CA: Electric Power Research Institute; 1984.
17. Rowe RD, d'Arge R, Brookshire D. An Experiment on the economic value of visibility. Journal of Envi-ronmental Economics and Management 1980; 7(1): 1–19.
18. Rowe RD, Chestnut LG. Valuing environmental commodities: Revisited. Land Economics 1983; 59(4): 404–410.
19. McFaland KK, Malm W, Molenar J. An examination of methodologies and social indicators for assess-ing the value of visibility. In: Chestnut RDRaLG editor. Managassess-ing Air Quality and Scenic Resources at National Parks and Wilderness Areas. Boulder, Colorado: Westview Press; 1983.
20. Council of Europe. Presentation of the European Landscape Convention. Strasbourg: Council of Europe; 2003.
21. Lothian A. Landscape and the philosophy of aesthetics: Is landscape quality inherent in the landscape or in the eye of the beholder? Landscape and urban planning 1999; 44(4): 177–98.
23. Gao J, Chai FH, Wang T, Wang SL, Wang WX. Particle number size distribution and new particle for-mation: New characteristics during the special pollution control period in Beijing. Journal of Environ-mental Sciences 2012; 24(1): 13–20.
24. Chai FH, Gao J, Chen ZX, Wang SL, Zhang YC, Zhang JQ et al. Spatial and temporal variation of par-ticulate matter and gaseous pollutants in 26 cities in China. Journal of Environmental Sciences 2014; 26: 75–82.
25. Steg L, Ven Den Berg AE, De Groot JIM. Environmental Psychology: An Introduction. West Sussex, UK; Wiley-Blackwell; 2013.
26. Chestnut LG, Dennis RL. Economic benefits of improvements in visibility: Acid rain provisions of the 1990 clean-air act amendments. Journal of the Air & Waste Management Association 1997; 47(3): 395–402.
27. Hanemann WM. Valuing the environment through contingent valuation. The Journal of Economic Per-spectives 1994; 8(4): 19–43.
28. Carson RT, Hanemann WM. Contingent valuation. In: Maler KG, Vincent JR, editors. Handbook of Environmental Economics. North-Holand; 2003.
29. Sikorski C, Luppa M, Schomerus G, Werner P, König H-H, Riedel-Heller SG. Public Attitudes towards Prevention of Obesity. Plos ONE 2012; 7(6): e39325. doi:10.1371/journal.pone.0039325PMID:
22723996
30. Wang Y, Zhang Y-S. Air quality assessment by contingent valuation in Ji'nan, China. Journal of Envi-ronmental Management 2008; 90(2): 1022–1029. doi:10.1016/j.jenvman.2008.03.011PMID:
18468772
31. Milfont TL. Psychology of environmental attitudes: A cross-cultural study of their content and structure. Unpulished doctoral dissertation. Auckland, New Zealand: University of Auckland; 2007.
32. Dunlap RE, Van Liere KD. The“new environmental paradigm”. Journal of Environmental Education 1978; 9: 10–19.
33. Weigel R, Weigel J. Environmental concern: the development of a measure. Environment and Behavior 1978, 10: 3–15.
34. Maloney MP, Ward MP. Ecology: let’s hear it from the people. An objective scale for measurement of ecological attitudes and knowledge. American Psychologist 1973; 28: 583–586.
35. Milfont TL, Duckitt J. The structure of environmental attitudes: A first- and second-order confirmatory factor analysis. Journal of Environmental Psychology 2004; 24: 289–303.
36. Grob A. A structural model of environmental attitudes and behavior. Journal of Environmental Psychol-ogy 1995; 15: 209–220.
37. Bodur M, Sarigollu E. Environmental sensitivity in a developing country: Consumer classification and implications. Environment and Behavior 2005; 37(4): 487–510.
38. Shen J, Saijo T. Reexamining the relations between socio-demographic characteristics and individual environmental concern: Evidence from Shanghai data. Journal of Environmental Psychology 2008; 28: 42–50.
39. Schaffer BS, Riordan CM. A review of cross-cultural methodologies for organizational research: A best-practices approach. Organizational Research Methods 2003, 6: 169–214.
40. Converse JM, Presser S. Survey Questionnaires: Hand Crafting the Questionnaire. Beverly Hills, CA: Sage; 1986.
41. Farh J-L, Cannella AA, Lee C. Approaches to scale development in Chinese management research. Management and Organization Review 2006; 2(3): 301–318.
42. Baron RM, Kenny DA. The moderator-mediator variable distinction in social psychological research: conceptual, strategic, and statistical considerations. Journal of Personality and Social Psychology 1986; 51(6):1173–1182. PMID:3806354
43. Xinhua. China to suffer more from smog. Chinadaily 2013; 1: 31. Available:http://www.chinadaily.com. cn/china/2013-01/31/content_16188944.html
44. Hobbs JE. Liability and traceability in agri-food supply chain. In: Ondersteijn CJM, Wijnands JHM, Huirne RBM, van Kooten O., editors. Quantifying the agri-food supply chain. Netherlands: Springer; 2006.
45. Zander KK, Parkes R, Straton A, Garnett ST. Water Ecosystem Services in Northern Australia—How Much Are They Worth and Who Should Pay for Their Provision? PLoS ONE 2013; 8(5): e64411. doi: