www.atmos-chem-phys.net/16/9221/2016/ doi:10.5194/acp-16-9221-2016
© Author(s) 2016. CC Attribution 3.0 License.
Insights into a historic severe haze event in Shanghai: synoptic
situation, boundary layer and pollutants
Chunpeng Leng1, Junyan Duan1, Chen Xu1, Hefeng Zhang2, Yifan Wang1, Yanyu Wang1, Xiang Li1, Lingdong Kong1, Jun Tao3, Renjian Zhang4, Tiantao Cheng1,5, Shuping Zha5, and Xingna Yu5
1Shanghai Key Laboratory of Atmospheric Particle Pollution and Prevention (LAP3), Department of environmental science
and engineering, Fudan University, Shanghai 200433, China
2Atmospheric Environment Institute, Chinese Research Academy of Environmental Sciences, Beijing 100012, China 3South China Institute of Environmental Sciences, Ministry of Environmental Protection, Guangzhou 510655, China 4Key Laboratory of Region Climate-Environment Research for Temperate East Asia, Institute of Atmospheric Physics,
Chinese Academy of Sciences, Beijing 100029, China
5Key Laboratory of Meteorological Disaster of Ministry of Education, Nanjing University of Information Science and
Technology, Nanjing 210044, China
Correspondence to:Tiantao Cheng ([email protected]) and Xiang Li ([email protected]) Received: 25 August 2015 – Published in Atmos. Chem. Phys. Discuss.: 19 November 2015 Revised: 13 June 2016 – Accepted: 24 June 2016 – Published: 27 July 2016
Abstract. A historic haze event, characterized by lengthy, large-scale and severe pollution, occurred in the Yangtze River Delta (YRD) of China from 1 to 10 December 2013. This haze event significantly influenced air quality through-out the region, especially in urban areas. Aerosol physical, chemical and optical properties were measured in Shang-hai. Sometimes the 1 h average particle concentration (e.g., PM2.5)exceeded 600 µg m−3. Inorganic water-soluble ions
in particles, trace gases and aerosol optical coefficients had a similar tendency to increase evidently from clear to hazy episodes. A combination of various factors contributed to the formation and evolution of the haze event, among which me-teorological conditions, local anthropogenic emissions and pollutants are the major factors. High pressure system, calm surface wind and subsidence airflow were responsible for the decrease of planetary boundary layer (PBL) and the ac-cumulation of pollutants. Atmospheric visibility correlated strongly with relative humidity (RH), particle number in size of 600–1400 nm other than particulate water-soluble species and particle mass (PM2.5). The particle hygroscopicity plays
an important role in atmospheric visibility reduction. The re-sults are somewhat helpful to forecast and eliminate regional atmospheric pollution in China.
1 Introduction
Atmospheric aerosols are either emitted from human activi-ties and natural sources or formed by a variety of precursor photochemical reactions. Aerosol exerts great impacts on the earth’s radiation balance and climate by directly scattering and absorbing solar and terrestrial radiation, and indirectly modifying cloud and precipitation by acting as cloud conden-sation nuclei (CCN) (Ramanathan et al., 2001; Andreae et al., 2005; Lohmann and Feichter, 2005). In lower atmospheric layers, aerosol particles can accumulate and result in air pol-lution under unfavorable dispersion conditions, and then pro-duce the adverse effects on human health and atmospheric visibility (Wu et al., 2005). Haze is an atmospheric phe-nomenon where the sky clarity is obscured by dust, smoke and other dry particles, during which atmospheric visibil-ity and relative humidvisibil-ity (RH) are usually below 10 km and 80 % (Wu et al., 2006; Xiao et al., 2006; Fu et al., 2008; Bell et al., 2011).
al., 2006; Che et al., 2009). Four major regions are mostly influenced by haze in China, i.e., the Jing-Jin-Tang Region (JJT), the Yangtze River Delta (YRD), the Sichuan Base (SCB) and the Pearl River Delta (PRD). The hazy days in-creased significantly from 70 days in 2001 to 144 days in 2004 in Guangzhou (Liu et al., 2013). Although the hazy days decreased quickly from 223 days in 1982 to 73 days in 2005 in Beijing after measures implemented on manage-ment of coal demand, motor vehicles, industrial and dust emissions, it increased again in 2011 and posed significant effects on society (Liu et al., 2013). Wang et al. (2006b) compared the aerosol chemical compositions of dusty, hazy and clear days in Beijing, and pointed out that (NH4)2SO4,
NH4NO3and Ca(NO3)2were the major species during hazy
days in spring. Sun et al. (2006) found that the concentra-tions of aerosol elements and water-soluble ions in haze–fog episodes were over 10 times those in clear days in Beijing. The YRD region, one of the important economic core areas with a large population, high urbanization and advanced in-dustrialization in China, is facing an inter-annual increase of foggy and hazy days, especially in winter (Tie and Cao, 2009). Ye et al. (2011) discovered the important role of am-monia in haze formation in Shanghai. Du et al. (2011) pro-vided insights into summer haze events over Shanghai, and pointed out that the secondary pollutants of increasing sul-fate and nitrate were oxidized from large amounts of SO2and
NO2under a high atmospheric oxidation condition. Kang et
al. (2013) regarded more accumulation mode particles and higher RH as the main reasons of atmospheric visibility im-pairment during haze episodes in Nanjing.
To date, available studies on haze in the YRD mainly put efforts to the chemical compositions and physical character-istics of pollutants, but in view of synoptic few focused on the entire process of events at larger scales. It is meaningful to investigate the formation and evolution of regional haze events for useful information to forecast and reduce severe atmospheric pollution. A winter haze event occurred in the YRD during 1–10 December 2013, known as one historic severe event with features of lengthy, large-scale and strong pollution. This paper performs a detailed analysis of this se-rious haze event and gives insights into regional heavy atmo-spheric pollution in such a fast-developing area.
1119 mm, mainly occurring between May and September, and the wind prevails northeasterly in winter and southeast-erly in summer. Atmospheric components are likely to orig-inate from local emissions and remote sources (Du et al., 2011). Local time (LT) used in this study is 8 hours ahead of UTC.
2.2 Instrument and measurements
Major water-soluble ions (Na+, K+, Mg+, Ca+, SO24−, Cl−, NO−3 and NH+4)in aerosol particles were measured by an analyzer for Monitoring Aerosols and Gases (MARGA, ADI 2080, Netherlands) at 1 h time resolution. Ambient air is drawn into the sample box with airflow of 1 m3h−1 by a pump with mass flow controller (MFC), and the sepa-rated gases and aerosols are selectively dissolved and then analyzed by ion chromatography. An internal calibration method, using bromide for the anion chromatograph and lithium for the cation chromatograph, was operated over the whole period to ensure the instrument would identify and measure ion species successfully. The detailed information of sampling, operation and internal calibration can be found elsewhere (Du et al., 2011).
Aerosol particle size distributions in 10 nm–10 µm were observed using a high-resolution wide-range particle spec-trometer (WPS-1000 XP, MSP). The description of instru-ment, combining laser light scattering (LPS), condensation particle counting (CPC) and differential mobility analysis (DMA), has been introduced in detail by Gao et al. (2009). DMA and CPC can effectively count particles in 10–500 nm, while LPS is designed to measure particles in 350 nm–10 µm. The instrument took 3 min to scan the entire size range com-pletely, 60 channels in DMA and 24 channels in LPS (2 s per channel). Before the campaign, DMA was calibrated using the National Institute of Standards and Technology (NIST) standard reference materials (SRM) 1691 and SRM 1963 polystyrene latex (PSL) spheres (mean diameter of 0.269 and 0.1007 µm) to maintain proper transfer function and accurate particle sizing. LPS was calibrated using four NIST trace-able sizes of PSL (i.e., 0.701, 1.36, 1.6 and 4.0 µm). Zhang et al. (2010) described the calibration and operation methodol-ogy of WPS in detail.
and 5 L min−1airflow rate. According to the strong ability of
BC absorption to near-infrared lights, its mass can be deter-mined using the light attenuation at 880 nm and the appro-priate specific attenuation cross section proportional to BC (Petzold et al., 1997). The attenuation is calculated based on the intensity difference of reference and sensing beams be-tween light on and off (Hansen et al., 1984; Weingartner et al., 2003). In order to screen the impacts of other absorptive material, the data contaminated by mineral aerosols were ex-cluded from BC measurements. Details for instrument op-erating and calibrating and data processing can be found in Cheng et al. (2010).
Aerosol backscattering profile was measured by a set of micro-pulse lidar (MPL-4B) with pulse energy of 6–10 µJ and repetition frequency of 2500 Hz. To date, MPL is utilized widely in most parts of world as an effective tool for captur-ing high temporal resolution information of aerosol vertical distributions (Menut et al., 1999; Cohn and Angevine, 2000; Brooks, 2003). Planetary boundary layer (PBL) height is de-termined by the MPL measurement at the altitude where a sudden decrease of scattering coefficients occurs (Boers and Eloranta, 1986). Instrument calibrations, normalization pro-cess, and the analyses of errors propagation and correction uncertainties in MPL processed signal have been described by Campbell et al. (2002), Welton and Campbell (2000) and Welton et al. (2002).
Aerosol scattering coefficients (525 nm) were measured using an Aurora-1000 nephelometer (Ecotech Pty Ltd., Aus-tralia) at 5 min resolution. The scattering coefficient is calcu-lated by integrating the scattering intensities from angles 7 to 170◦. The relative humidity (RH) inside the instrument was
retained below 60 % to prevent excessive water vapor from entering the chamber. The zero check was operated automat-ically each day using particle-free air, while the span check was done every 2 weeks using R-134a gas.
A CCN counter (CCN-100, DMT, USA) with continuous flow and single column (Roberts and Nenes, 2006; Lance et al., 2006) was employed to monitor CCN concentrations at supersaturations (SS) of 0.2–1.0 %. The ambient aerosols were firstly dried by a dryer (activated carbon) to lower rela-tive humidity (RH) below 30 %, and subsequently introduced into the counter. The instrument has been calibrated for SS using standard (NH4)2SO4 particles every 3 months since
2010. According to the instrument operation manual, regu-lar calibrations were also performed for temperature gradi-ent, input and shear airflows and pressure to maintain stable SS (Leng et al., 2013, 2014a, b). Periodic zero checks were done to ensure counting accuracy for optical particle counter (OPC) inside the CCN counter.
Moreover, two continuous ambient particulate monitors (FH62C14, Thermo) were used to measure PM2.5and PM10
(particles in aerodynamic diameter<2.5 and<10 µm). The particles are deposited on a glass fiber tape, and then detected by the method of beta attenuation. The particle mass con-centration is obtained from the simultaneous measurements
of mass and volume of one aerosol sample. An automatic weather station (HydroMet, Vaisala) and a visibility moni-tor (Vaisala) were employed to measure meteorological vari-ables and atmospheric visibility. The data of hourly averaged concentration of gases (SO2, NO2, CO and O3)were from
the Shanghai Environmental Monitoring Center (SEMC).
3 Results and discussion 3.1 Overview of haze event
3.1.1 Identification of hazy episode
The key criterion for discerning a haze event is an ap-parent decrease of atmospheric visibility less than 10 km and ambient relative humidity (RH) below 80 % lasting for several hours (Fu et al., 2008; Du et al., 2011). When 80 %<RH<90 %, the event is referred to as a complex of haze-fog co-occurring or transition (Leng et al., 2014a), and it is also classified as hazy episode in the present study.
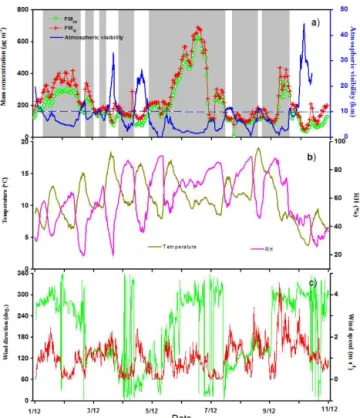
Figure 1a depicts the temporal variations of hourly PM2.5, PM10, atmospheric visibility and meteorological
fac-tors from 1 to 10 December 2013. On the whole, atmo-spheric visibility mostly declined to below 10 km, and RH hardly reached 90 %. The haze event constituted several sub-episodes, marked by gray areas in Fig. 1a. It was clear that Shanghai suffered from a long-term haze event until 10 De-cember, and subsequently loosened when atmospheric visi-bility improved and the clean sky took control afterwards. In fact, these hazy sub-episodes approximately accounted for 70 % of the entire period, with mean atmospheric visibilities of 5.65 km for the former compared to 29.45 km for the rest (30 %).
On a larger scale, this haze event caused a historic atmo-spheric pollution, and attacked most parts of central and east-ern China. PM2.5in many cities exceeded 150 µg m−3, and
some more than 300–500 even 600 µg m−3; as expected, this
event will cause invisible but serious problems to people’s health in the following days (Cao et al., 2012).
3.1.2 Meteorological conditions
Precipitation did not appear during the whole campaign. For most of the period (Fig. 1b and c), ambient RH and tem-perature correlated negatively and showed an evident diur-nal pattern, varying in the ranges of 20–87 % and 6–17◦C,
Figure 1. (a)Temporal variations of PM2.5, PM10and atmospheric
visibility (vis) measured in Shanghai from 1 to 10 December 2013. The dashed line is visible at 10 km.(b, c)show temporal variations of meteorological parameters from 1 to 10 December 2013.
pollutants due to a transiting cold front (Fig. 1b and c). The wind direction was basically northeast or southeast during the clean periods, originating from marine areas. However, the wind normally turned into northwest when the haze took over, which will probably bring a large quantity of pollutants from inland areas and to some extent cause pollutant accu-mulation in downwind.
3.1.3 Particulate mass concentration
PM2.5 and PM10 were employed to represent ambient
par-ticulate mass burden per volume in the atmospheric bound-ary layer. One hour average PM2.5and PM10 ranged within
50–600 and 55–680 µg m−3throughout the whole campaign (Fig. 1a), and both of them significantly rose during the hazy episodes with averages of 315 and 333 µg m−3, compared to
112 and 134 µg m−3in the clean periods. On the other hand,
the ratios of PM2.5/PM10varied between 0.54 and 0.97, and
averaged at 0.88, 0.93, 0.8 in total, hazy and clean periods, indicating that the fine particles are major contributors to par-ticle mass.
Interestingly, both PM2.5and PM10reached their peaks of
600 and 680 µg m−3 as new historic records on 6 Decem-ber, approximately 14 times higher than the Grade I crite-ria of the National Ambient Air Quality Standard of China (50 µg m−3 for PM10), and 24 times the World Health
Or-Figure 2. Temporal variations of PM2.5 in Hangzhou, Nanjing
and Hefei(a)and their mean concentrations from 1 to 10 Decem-ber 2013.
ganization Air Quality Guidelines (25 µg m−3 for PM2.5).
Other cities in the YRD showed a similar tendency and high PM2.5 along with this haze event; such as 226 µg m−3 in
Hangzhou, 230 µg m−3in Nanjing and 260 µg m−3in Hefei (Fig. 2). The numerous measurements earlier in Shanghai during the last decade showed much lower values. For exam-ple, Wang et al. (2006a) observed that PM2.5 varied within
17.8–217.9 µg m−3and averaged at 94.6 µg m−3. According
to the Shanghai Environmental Bulletin 2010 (SEB, 2010, www.envir.gov.cn/law/bulletin/2010/), the annual average of PM10 in 2009 was about 79 µg m−3. Leng et al. (2014a)
re-ported PM2.5 average of 143 µg m−3 during hazy episode
and 46 µg m−3during clear episode in November 2010. They also observed that PM2.5 varied in 10–210 µg m−3 in
Jan-uary 2011 and 10–130 µg m−3 in April 2012, respectively (Leng et al., 2013, 2014b). In addition, compared to Bei-jing as another megacity in China, He et al. (2001), Sun et al. (2004) and Liu et al. (2013) monitored PM2.5extremes of
357 µg m−3from July 1999 to September 2000, 349 µg m−3 in winter from 2002 to 2003, and 220 µg m−3 in Septem-ber 2011. Briefly, the particulate mass burden was extremely high in this haze event, and so serious air pollution, un-suitable for human beings (Liu et al., 2013), must cause a formidable environmental disaster.
3.1.4 High aerosol columnar loading
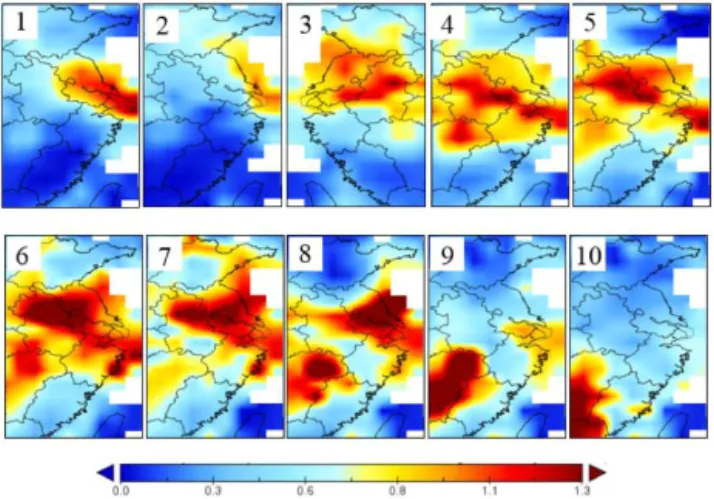
Figure 3. Aerosol optical depth (AOD) at 550 nm from MODIS over the YRD region at 06:00 (UTC) from 1 to 10 December 2013 (http://modis.gsfc.nasa.gov/).
During the most serious days, AODs were as high as 1.00–1.25 on 5–8 December. According to the records of the Ministry of Environmental Protection of China (http: //www.zhb.gov.cn/), many cities in the upwind areas (e.g., Nanjing, Wuxi, and Suzhou) had higher AODs up to 1.5 and an air quality index (AQI) over 500, implying that the in-flow of pollutants to Shanghai will inevitably contribute to the pollution. In addition, the weak circulation (Sect. 3.2.1) normally led to the build-up of pollutant pooling and con-tributed to the haze event formation.
3.1.5 Aerosol optical properties
Figure 4 shows a temporal series of BC, aerosol scattering coefficient Sc (525 nm), and aerosol absorption coefficient Ab (532 nm). Based on the assumption that the averaged mixing state of BC is uniform, the Ab coefficient is indi-rectly calculated from measured BC according to the follow-ing equation (Yan et al., 2008),
Ab=α× [BC], (1)
where [BC] represents BC mass concentration, andαis BC absorption efficiency which is adopted as 8.28 g m−2in this paper. This value was obtained from the inter-comparison ex-periment performed in southern China previously, and was within the variance range of various source regions (Bergin et al., 2001; Bond and Bergstrom, 2006; Yan et al., 2009; Zhao et al., 2013). The aerosol scattering and absorption coeffi-cients in combination determine its extinction ability, namely aerosol extinction coefficient (Ex=Ab+Sc).
Basically, BC, Sc and Ab had the same tendency to in-crease in the hazy episodes, and reached their max values at 00:00 LT on 6 December, i.e., 35 µg m−3, 2.8×10³ and 290 M m−1, approximately 4–5 times higher than their mean values in the clean periods (8.3 µg m−3, 643 and 58 M m−1).
Figure 4.Temporal variations of black carbon (BC) concentration,
aerosol scattering (Sc) and absorptive (Ab) coefficients from 1 to 10 December 2013.
The enhancement of aerosol optical properties largely con-tributed to atmospheric visibility decreasing, which corre-spondingly deteriorated to its minimum of 50 m at the same moment (Fig. 1). The mean aerosol single scattering albedo (SSA=Sc/Ex, 532 nm) was expectedly low at 0.89, indicat-ing more absorptive species existindicat-ing in the particle group. 3.1.6 Condensation nuclei and cloud condensation
nuclei
Aerosol size distribution was analyzed in detail to shed some light on its relationship with haze. Figure 5a presents a time series of aerosol size spectra and integrating particle size-resolved number concentrations (NCN).NCNshowed an
ev-ident diurnal pattern with two peaks corresponding to the traffic rush hours, and a higher mean and instantaneous val-ues appeared in the hazy episodes (15 000 and 25 000 cm−3)
than the clean periods (9500 and 17 000 cm−3). Generally,
ambient aerosol particles in higher loading were mainly dis-tributed in a wider size range over the hazy episodes than the clean periods: 20–200 nm for the former and 20–100 nm for the latter. The averaged aerosol number size distribution is shown in Fig. 5b. About 67 % of particles fell in the size range of 10–100 nm, and the percent further increased to 91 % when enlarged to 10–200 nm. This result is in good agreement with the early observations that urban ambient aerosols mainly distribute in ultrafine size section (Woo et al., 2001; Gao et al., 2007), slightly higher than 62 % reported in Nanjing and 61 % in Atlanta, a little lower than 72 % in East-ern Germany and significantly lower than 94 % in Taicang (Woo et al., 2001; Tuch et al., 1997; Gao et al., 2009; Kang et al., 2013).
Figure 5. (a)Time series of 4-min mean aerosol number size spec-tra and aerosol number concenspec-tration (pink line) and(b)averaged aerosol number size distribution from 5 to 10 December 2013.
Figure 6.Time series of 1 h mean CCN concentration (NCCN)at
supersaturations (SS) of 0.2–1.0 % from 6 to 10 December 2013.
(NCCN)and aerosol activity promotes effectively during the
polluted periods (Leng et al., 2013, 2014a). In north India, Ritesh et al. (2007) observed a significant impact of win-ter haze on NCCN. To gather more information about CCN
during haze, hourly NCCN at SS of 0.2–1.0 % were
plot-ted as a function of time in Fig. 6. As expecplot-ted, NCCN
in-creased with SS, i.e., 3800–10 000 cm−3 at SS 0.2 % and 4000–16 000 cm−3at SS 1.0 %, and exhibited bimodal daily distributions.NCCNrelated well withNCN, andNCCNgreatly
enhanced during the hazy episodes, about 1.6–1.8 fold (on varying SS) of that during the clean periods.
3.1.7 Aerosol chemical species
A key for understanding haze is to characterize both aerosol composition and trace gases quantitatively (Du et al., 2011). As important components of atmospheric particles, water-soluble inorganic ions are thought to be a significant contrib-utor to atmospheric visibility impairment (Kang et al., 2013). The time series of hourly water-soluble inorganic ions in PM2.5, including Na+, K+, Mg+, Ca+, SO24−, Cl−, NO−3
Figure 7.Temporal variations of chemical species in particles from
1 to 10 December 2013.
and NH+4, and gaseous pollutants such as SO2, NO2, CO
and O3 from 1 to 10 December are presented in Fig. 7.
Aerosol water-soluble ions, highly coinciding with particu-late mass, showed higher contents in the hazy episodes than the clean periods. Totally, the mean concentrations of these ions were comparable to that monitored earlier in Shang-hai (Yao et al., 2002; Wang et al., 2006a; Du et al., 2011). The mean concentrations of these ions were in sequence of NO−3 >SO24−>NH+4 >Cl−>K+ >Na+>Mg2+, and
their contributions to PM2.5were 11.7, 7.7, 6.7, 1.5, 0.6, 0.3
and 0.08 %, respectively, slightly higher than that observed in haze pollution in Nanjing and Guangzhou (Tan et al., 2009; Kang et al., 2013). Overall, the integrated water-soluble ions accounted for 28.5 % of PM2.5, higher than the dust event but
significantly lower than the biomass burning event observed in Nanjing (Zhang et al., 2012).
Gaseous species play a vital role in atmospheric process by acting as precursors or mediums of photochemical reactions. Among them, O3 has been widely known as the products
of photochemical reactions between volatile organic com-pounds (VOCs) and nitrogen oxides (NOx)with the partic-ipation of heat and sunlight, while SO2, NO2, and CO are
mainly emitted from biomass, fuel and coal burning (Se-infeld and Pandis, 2006). Shown in Fig. 7, the measured gaseous pollutants exhibited an increasing trend during the hazy episodes, with one exception of O3 probably due to
consumption by oxidation of NO and other species (Liu et al., 2013).
NO−3 and SO24−are products of NO2 and SO2due to
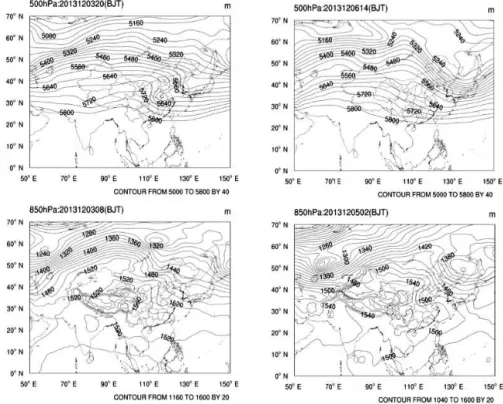
Figure 8.Atmospheric circulation situation at 500 and 850 hPa from 3 to 6 December 2013.
NOR=nNO−3/(nNO−3 +nNO2) (2)
SOR=nSO24−/(nSO42−+nSO2), (3)
where NOR and SOR means nitrogen oxidation rate and sul-fur oxidation rate, n refers to molar concentration. It can be easily deduced that larger NOR and SOR would gener-ate more atmospheric aerosols, and atmospheric photolysis reaction of SO2 would take place if the oxidation rate
ex-ceeds 0.1 (Ohta and Okita, 1990). In this study, NOR and SOR were always higher than 0.1 with averages of 0.14 and 0.27, respectively, suggesting that atmospheric oxidation of NO2 and SO2 contributed significantly to the formation of
particulate matter. The mean NOR was comparable to that in Nanjing (0.16) during a long-lasting haze event but ap-parently lower than in Guangzhou (0.24), while the SOR was much higher than in Nanjing (0.13) but comparable to the value in Guangzhou (0.26) (Tan et al., 2009; Kang et al., 2013). Meanwhile, NO2overwhelmingly surpassed SO2
with a mass ratio of 1.53, hence more atmospheric H2O2and
OH would be removed via reactions with NO2, and the
for-mation of SO24−would be greatly suppressed due to the com-petition effect (Poppe et al., 1993). Furthermore, the mass ratio of ambient nitrate to sulfate (NO−3 /SO24−)can help to track the relative importance of stationary vs. mobile sources of nitrate and sulfur in the atmosphere (Yao et al., 2002). The stationary emission dominates in the sources of SO2and NO2
if the ratio is less than 1.0; otherwise SO2 and NO2mainly
come from traffic activities (Huebert et al., 1988). Shanghai has been experiencing an increasing trend of NO−3/SO24− be-cause of the very fast development of motor vehicles over the past decade (Yao et al., 2002; Wang et al., 2006a; Fu et al., 2008). Therefore, more contribution of pollutants from mobile sources is expected to the local pollution. The mean NO−3 /SO24− during this haze event was 1.53, comparable to our early measurement in 2010 (1.61), but significantly higher than those observed in haze events in Guangzhou (1.02) and Nanjing (0.84 and 1.05) (Tan et al., 2009; Kang et al., 2013; Leng et al., 2013). The traffic-emitted SO2and
NO2preponderating their stationary sources so conspicuous
illustrated that the increasing traffic activities are one of main reasons for visibility degradation.
3.2 Formation and evolution of haze event 3.2.1 Atmospheric circle and synoptic situation
During wintertime, the YRD region is often influenced by cold air from the north, such as cold high pressure and cold front, and surface temperature inversion takes place some-times (Chen et al., 2003; Liu et al., 2013). Under those condi-tions, atmospheric mixing and dispersion are basically weak in favor of pollutant accumulation, hence haze or fog easily occurs (Xu et al., 2011; Zhao et al., 2013).
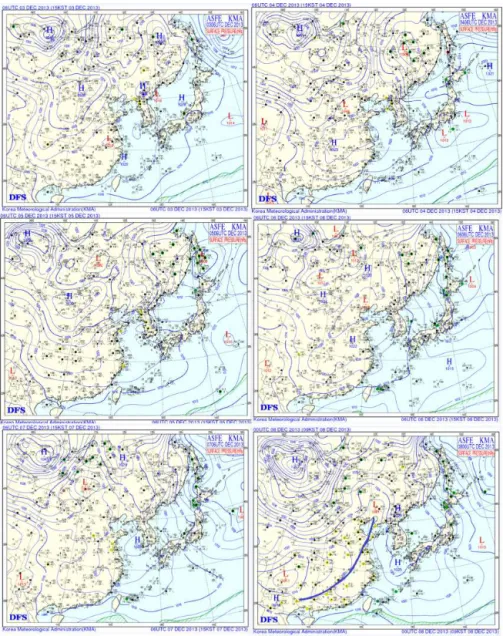
De-Figure 9.Surface weather maps from 3 to 8 December 2013. The black circles denote the measurement site (http://qixiangxinxifabupingtai. ejinqiao.com).
cember, the atmospheric circulation in this region was rep-resentative of two troughs and one ridge, and these troughs were located in the west of the Balkhash lake and the north of northeastern China and a wide ridge of high pressure ex-isted between them (Fig. 8). On 6 December, the circulation situation changed to two troughs and two ridges, and these troughs were located in the west of Lake Baikal and the east of Asia. However, over the central and southern China, there were flat westerly flows most of the time with smaller radial degree and fast-moving short-wave troughs and ridges. Dur-ing the haze event, central and southern China was mainly under the stable westerly, and the YRD was affected by it. Additionally, at 700 hPa, the shear lines generated continu-ously and moved eastwards, and the difference between tem-perature and dew point mostly exceeded 4◦, and the weak
westerly and wind convergence appeared over the areas cov-ered by haze clouds. At 850 hPa, the YRD was influenced by an anticyclonic ring most of the time; the wind speed was smaller, even static; and in view of temperature, this region was in one weak warm structure and the isotherms were rel-atively flat.
altitude. Unfavorable ambient temperature posed another ad-verse effect on the thermal dynamic development of PBL height. The small pressure gradients over the YRD would horizontally suppress the air circulation at large scales be-cause of low wind speed mostly below 2 m s−1 during the hazy episodes. Under those favorable situations, e.g., sta-ble synoptic condition and calm wind, atmospheric pollu-tants were easy to accumulate within the surface atmospheric layer which ultimately led to severe urban air pollution. On the other hand, the YRD was sometimes controlled by low pressure periphery and trough, and the pressure gradient was relatively weak. Although the low pressure was conducive to the rise of air masses, the vertical movement of upper and lower levels of the atmosphere was too weak to produce the effective dispersion of air pollutants and then result in pol-lution. Furthermore, the effect of ambient aerosols uptaking water vapor would effectively enhance their ability of scat-tering or absorbing solar radiation and damage atmospheric visibility eventually. The high ambient RH (60–80 %) over this haze process indeed made a rich supply of water vapor for enhancing aerosol hygroscopic growth and was mostly responsible for the atmospheric visibility impairment. Nor-mally, external forces such as high wind or rainfall are nec-essary to interrupt the stable situation and favor the diffusion of pollutants.
Over the target region (30◦40′∼31◦53′), during the haze event, the vertical winds were almost less than 0.4 Pa s−1 be-tween 500 hPa and surface, and it was less than 0.2 Pa s−1at 700 hPa, implying that the vertical exchange of air parcels between the upper and lower atmospheric layers is very weak. Near the ground, the vertical velocity of winds was positive, and the relative vorticity was zero or negative value most of the time, demonstrating that airflow was prevailed in downdraft at the bottom of the atmosphere. Moreover, the temperature profile of sounding data revealed that the strong inversions occurred in 5 days with relatively low heights, so atmospheric convection and turbulence were inhibited, and then the blocked diffusion in vertical direction caused pollu-tant accumulation near the surface.
In summary, atmospheric pollutants were restricted within shallow layer, favorable for visibility impairment due to the dominance of a weak high-pressure system with low-pressure gradients, subsidence airflow, unfavorable PBL height and meteorological situation. In good agreement with our study, Wu et al. (2005) reported that descending air motion and weak horizontal wind produced significantly high particle concentrations during a severe haze event in Guangzhou. Also in the YRD area, Fu et al. (2008) found that a high-pressure system responsible for stagnant conditions was the major reason of high-pollution events. The stable synoptic condition and its long duration was indeed viewed as one of the most important factors ruling the formation and evolution of this haze event.
Figure 10.Air mass 48 h backward trajectories arriving at Shanghai
from 1 to 10 December 2013. A new trajectory is started at 00:00 (UTC) and calculated every 24 h.
3.2.2 Impacts of air mass pathways
HYSPLIT-4 model, developed by the Air Resources Labo-ratory (ARL) of the National Oceanic and Atmospheric Ad-ministration (NOAA) of the USA (Draxler and Rolph, 2003), was employed to compute 48 h air mass backward trajecto-ries at 500 m height, starting at 00:00 and 12:00 UTC for each day. By doing so, we can identify and compile a full view of the possible source regions of pollutants.
mean PBL height from 1 to 10 December.
3.2.3 Reduction of PBL height
PBL plays a vital role in determining the vertical dispersion of air pollutants that are emitted naturally or artificially from the Earth’s surface (Kim et al., 2007; Liu et al., 2013). De-creasing the height of PBL can normally hold the pollutants within the shallow surface layer, suppress the vertical atmo-spheric dilution and ultimately cause regional environment shrouded by pollution (Kim et al., 2007). In Shanghai, sev-eral field measurements have monitored that PBL height is usually low during hazy episodes (Leng et al., 2014b; Zhang et al., 2015). By utilizing the normalized lidar backscatter signal at 532 nm, the PBL retrieval at 30 s resolution was de-rived in this study, and the time–height series were plotted in red line in Fig. 11. Overall, PBL height was negatively correlated with atmospheric visibility withR2 of 0.63, and averaged at 1.3 km during the clean periods and 0.6 km dur-ing the hazy episodes. From midday on 5 to the night on 6 December, the height of PBL decreased to 400 m lasting more than 30 h, and PM2.5 during this period enhanced to
over 600 µg m−3, 5.4 times the average of the clean periods. The lower PBL heights will retain more pollutants in the sur-face layer and cause the city to be surrounded by haze.
In theory, PBL basically evolves as a function of atmo-spheric thermal and dynamic factors, e.g., air temperature and wind speed (Liu et al., 2013). In fact, there is a feed-back between atmospheric aerosol loading and PBL height. Briefly, the more ambient aerosols accumulate, the less solar radiation reaches to surface, which inevitably poses a dis-advantageous effect on surface air temperature as well as a positive impact on ambient RH, and further restricts the de-velopment of PBL. The low PBL height in turn forces the accumulation of aerosol particles in the high RH and shallow atmosphere, and ultimately degrades atmospheric visibility (Liu et al., 2013). Otherwise, more solar radiation arrives at the ground in case of clean sky, under those conditions the air temperature and PBL height increase while the ambient RH drops, which is unfavorable to the haze formation. This scientific issue involves many complicated atmospheric pro-cesses remaining poorly understood as well as deserving
fur-As important components of ambient particles, particle-phase water-soluble inorganic ions generally account for 30 % of particulate matter in urban atmosphere, and are con-sidered as a great contributor to the atmospheric visibility im-pairment because they hugely determine the ability of aerosol particles to uptake water vapor (Hillamo et al., 1998; An-drews et al., 2000; Chow et al., 2006; Seinfeld and Pandis, 2006). Also, they are essential participants in the formation, growth and evolution of nanoparticles by providing signif-icant potential of surface chemical reactions (Wang et al., 2006b). In Shanghai, sulfate and nitrate have been evidently identified as great contributors to the occurrence of heavy particulate pollution events (Wang et al., 2006b; Sun et al., 2006; Fu et al., 2008), and NH3plays a vital role in the
en-hancement of particulate sulfate and nitrate (Ye et al., 2011). When ambient RH is high, those aerosols that are more hydrophilic can grow in diameter via uptake of water vapor, and through this way they can increase their ability of scatter-ing light and cause atmospheric visibility impairment (Tang, 1996). A kappa valueκ, describing particle hygroscopicity, was firstly introduced by Petters and Kreidenweis (2007) and employed here to investigate its relationship with haze formation. Assuming ambient aerosols are well internally mixed, the effective integrated κ can be obtained through weighting their chemical compound volume factions,
κ=
εiκi X
i
, (4)
where εi is the volume fraction of chemical compounds in particles, and κi is the effective κ of individual chem-ical composition. Equation (5) has been widely used and described elsewhere in detail (Petters and Kreiden-weis, 2008; Yue et al., 2011; Leng et al., 2014a, b). In this study, aerosol particle compositions were clas-sified into three categories, and κi and εi for individ-ual composition are listed in Table 1, of which “others” refers to PM10−(SO24−+NO−3 +NH+4 +Cl−+Na+), and
Figure 12.Scatter plots of RH, BC, PM2.5and inorganic ions in
particles vs. atmospheric visibility.
Table 1. Effective hygroscopicity parameters (κ)and densities of
the three category compositions.
Density Species Data source κ (g cm−3)
Sulfate & nitrate SO24−+NO−3 +NH+4 0.6 1.7 Sodium chloride Cl−+Na+ 1 2.2 Insoluble compounds Others 0 2.0
higherκduring the hazy episodes (0.22) and lowerκ during the clean periods (0.15), indicating that aerosols are basically more hygroscopically responsible for haze occurrence during the pollution period.
With the aim of better understanding the potential con-tribution of individual water-soluble ions, BC and ambient RH to atmospheric visibility impairment, we run nonlinear regression analysis and the results are plotted in Fig. 12. The correlation between atmospheric visibility and individ-ual ions, BC and PM2.5was not so impressive withR2from
0.11 to 0.22. However, it became more significant in view of ambient RH with R2 of 0.41. The result suggests that the atmospheric visibility impairment is less driven by water-soluble ions but largely induced by hygroscopicity, consis-tent with Tang (1996) and Jansen et al. (2014).
3.2.5 Aerosol size spectra
Atmospheric aerosol particles are usually divided into four classes according to their size distribution, i.e., nucleation mode (<25 nm), Aitken mode (25–100 nm), accumulation mode (100–1000 nm), and coarse mode (>1000 nm) (Zhang et al., 2010). The ability to determine the amount of visi-ble light scattered by atmospheric aerosols relies strongly on their number size distributions, of which accumulation mode plays the major role yet coarse and nucleation mode exert a minor contribution (Cheng et al., 2008b). Numerous stud-ies have observed the inter-relationship between atmospheric
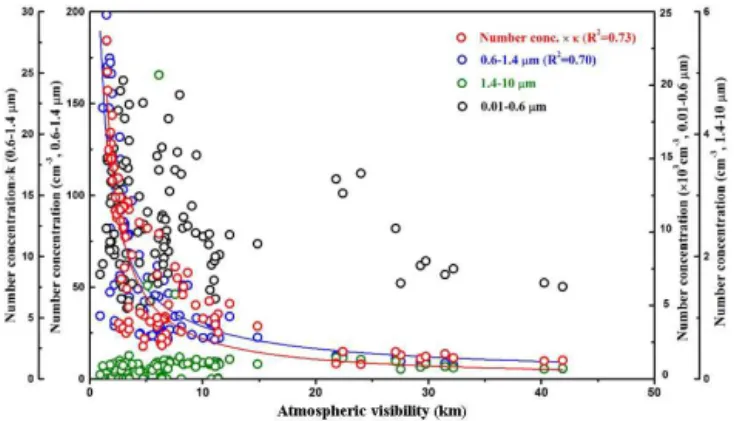
Figure 13.Scatter plots of aerosol number concentrations in ranges
of 0.01–0.6, 0.6–1.4 and 1.4–10 µm, and aerosol number concen-tration multiplied by particle hygroscopicity (kappa value,κ)vs. atmospheric visibility.
visibility and aerosol number size distribution (Cheng et al., 2008a; Jansen et al., 2014). To be more specific, Kang et al. (2013) reported that the expected reciprocal relationship was found only between atmospheric visibility and aerosols in 600–1400 nm instead of other sizes.
Accordingly, aerosol particles were classified into three categories, i.e., 10–600 nm, 600 nm–1.4 µm and 1.4–10 µm. By doing so, their nonlinear regression analysis with atmo-spheric visibility was computed and the results were given in Fig. 13. As expected, no significant correlation was de-rived between atmospheric visibility and aerosol size of 10– 600 nm and 1.4–10 µm, whereas aerosols in 600 nm–1.4 µm indeed controlled atmospheric visibility to a great extent with R2of 0.70, which further improved to 0.73 if we combined aerosol hygroscopic potential well determined by its size-resolved composition. In this study, aerosol number concen-trations in 600 nm–1.4 µm were on average 110 cm−3during the hazy episodes and 43 cm−3during the clean periods. The atmospheric visibility was dependent on aerosol number size distribution and its impairment during the hazy episodes was mostly caused by the enhancement of aerosol concentration in 600 nm–1.4 µm.
4 Summary and conclusion
A historic haze event was fully analyzed for the temporal variations of aerosol optical, physical and chemical prop-erties and meteorological conditions, as well as the for-mation and evolution mechanism. During the event, atmo-spheric visibility decreased dramatically, while particle bur-den, water-soluble inorganic ions, aerosol scattering and ab-sorption coefficients evidently increased. In particular, par-ticulate mass burden produced a new historic record by ex-ceeding 600 µg m−3.
Acknowledgements. This research is supported by the National Key Technology R&D Program of Ministry of Science and Technology (2014BAC16B01), the National Natural Science Foun-dation of China (41475109,21577021, 21377028 ), and partly by the Jiangsu Collaborative Innovation Center for Climate Change, and the Key Laboratory for Aerosol-Cloud-Precipitation of China Meteorological Administration (KDW1401) and the Laboratory of Meteorological Disaster of Ministry of Education (KLME1416).
Edited by: S. S. Gunthe
Reviewed by: three anonymous referees
References
Andreae, M. O., Jones, C. D., and Cox, P. M.: Strong present-day aerosol cooling implies a hot future, Nature, 435, 1187–1190, 2005.
Andrews, E., Saxena, P., Mussara, S., Hildemann, L. M., Koutrakis, P., McMurry, P. H., Olmez, I., and White, W. H.: Concentration and composition of atmospheric aerosols from the 1995 SEAVS experiment and a review of the closure between chemical and gravimetric measurements, J. Air Waste Manage., 50, 648–664, 2000.
Bell, M. L., Cifuentes, L. A., Davis, D. L., Cushing, E., and Telles, A. G.: Gouveia, N. Environmental health indicators and a case study of air pollution in Latin American cities, Environ. Res., 111, 57–66, 2011.
Bergin, M., Cass, G. R., Xu, J., Fang, F., Zeng, L. M., Yu T., Salmon, L. G., Kiang, C. S., Tang, X. Y., Zhang, Y. H., and Chameides, W. L.: Aerosol radiative, physical, and chemical properties in Beijing during June 1999, J. Geophys. Res., 106, 17969–17980, 2001.
Boers, R. and Eloranta, E. W.: Lidar measurements of the atmo-spheric entrainment zone and the potential temperature jump across the top of the mixed layer, Bound.-Lay. Meteorol., 34, 357–375, 1986.
Bond, T. C. and Bergstrom, R. W.: Light Absorption by Carbona-ceous Particles: An Investigative Review, Aerosol Sci. Technol., 40, 27–47, 2006.
Brooks, I. M.: Finding boundary layer top: application of a wavelet covariance transform to lidar backscatter profiles, J. Atmos. Ocean. Tech., 20, 1092–1105, 2003.
Campbell, J. R., Hlavka, D. L., Welton, E. J., Flynn, C. J., Turner, D. D., Spinhirne, J. D., Scott, V. S., and Hwang, I. H.: Full-time,
PM2.5and haze episode in the mid-Atlantic region, J. Air Waste
Mange., 53, 946–956, 2003.
Cheng, T. T., Han, Z. W., Zhang, R. J., Du, H. H., Jia, X., Wang, J. J., and Yao, J. Y.: Black carbon in a continental semi-arid area of Northeast China and its possible sources of fire emission, J. Geophys. Res., 115, D23204, doi:10.1029/2009JD013523, 2010. Cheng, Y. F., Wiedensohler, A., Eichler, H., Heintzenberg, J., Tesche, M., Ansmann, A., Wendisch, M., Su, H., Althausen, D., Herrmann, H., Gnauk, T., Bruggemann, E., Hu, M., and Zhang, Y. H.: Relative humidity dependence of aerosol optical proper-ties and direct radiative forcing in the surface boundary layer at Xinken in Pearl River Delta of China: An observation based nu-merical study, Atmos. Environ., 42, 6373–6397, 2008a. Cheng, Y. F., Wiedensohler, A., Eichler, H., Su, H., Gnauk, T.,
Brüggemann, E., Herrmann, H., Heintzenberg, J., Slanina, J., Tuch, T., Hu, M., and Zhang, Y. H.: Aerosol optical properties and related chemical apportionment at Xinken in Pearl River Delta of China, Atmos. Environ., 42, 6351–6372, 2008b. Chow, J. C., Chen, L. W. A., Watson, J. G., Lowenthal, D. H.,
Magliano, K. A., Turkiewicz, K., and Lehrman, D. E.: PM2.5
cheimcal composition and spatiotemporal variability during the California regional PM10/PM2.5air quality study (CRPAQS), J.
Geophys. Res., 111, D10S04, doi:10.1029/2005JD006457, 2006. Cohn, S. A. and Angevine, W. M.: Boundary layer height and en-trainment zone thickness measured by lidars and wind-profiling radars, J. Appl. Meteorol., 39, 1233–1247, 2000.
Draxler, R. R. and Rolph, G. D.: HYSPLIT (Hybrid Single-Particle Lagrangian Integrated Trajectory) Model access via NOAA ARL READY Website, avaialble at: http://www.arl.noaa.gov/ready/ hysplit4.htm (last access: 1 April 2015), NOAA Air Resources Laboratory, Silver Spring, MD, 2003.
Du, H. H., Kong, L. D., Cheng, T. T., Chen, J. M., Du, J. F., Li, L., Xia, X. G., Leng, C. P., and Huang, G. H.: Insights into sum-mertime haze pollution events over Shanghai based on online water-soluble ionic composition of aerosols, Atmos. Environ., 45, 5131–5137, 2011.
Fu, Q. Y., Zhuang, G. S., Wang, J., Xu, C., Huang, K., Li, J., Hou, B., Lu, T., and Streets, D. G.: Mechanism of formation of the heaviest pollution episode ever recorded in the Yangtze River Delta, China, Atmos. Environ., 42, 2023–2036, 2008.
Gao, J., Wang, J., Cheng, S., Xue, L.-K., Yan, H.-Z., Hou, L.-J., Jiang, Y.-Q., and Wang, W.-X.: Number concentration and size distributions of submicron particles in Jinan urban area: Charac-teristics in summer and winter, J. Environ. Sci., 19, 1466–1473, 2007.
River delta in China: formation and growth of particles under polluted conditions, Atmos. Environ., 43, 829–836, 2009. Hansen, A. D. A., Rosen, H., and Novakov, T.: The aethalometer-an
instrument for the real-time measurement of optical absorption by aerosol particles, Sci. Total Environ., 36, 191–196, 1984. He, K. B., Yang, F. M., Ma, Y. L., Zhang, Q., Yao, X. H., Chan, C.
K., Cadle, S., Tai Chan, T., and Mulaw, P.: The characteristics of PM2.5in Beijing, China, Atmos. Environ., 35, 4959–4970, 2001.
Hillamo, R., Allegrini, I., Sparapani, R., and Kerminen, V. M.: Mass size distributions and precursor gas concentrations of major in-organic ions in Antarctica aerosol, Int. J. Environ. Anal. Chem., 71, 357–369, 1998.
Huebert, B. J., Wang, M. X., and Lv, W. X.: Atmospheric nitrate, sulfate, ammonium and calcium concentrations in China, Tellus B, 4, 260–269, doi:10.1111/j.1600-0889.1988.tb00296.x, 1988. Huebert, B. J., Bates, T., Russell, P. B., Shi, G. Y., Kim, Y. J.,
Kawa-mura, K., Carmichael, G., and Nakajima, T.: An overview of ACE-Asia: Strategies for quantifying the relationships between Asian aerosols and their climatic impacts, J. Geophys. Res., 108, 1–20, 2003.
IPCC: Climate Change 2013: The Physical Science Basis. Contri-bution of Working Group I to the Fifth Assessment Report of the Intergovernmental Panel on Climate Change, edited by: Jous-saume, S. Penner, J., and Tangang, F., IPCC, Stockholm, 2013. Jansen, R. C., Chen, J., and Hu, Y.: The impact of
nonlo-cal ammonia on submicron particulate matter and visibility degradation in urban shanghai, Adv. Meteorol., 2014, 534675, doi:10.1155/2014/534675, 2014.
Kang, H. Q., Zhu, B., Su, J. F., Wang, H. L., Zhang, Q. C., and Wang, F.: Analysis of a long-lasting haze episode in Nanjing, China, Atmos. Res., 120–121, 78–87, 2013.
Kim, S. W., Yoon, S. C., Won, J. G., and Choi, S. C.: Ground-based remote sensing measurements of aerosol and ozone in an urban area: A case study of mixing height evolution and its effect on ground-level ozone concentrations, Atmos. Environ., 41, 7069– 7081, 2007.
Lance, S., Medina, J., Smith, J. N., and Nenes, A.: Mapping the operation of the DMT Continuous Flow CCN counter, Aerosol Sci. Tech., 40, 242–254, 2006.
Leng, C., Zhang, Q., Zhang, D., Xu, C., Cheng, T., Zhang, R., Tao, J., Chen, J., Zha, S., Zhang, Y., Li, X., Kong, L., and Gao, W.: Variations of cloud condensation nuclei (CCN) and aerosol activity during fog-haze episode: a case study from Shanghai, Atmos. Chem. Phys., 14, 12499–12512, doi:10.5194/acp-14-12499-2014, 2014a.
Leng, C., Zhang, Q., Tao, J., Zhang, H., Zhang, D., Xu, C., Li, X., Kong, L., Cheng, T., Zhang, R., Yang, X., Chen, J., Qiao, L., Lou, S., Wang, H., and Chen, C.: Impacts of new particle for-mation on aerosol cloud condensation nuclei (CCN) activity in Shanghai: case study, Atmos. Chem. Phys., 14, 11353–11365, doi:10.5194/acp-14-11353-2014, 2014b.
Leng, C. P., Cheng, T. T., Chen, J. M., Zhang, R. J., Tao, J., Huang, G. H., Zha, S. P., Zhang, M. G., Fang, W., Li, X., and Li, L.: Measurements of surface cloud condensation nuclei and aerosol activity in downtown Shanghai, Atmos. Environ., 69, 354–361, 2013.
Lee, D. O.: Trends in summer visibility in London and Southern England 1962–1979, Atmos. Environ., 17, 151–159, 1983.
Li, C., Lau, K. H., Mao, J., and Chu, D. A.: Retrieval, validation and application of the 1-km aerosol optical depth from MODIS measurements over Hong Kong, IEEE T. Geosci. Remote, 43, 2650–2658, 2005.
Liu, X. G., Li, J., Qu, Y., Han, T., Hou, L., Gu, J., Chen, C., Yang, Y., Liu, X., Yang, T., Zhang, Y., Tian, H., and Hu, M.: Formation and evolution mechanism of regional haze: a case study in the megacity Beijing, China, Atmos. Chem. Phys., 13, 4501–4514, doi:10.5194/acp-13-4501-2013, 2013.
Lohmann, U. and Feichter, J.: Global indirect aerosol effects: a re-view, Atmos. Chem. Phys., 5, 715–737, doi:10.5194/acp-5-715-2005, 2005.
Malm, W. C. and Day, D. E.: Estimates of aerosol species scattering characteristics as a function of relative humidity, Atmos. Envi-ron., 35, 2845–2860, 2001.
McNulty, R. P.: The effect of air pollutants on visibility in fog and haze at New York city, Atmos. Environ., 2, 625–628, 1968. Menut, L., Flamant, C., Pelon, J., and Flamant, P. H.: Urban
boundary-layer height determination from lidar measurements over the Paris area, Appl. Optics, 38, 945–954, 1999.
Ohta, S. and Okita, T.: A chemical characterization of atmospheric aerosol in Sapporo, Atmos. Environ., 24A, 815–822, 1990. Petters, M. D. and Kreidenweis, S. M.: A single parameter
repre-sentation of hygroscopic growth and cloud condensation nucleus activity, Atmos. Chem. Phys., 7, 1961–1971, doi:10.5194/acp-7-1961-2007, 2007.
Petters, M. D. and Kreidenweis, S. M.: A single parameter repre-sentation of hygroscopic growth and cloud condensation nucleus activity – Part 2: Including solubility, Atmos. Chem. Phys., 8, 6273–6279, doi:10.5194/acp-8-6273-2008, 2008.
Petzold, A., Kopp, C., and Niessner, R.: The dependence of the spe-cific attenuation cross-section on black carbon mass fraction and particle size, Atmos. Environ., 31, 661–672, 1997.
Poppe, D., Wallasch, M., and Zimmermann, J.: The dependence of the concentration of OH on its precursors under moderately pol-luted conditions: a model study, J. Atmos, Chem., 16, 61–78, 1993.
Ramanathan, V., Crutzen, P. J., Kiehl, J. T., and Rosenfeld, D.: Aerosols, climate, and the hydrological cycle, Science, 294, 2119–2124, 2001.
Ritesh, G., Christina, H., Menas, K., and Si-Chee, T.: Influences of winter haze on fog/low cloud over the Indo-Gangetic plains, J. Geophys. Res., 112, D05207, doi:10.1029/2005JD007036, 2007. Roberts, G. C. and Nenes, A.: A continuous-flow streamwise thermal-gradient CCN chamber for atmospheric measurements, Aerosol Sci. Tech., 39, 206–221, 2006.
Schichtel, B. A., Husar, R. B., Falke, S. R., and Wilson, W. E.: Haze trends over the United States, 1980–1995, Atmos. Environ., 35, 5205–5210, 2001.
Sun, Y. L., Zhuang, G. S., Wang, Y., Han, L. H., Guo, J. H., Dan, M., Zhang, W. J., Wang, Z. F., and Hao, Z. P.: The air-borne particulate pollution in Beijing-Concentration, composition, dis-tribution and sources, Atmos. Environ., 38, 5991–6004, 2004. Sun, Y. L., Zhuang, G. S., Tang, A. H., Wang, Y., and An, Z.
S.: Chemical characteristics of PM2.5 and PM10 in haze-fog
Tang, I. N.: Chemical and size effects of hygroscopic aerosols on light scattering coefficients, J. Geophys. Res., 101, 19245– 19250, 1996.
Tie, X. and Cao, J.: Aerosol pollution in China: Present and future impact on environment, Particuology, 7, 426–431, 2009. Tuch, T., Brand, P., Wichmann, H. E., and Heyder, J.: Variation of
particle number and mass concentration in various size ranges of ambient aerosols in Eastern Germany, Atmos. Environ., 31, 4193–4197, 1997.
Wang, Y., Zhuang, G. S., Zhang, X. Y., Huang, K., Xu, C., Tang, A. H., Chen, J. M., and An, Z. S.: The ion chemistry, seasonal cy-cle, and sources of PM2.5and TSP aerosol in Shanghai, Atmos.
Environ., 40, 2935–2952, 2006a.
Wang, Y., Zhuang, G. S., Sun, Y. L., and An, Z. S.: The variation of characteristics and formation mechanisms of aerosols in dust, haze, and clear days in Beijing, Atmos. Environ., 40, 6579–6591, 2006b.
Weingartner, E., Saathoff, H., Schnaiter, M., Streit, N., Bitnar, B., and Baltensperger, U.: Absorption of light by soot particles: de-termination of the absorption coefficient by means of aethalome-ters, J. Aerosol Sci., 34, 1445–1463, 2003.
Welton, E. J. and Campbell, J. R.: Micropulse lidar signals: Uncer-tainty analysis, J. Atmos. Ocean. Tech., 19, 2089–2094, 2002. Welton, E. J., Voss, K. J., Quinn, P. K., Flatau, P. J., Markowicz, K.,
Campbell, J. R., Spinhirne, J. D., Gordon, H. R., and Johnson, J. E.: Measurements of aerosol vertical profiles and optical proper-ties during INDOEX 1999 using micropulse lidars, J. Geophys. Res.-Atmos., 107, 8019, doi:10.1029/2000JD000038, 2002. Woo, K. S., Chen, D. R., Pui, D. Y. H., and McMurry, P. H.:
Mea-surements of Atlanta aerosol size distributions: observations of ultrafine particle events, Aerosol Sci. Tech., 34, 75–87, 2001. Wu, D., Tie, X., Li, C., Ying, Z., Lau, A. K.-H., Huang, J., Deng, X.,
and Bi, X.: An extremely low visibility event over the Guangzhou region: a case study, Atmos. Environ., 39, 6568–6577, 2005. Wu, D., Bi, X., Deng, X., Li, F., Tan, H., Liao, G., and Huang, J.:
Effects of atmospheric haze on the deterioration of visibility over the Pearl River Delta, Acta Meteorol. Sin., 64, 510–517, 2006. Xiao, F., Brajer, V., and Mead, R. W.: Blowing in the wind: the
impact of China’s Pearl River Delta on Hong Kong’s air quality, Sci. Total Environ., 367, 96–111, 2006.
analysis between urban and suburban sites at winter in Beijing, Particuology, 7, 52–60, 2009.
Yao, X. H., Chan, C. K., Fang, M., Cadle, S., Chan, T., Mulawa, P., He, K. B., Ye, B. M.: The water-soluble ionic composition of PM2.5in Shanghai and Beijing, China, Atmos. Environ., 36, 4223–4234, 2002.
Ye, X. N., Ma, Z., Zhang, J. C., Du, H. H., Chen, J. M., Chen, H., Yang, X., Gao, W., and Geng, F. H.: Important role of ammonia on haze formation in Shanghai, Environ. Res. Lett., 6, 024019, doi:10.1088/1748-9326/6/2/024019, 2011.
Yue, D. L., Hu, M., Zhang, R. J., Wu, Z. J., Su, H., Wang, Z. B., Peng, J. F., He, L. Y., Huang, X. F., Gong, Y. G., and Wiedensohler, A.: Potential contribution of new particle forma-tion to cloud condensaforma-tion nuclei in Beijing, Atmos. Environ., 45, 6070–6077, 2011.
Zhang, M., Wang, X. M., Chen, J. M., Cheng, T. T., Wang, T., Yang, X., Gong, Y. G., Geng, F. H., and Chen, C. H.: Physical char-acterization of aerosol particles during the Chinese New Year’s firework events, Atmos. Environ., 44, 5191–5198, 2010. Zhang, Q. C., Zhu, B., Su, J. F., and Wang, H. L.: Characteristcs of
aerosol water-soluble inorganic ions in three types air-pollution incidents of Nanjing City, Environ. Sci., 33, 1944–1951, 2012 (in Chinese).
Zhang, Y. W., Zhang, Q., Leng, C. P., Zhang, D., Cheng, T., Tao, J., Zhang, R., and He, Q.: Evolution of Aerosol Vertical Distri-bution During Particulate Pollution Events in Shanghai, J. Mete-orol. Res., 29, 385–399, 2015.
Zhao, P. S., Dong, F., He, D., Zhao, X. J., Zhang, X. L., Zhang, W. Z., Yao, Q., and Liu, H. Y.: Characteristics of concentrations and chemical compositions for PM2.5in the region of Beijing, Tianjin, and Hebei, China, Atmos. Chem. Phys., 13, 4631–4644, doi:10.5194/acp-13-4631-2013, 2013.