Transactions of the VŠB – Technical University of Ostrava, Mechanical Series No. 2, 2009, vol. LV,
article No. 1682
Kateřina BRODECKÁ*, Renáta PRZECZKOVÁ*, Jiří WOLGEMUTH*, Darja NOSKIEVIČOVÁ**, Miroslav MAHDAL***
SELECTED TOOLS AND METHODS FROM QUALITY MANAGEMENT FIELD
VYBRANÉ NÁSTROJE A METODY Z OBLASTI MANAGEMENTU KVALITY
Abstract
Following paper describes selected tools and methods from Quality management field and their practical applications on defined examples. Solved examples were elaborated in the form of electronic support. This in detail elaborated electronic support provides students opportunity to thoroughly practice specific issues, help them to prepare for exams and consequently will lead to education improvement. Especially students of combined study form will appreciate this support. The paper specifies project objectives, subjects that will be covered by mentioned support, target groups, structure and the way of elaboration of electronic exercise book in view. The emphasis is not only on manual solution of selected examples that may help students to understand the principles and relationships, but also on solving and results interpreting of selected examples using software support. Statistic software Statgraphics Plus v 5.0 is used while working support, because it is free to use for all students of the faculty. Exemplary example from the subject Basic Statistical Methods of Quality Management is also part of this paper.
Abstrakt
P íspěvek popisuje vybrané nástroje a metody z oblasti Managementu kvality a jejich praktické aplikace na definovaných p íkladech. ešené p íklady byly zpracovány ve formě elektronické podpory. Tato podrobně zpracovaná elektronická podpora, kterou ocení zejména studenti kombinované formy studia, poskytne studentům možnost více procvičit probíranou problematiku, p ipravit se na zkoušku a také p ispěje ke zkvalitnění výuky. P íspěvek dále specifikuje cíle projektu, oblasti, které budou uvedenou sbírkou pokryty, cílové skupiny, strukturu a způsob zpracování zamýšlené elektronické sbírky p íkladů. P i zpracování podpory je kladen důraz jak na ruční zpracování ešených úkolů, které mají studentům pomoci pochopit podstatu problému a souvislosti, tak na zpracování a interpretaci výsledků za použití softwarové podpory v podobě programu Statgraphics Plus v 5.0, který je studentům ve škole volně k dispozici. Součástí p íspěvku je také vzorový p íklad z p edmětu Základní statistické metody managementu jakosti.
* Ing., Department of Quality Management, Faculty of Metallurgy and Materials Engineering, VSB - Technical University of Ostrava, 17. listopadu 15, 708 33 Ostrava-Poruba, tel. (+420) 597 325 758, e-mail [email protected], [email protected], [email protected]
**
Doc. Ing., CSc., Department of Quality Management, Faculty of Metallurgy and Materials Engineering, VSB - Technical University of Ostrava, 17. listopadu 15, 708 33 Ostrava-Poruba, tel. (+420) 597 324 503, e-mail [email protected]
***
Ing., Department of Control Systems and Instrumentation, Faculty of Mechanical Engineering, VSB - Technical University of Ostrava, 17. listopadu 15, 708 33 Ostrava-Poruba, tel. (+420) 597 324 118, e-mail [email protected]
1 INTRODUCTION
The main aim of this electronic exercise book, which is focused on applied statistics, is the support of the subjects of Quality management field taught at the Faculty of metallurgy and materials engineering VSB – TU Ostrava. This exercise book will provide students the possibility to thoroughly practice specific issues, help them to prepare for exams and consequently will lead to education improvement. Especially students of combined study form who represent high percentage from total count of students of this field will appreciate this support, which will be elaborated in detail.
Mentioned exercise book covers the number of subjects of bachelor and master study. It is concerned following subjects: Basic statistical methods of quality management (bachelor study), Quality planning I (bachelor study), Special statistical methods (master study), Quality planning II (master study), Design of experiments (master study). Nowadays these subjects have the support in teaching materials and monographs of guarantees of each subject. These materials also contain exemplary samples but the number of samples is very narrow. This reality challenges a creation of complex study support, which in a harmony with a trend of computer literacy will be elaborated in electronic form and for students accessible on a webpage of Department of Quality management.
2 AREAS OF SOLVING
Each of the above mentioned subjects, which will be elaborated according to a content of the subject, will present a partial area (a chapter). The chapter will be divided into following parts:
• Solved examples without and with the help of the software what is for students freely accessible at the faculty and used during education.
• Non-solved examples with review questions.
• Answers to review question and results of non-solved examples.
• The list of resources.
• Complex case studies.
In solved and also in non-solved examples there are cross-links enabling to skip to necessary statistical tables, standards, graphs etc.
3 SAMPLE FROM EXERCISE BOOK – SUBJECT “BASIC STATISTICAL METHODS OF QUALITY MANAGEMENT”
For an illustration one sample from subject Basic statistical methods of quality management is shown. Firstly brief statement is mentioned, an algorithm of manual computation without the help of the software then follows. This computation is verified by the software, which is used during education and it is free for students. The algorithm in the software is described in detail.
3.1 Example for exercising
A significant characteristic of a power supply is output voltage [V]. This characteristic follows normal distribution with the mean 5 V and standard deviation 0,02 V. A specification is set 5 ± 0,05 V. What rate of power supplies will have the output voltage outside defined specification.
3.2 Solution
1. Brief statement from the example and drawing of a picture (figure 1)
μ = T=5 V USL = 5,05 V
LSL = 4,95 V σ = 0,02 V
2. Computation
Our aim is to determine what rate of power supplies will have output voltage outside defined specification. It means the rate of power supplies with the output voltage value less than lower specification 4,95 V and the value greater than upper specification 5,05 V. We use an equation of distributive function F(x)=P(X < x):
P(X<LSL)=F(LSL)=((LSL-μ)/σ)=((4,95-5)/0,02)=(-2,5)=1-(2,5)=1-0,993790=0,00621
P(X>USL)=1-F(USL)=1-((USL-μ)/σ)=1-((5,05-5)/0,02)=1-(2,5)=1-0,993790=0,00621
We can find the value (2,5) in tables for distributive function of standardized normal
distribution (cross-link to tables).
3. Conclusion
The rate of power supplies with output voltage values laying outside the specification is 0,01242.
3.3 Solution with the help of the software
4. Algorithm in the software Stathraphics Plus v 5.0
I. In the software menu choose an option Describe → next Distributions → Probability Distributions.
II. Choose Normal→ OK.
III. Click with right mouse button on the window Cumulative Distribution → choose an option Analysis Options.
IV. Set input values: Mean – 5, Std. Dev– 0,02 → OK.
V. Click with right mouse button on the window Cumulative Distribution → choose an option Pane Options.
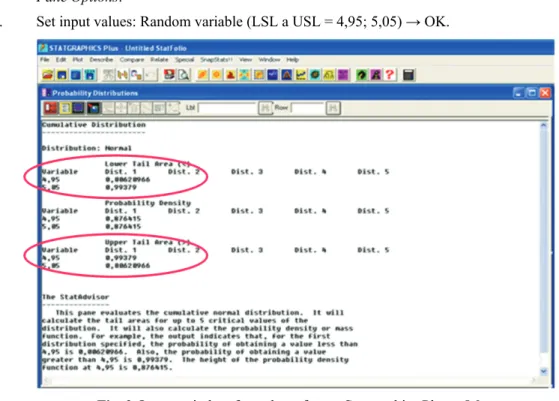
VI. Set input values: Random variable (LSL a USL = 4,95; 5,05) → OK.
Fig. 2 Output window from the software Statgraphics Plus v 5.0
We can see output window Cumulative Distribution from the software Statgraphics Plus v 5.0 (figure 2). For set values (4,95; 5,05) we have obtained values of probabilities that the random value X will be less, equal or greater than set values. If we would like to determine the probability, that X < 4,95, we are interested in the value Lower Tail Area (<) for value 4,95, which represents distributive function in the value 4,95. If we would like to determine the probability, that X > 5,05, we are interested in the value Upper Tail Area (>) for value 5,05, which represents supplement of distributive function in the value 5,05 to value “1”. With the help of the software we have obtained the same result.
3 CONCLUSIONS
This electronic exercise book will contribute to education improvement with its availability and elaboration manner at mentioned subjects of bachelor and master study at on-site studies and combined mode of study not only for Quality management field but also for other fields of the Faculty of metallurgy and materials engineering and other faculties, where the guarantee of the department insures the education of subjects from this field.
This paper was elaborated with the help of the project FRVS 1681/2009/G1 - Creating electronic example support for subjects focused on applied statistics taught in the frame of Quality management field.
REFERENCES
[1] MONTGOMERY, D. C. Introduction to Statistical Quality Control. 5st ed. USA: Wiley, New York, 2001. 743 pp. ISBN 0-471-31648-2.
[2] FABIAN, F. a kol.: Statistické metody řízení jakosti. ČSJ, Praha, 2007. 390 s. ISBN 978-80-02-01897-1.