Crop Breeding and Applied Biotechnology 9: 246-252, 2009 Brazilian Society of Plant Breeding. Printed in Brazil
Received 31 October 2008
Accepted 16 May 2009
Genetic divergence in snap bean based on agronomic
traits and resistance to bacterial wilt
Willian Krause1*, Rosana Rodrigues2, Leandro Simões Azeredo Gonçalves2, Francisco Valdevino Bezerra Neto2, and Nilton Rocha Leal2
ABSTRACT - The objectives of this research were to estimate the genetic divergence among genotypes of bush snap bean with based on morphoagronomic descriptors and evaluation of resistance to bacterial wilt; to determine the relative importance of the distinguishing traits of genotypes and to indicate potential parents to establish a snap bean breeding program for resistance to bacterial wilt. Two experiments were conducted, the first in the field and the second in a greenhouse, both with 15 genotypes in a randomized block design with three replications. Seven traits were studied in the field experiment: days to flowering; days to harvest; mean pod length; number of pods; number of pods per plant; total pod weight and number of seeds per pod. In the greenhouse, the reaction of bacterial wilt was assessed based on two variables, one based on a descriptive grade scale and the other based on the Area Under the Disease Progress Curve (AUDPC). For the evaluation of genotype resistance to bacterial wilt the isolate Feij – 2634 of Curtobacterium flaccumfaciens pv. flaccumfaciens was inoculated. The statistics of pseudo t2 indicated the formation of four groups by the UPGMA method, the same number of groups as indicated
by the use of canonical variables. The traits that contributed most to genetic divergence were days to harvest, pod length, pod diameter and AUDPC.
Key words: Curtobacterium flaccumfaciens pv. flaccumfaciens, Phaseolus vulgaris L., genetic resistance, germplasm, pseudo F and pseudo t2 statistics.
1 Departamento de Agronomia, Universidade do Estado de Mato Grosso (UNEMAT), Laboratório de Melhoramento de Plantas e Sementes, Rod MT 358,
78300-000, Tangará da Serra, MT, Brazil. *E-mail: [email protected]
2 Universidade Estadual do Norte Fluminense Darcy Ribeiro (UENF/CCTA/LMGV), Avenida Alberto Lamego, 2000, 28013-602, Campos dos Goytacazes,
RJ, Brazil
INTRODUCTION
Snap bean is affected by the same diseases and pests as common bean, since both crops belong to the same species, Phaseolus vulgaris L.. It is therefore possible to breed snap bean using common bean genotypes, e.g., snap bean breeders frequently use common bean as disease resistance source or other traits of interest in breeding programs. Among the main diseases of common bean, the bacterial wilt, caused by Curtobacterium flaccumfaciens pv. flaccumfaciens
(Cff), is considered one of the most harmful to common and snap bean. In Brazil, this disease was first reported in common bean in 1995 (Maringoni and Rosa 1997) and to date there are no studies on the identification of resistance sources in snap bean.
principal components, canonical variables and clustering methods. When the objective is to identify parents for crosses in a breeding programs, the mean Euclidean distance and especially Mahalanobis generalized distance are routinely used (Cruz et al. 2004). As also for other species, the techniques of multivariate analysis are being used in snap bean to obtain information on the genetic divergence among accessions. Abreu et al. (2004) estimated the genetic divergence in 25 snap bean accessions with indeterminate growth habit of the genebank of the Universidade Estadual do Norte Fluminense Darcy Ribeiro. Five of the accessions, with highest divergence, were crossed by Silva et al. (2004) who studied the combining ability and identified promising parents and combinations to start a breeding program for climbing snap bean.
The objectives of this study were: a) to estimate the genetic divergence in bush snap bean genotypes based on morpho-agronomic descriptors and on the evaluation of resistance to bacterial wilt, b) to determine the relative
importance of traits in the discrimination of the genotypes, and c) to indicate potential parents for a snap bean breeding program for resistance to bacterial wilt.
MATERIAL AND METHODS
Tw o e x p e r i m e n t s w e r e c o n d u c t e d i n t h e experimental area of the Universidade do Estado de Mato Grosso (UNEMAT), in Tangará da Serra, MT, along the highway MT 358, km 07 (lat 14° 39‘ S and long 57° 25‘ W; alt. 321 m asl).
In experiment 1, the treatments consisted of 15 snap bean genotypes (Table 1) grown in the field from November 2006 to January 2007, in a randomized block design with three replications. The experimental plots consisted of two 3.0 m rows, spaced 0.8 m between rows and 0.2 m between plants. Thirty plants per plot were evaluated, without using the border plants. The cultural treatments were performed according to crop– specific recommendations (Filgueira 2008).
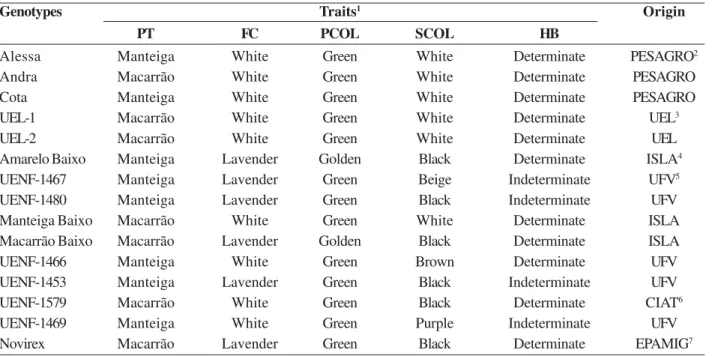
Genotypes Traits1 Origin
PT FC PCOL SCOL HB
Alessa Manteiga White Green White Determinate PESAGRO2
Andra Macarrão White Green White Determinate PESAGRO
Cota Manteiga White Green White Determinate PESAGRO
UEL-1 Macarrão White Green White Determinate UEL3
UEL-2 Macarrão White Green White Determinate UEL
Amarelo Baixo Manteiga Lavender Golden Black Determinate ISLA4 UENF-1467 Manteiga Lavender Green Beige Indeterminate UFV5 UENF-1480 Manteiga Lavender Green Black Indeterminate UFV Manteiga Baixo Macarrão White Green White Determinate ISLA Macarrão Baixo Macarrão Lavender Golden Black Determinate ISLA
UENF-1466 Manteiga White Green Brown Determinate UFV
UENF-1453 Manteiga Lavender Green Black Indeterminate UFV
UENF-1579 Macarrão White Green Black Determinate CIAT6
UENF-1469 Manteiga White Green Purple Indeterminate UFV
Novirex Macarrão Lavender Green Black Determinate EPAMIG7
1 PT = Pod type; FC = flower color; PCOL = pod color; SCOL = Seed color; HB = growth habit
2 Empresa de Pesquisa Agropecuária do Estado do Rio de Janeiro
3 Universidade Estadual de Londrina
4 Seed companies
5 Universidade Federal de Viçosa
6 Centro Internacional de Agricultura Tropical
7 Empresa de Pesquisa Agropecuária de Minas Gerais
At sowing 625 kg ha-1 of NPK (5-25-15) fertilizer
was applied in the furrow, according to soil analysis. Twenty five days after plant emergence 30 kg ha-1 of
NPK (5-25-15) was applied. The following morphoagronomic descriptors were studied: days to flowering (DF) - number of days from planting to flowering observed (50% of the plants of a plot had newly opened flowers); days until harvest (DPH) -number of days from planting to harvest (Harvest time was considered ideal when the pods reached maximum development, before becoming fibrous. In this way, the pods are harvested when still tender and the turgid tips can be bent and broken off without effort); mean pod length (PL) - in a sample of 50 pods per plot, expressed in cm; total number of pods (TNP ) - count of all pods per plot; number of pods per plant (NPP) - dividing the total number of pods per plot by the number of plants per plot; pod weight (PW) - total pod weight in grams; and number of seeds per pod (NSP) - ratio between the total number of seeds produced by the number of pods, considering a sample of 50 pods per plot.
The second experiment was conducted to evaluate the reaction of 15 bush snap bean genotypes to bacterial wilt. In this experiment the genotypes were grown in a greenhouse from January to March 2007. The plants were grown in pots containing a volume of approximately 2 liters of previously autoclaved soil. The experiment was conducted in a randomized block design with three replications. Each plot was represented by three plants, one per pot.
A portion of the stock bacterial culture of isolate Feij – 2634 of Cff (supplied by Professor Antonio Carlos Maringoni, UNESP / Jaboticabal), was transferred with a platinum spatula to Petri dishes containing solid Kado medium (Kado and Heskett 1970). The bacteria grew for 96 hours at 26 ºC before inoculation, as proposed by Maringoni (2002). The plant stems of all p l a n t s w e r e i n o c u l a t e d j u s t b e l o w t h e p a i r o f cotyledonary leaves eight days after emergence by inserting toothpicks, previously autoclaved and brought in contact with Cff colonies grown on the dishes, (Leite Junior and Behlau 2001).
The disease severity was evaluated by a descriptive grade scale described below: 1.0 = up to 10% of the plant wilted, 2.0 = 10% to 25%, 3.0 = 25% to 50%, 4.0 = 50% to 75% and 5.0 ≥ 75%. The disease severity was evaluated 12 times, every two days, beginning four days after inoculation. The grades were
used to calculate the area under the disease progress curve (AUDPC), according to Campbell and Madden (1990).
Data were submitted to analysis of variance, and the means compared by the grouping test of Scott-Knott (Scott and Knott 1974), at 5% probability. Mahalanobis generalized distance (D2) was used to quantify the
genetic divergence among genotypes. The following methods were used: hierarchical clustering UPGMA (Unweighted Pair-Group Method using an Arithmetic Mean) and the canonical variables. The cophenetic correlation coefficient (CCC) was calculated to test the efficiency of UPGMA clustering, and pseudo-F (Calinski and Harabasz 1974) and pseudo t2 statistics (Duda and
Hart 1973) to determine the optimal number of groups. The relative importance of variables was also analyzed by the method of Singh (1981). The statistical analyses were performed using the programs GENES (Cruz 2006) and SAS (SAS Institute 1988).
RESULTS AND DISCUSSION
yield-related traits, number of pods per plant and total n u m b e r o f p o d s , f o r m e d t w o g r o u p s a n d t h e genotypes UENF 1469 and UENF 1480 were present in the groups with the highest means for these variables. For total pod weight only one group was formed, based on the means.
The genotypes UEL 1, Amarelo Baixo and Novirex were the most promising in terms of Cff resistance, probably due to some resistance mechanism that resulted in a delay or prevention of Cff colonization. Common bean plants resistant to bacterial wilt were described by Schuster et al. (1964) who found that resistance is expressed as a smaller quantity of bacteria in the plant xylem. The other genotypes were highly susceptible to bacterial wilt (Table 2).
The AUDPC values ranged from 20.43 to 49.20, and the AUDPC values of the genotypes UEL 1, Amarelo Baixo, Novirex, Manteiga Baixo and Macarrão Baixo were the lowest, indicating some level of disease resistance (Table 2).
There are no studies on the performance of national snap bean genotypes challenged with this disease. Based on the results of this study, the genotypes identified as resistant, which are already
commercial cultivars, may be recommended to producers and included in breeding programs to obtain cultivars with resistance along with other traits of interest.
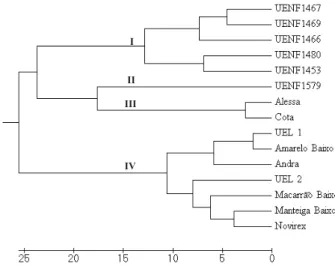
T h e c l u s t e r a n a l y s i s o f g e n o t y p e s b y t h e UPGMA method, based on Mahalanobis generalized distance (D2) as dissimilarity measure, had a CCC value
of 0. 89 , dem o ns tr a t i ng g oo d re l i a bi l i ty o f t he dendrogram. According to Sokal and Rohlf (1962), values above 0.8 indicate a good fit of the dissimilarity matrix and the dendrogram.
The optimal number of groups could not be determined by the pseudo F analysis, because the calculated F increased constantly with the number of groups formed, suggesting the absence of a ‘natural’ structure of data partition (Table 3). However, the analysis of the statistics of pseudo t2 showed that the
peak (56.6) was reached with the formation of four groups, indicating that this peak value is related to the lower probability of significance of the test, and would therefore indicate the interruption of the grouping process. Four groups are therefore considered ideal for UPGMA clustering analysis (Figure 1).
Genotypes Traits1
DF DPH PL NVP TNP TPW NSP GRADE AACPD
UENF 1480 41.67 a2 64.33 a 7.43 d 17.47 a 502.33 a 1269.33 a 5.37 b 3.89 a 43.05 a UENF 1453 45.00 a 63.67 a 8.08 d 10.99 b 281.08 b 769.67 a 6.80 a 4.33 a 43.88 a UENF 1469 43.00 a 61.00 b 9.22 c 16.94 a 463.99 a 1636.67 a 5.93 a 4.11 a 42.27 a UENF 1579 41.33 a 66.00 a 11.28 b 5.45 b 129.87 b 537.33 a 5.40 b 4.22 a 46.72 a UENF 1467 41.33 a 61.00 b 8.27 d 11.59 b 307.74 b 916.33 a 5.57 b 3.78 a 39.19 a Alessa 41.33 a 59.33 b 12.87 a 7.70 b 231.00 b 901.33 a 5.17 b 4.55 a 48.39 a Cota 40.00 a 59.33 b 13.00 a 8.03 b 232.33 b 1021.33 a 5.47 b 3.66 a 38.00 a UENF 1466 40.33 a 59.33 b 10.07 c 10.39 b 303.73 b 856.33 a 5.13 b 3.89 a 43.30 a UEL 2 37.00 b 58.00 b 11.87 b 3.99 b 73.91 b 284.33 a 4.30 b 4.33 a 43.83 a Andra 38.33 b 58.67 b 11.33 b 5.59 b 138.15 b 725.00 a 6.07 a 3.22 a 35.55 a UEL 1 37.00 b 58.00 b 10.48 b 9.21 b 276.20 b 918.67 a 5.10 b 1.50 b 19.83 b Amarelo Baixo 36.00 b 58.00 b 11.07 b 9.01 b 222.05 b 850.00 a 4.93 b 2.00 b 25.33 b Manteiga Baixo38.67 b 59.33 b 11.23 b 5.44 b 144.89 b 541.67 a 4.57 b 3.11 a 32.77 b Macarrão Baixo36.00 b 58.00 b 12.90 a 6.98 b 209.30 b 798.67 a 6.53 a 3.22 a 31.55 b Novirex 36.00 b 59.00 b 12.37 a 8.40 b 231.90 b 780.00 a 4.47 b 2.00 b 24.42 b
Mean 39.53 60.20 10.76 9.15 249.9 853.78 5.39 3.45 37.21
CV (%) 6.17 2.38 8.32 38.21 45.38 32.59 13.35 24.71 25.40
1 DF = days to flowering; DPH = days from planting to harvest; PL = mean pod length (cm); NVP = mean number of pods per plot; TNP = total
number of pods per plot; TPW = Total pod weight (g); NSP = mean number of seeds per pod; GRADE = reaction to bacterial wilt obtained in the 12th evaluation, 24 days after inoculation (DAI); AACPD = area under the disease-progress curve
2 Means followed by the same letter in the same column belong to the same group, according to the Scott-Knott test, at 5% probability
Considering the three yield components (number of pods per plant, total number of pods and pod weight) the genotypes UENF 1469 and UENF 1480 in group 1, were the most productive, could be used for crosses, mainly the cultivars with indeterminate growth habit. However, one must keep in mind that the difficulty of management and harvesting is greater for taller plants (Peixoto et al. 2002). Besides, these accessions have colored seeds, a qualitative trait which, in general, is not of interest on the snap bean consumer market, where white seeds are preferred, because they do not stain the pods with colored spots when cooked.
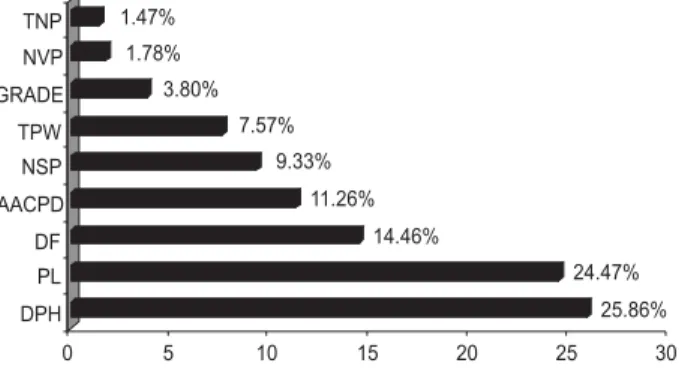
The first two canonical variables explained approximately 80% of the total variation (Figure 2). The results of grouping based on the canonical variables were similar to those of the UPGMA clustering technique, which also identified four genotype groups. The four main variables that contributed most to the divergence among the genotypes were days to harvest, pod length, days to flowering and AUDPC (25.9%, 24.5%, 14.5% and 11, 3%, respectively) (Figure 3). The AUDPC was an important trait of the genetic divergence among accessions, since all resistant genotypes were clustered in one group (group 4).
In a breeding program, the use of parents with high genetic diversity is recommended to increase the p r o b a b i l i t y o f f i n d i n g s u p e r i o r s e g r e g a t i n g populations in advanced generations and to expand the genetic base. However, the genotype choice should also be based on the performance per se. Thus,
divergent genotypes should be used for crosses, with different desirable agronomic traits that meet the goals of the program (Maluf and Ferreira 1983, Oliveira et al. 1999, Cruz et al. 2004).
The genotypes of groups 1, 2 and 3 (Figure 2) were susceptible to bacterial wilt (Table 2). The genotypes Alessa and Cota (group 3) have a determinate growth habit, white seeds, green pods of the butter type, which are traits of interest for the consumer market. Therefore, both can be used for crossing with wilt-resistant genotypes of group 4. In this group, only genotypes UEL 2 and Andra were susceptible to bacterial wilt (Table 2). Besides the resistance to this disease, the growth habit of the No. of groups Pseudo F Pseudo t2
14 164.0 .
13 120.0 .
12 83.0 .
11 68.0 .
10 47.0 12.4
9 42.1 3.1
8 41.6 3.3
7 40.4 2.9
6 39.8 8.8
5 26.0 7.9
4 24.0 56.6
3 26.5 12.7
2 17.5 17.5
1 . .
Table 3. Determination of the ideal number for genotype grouping by the statistics pseudo F and pseudo t2 based on the UPGMA
method
Figure 2. Graphic dispersion of 15 snap bean genotypes, in relation to the two first canonical variables, established by the linear combination of seven agronomical traits and reaction to bacterial wilt
genotypes UEL 1 and Manteiga Baixo is determinate and the pods are green and the seeds white, which are important traits for snap bean. Genotype Novirex has black seeds, but apart from disease resistance, it also has a determinate growth habit and green pods and is early (mean of 59 days until harvest) and was in the intermediate yield group. These genotypes may therefore be indicated for snap bean breeding for resistance to bacterial wilt and desirable agronomic traits, aside from quality traits of interest for the consumer market.
CONCLUSIONS
Of the four groups formed by cluster analysis, one joined all genotypes with some level of resistant to bacterial wilt, which were the genotypes UEL 1, Novirex, Amarelo Baixo, Manteiga Baixo and Macarrão Baixo.
The traits that contributed most to genetic divergence were days to harvest, pod length, days to flowering and area under the disease-progress curve.
The genotypes UEL1, Manteiga Baixo and Novirex had good agronomic performance with regard to yield-related traits and showed some level of resistance to bacterial wilt and can be indicated as parents in a snap bean breeding program for resistance to bacterial wilt.
ACKNOWLEDGEMENTS
The authors wish to thank professor Antônio Carlos Maringoni (UNESP, Jaboticabal) and Carlos Uesugi (Universidade de Brasília) for sending the bacterial isolates and professsor Nei Peixoto (UEG) an d th e res ea r c h e r Al is so n F e rn a n do C h io r a to (IAC) for providing common and snap bean seeds.
Estimativa da divergência genética em feijão-de-vagem
com base em características agronômicas e de
resistência à murcha-de-curtobacterium
RESUMO - Os objetivos desta pesquisa foram estimar a divergência genética entre genótipos de feijão-de-vagem de hábito determinado com base em descritores morfoagronômicos e na avaliação da resistência à murcha-de-curtobacterium; determinar a importância relativa das características estudadas na distinção dos genótipos e indicar potenciais genitores para estabelecer um programa de melhoramento do feijão-de-vagem para resistência à murcha-de-curtobacterium. Dois experimentos foram conduzidos, o primeiro em campo e o segundo em casa de vegetação com 15 genótipos, ambos no delineamento de blocos ao acaso, com três repetições. No experimento de campo foram estudadas sete características: dias para o florescimento; dias para a colheita; comprimento médio da vagem; número total de vagens; número de vagens por planta; peso total de vagem, e número de sementes por vagem. Em casa de vegetação, a reação à murcha-de-curtobacterium foi avaliada em função de duas variáveis, uma delas baseada em uma chave descritiva de notas e a outra baseada na área abaixo da curva de progresso da doença (AACPD). Para a avaliação da resistência dos genótipos à murcha-de-curtobacterium inoculou-se o isolado Feij – 2634 de Curtobacterium flaccumfaciens pv. flaccumfaciens. A estatística do pseudo t2 indicou a formação de
quatro grupos no método UPGMA, mesmo número de grupos indicado com o uso das variáveis canônicas. As características que mais contribuíram para a divergência genética foram dias para a colheita, comprimento da vagem, diâmetro da vagem e a área abaixo da curva de progresso da doença.
Palavras-chave:Curtobacterium flaccumfaciens pv. flaccumfaciens, Phaseolus vulgaris L., resistência genética, estatística pseudo F e pseudo t2.
REFERENCES
Abreu FB, Leal NR, Rodrigues R, Amaral Júnior AT and Silva DJH (2004) Divergência genética entre acessos de feijão-de-v a g e m d e h á b i t o d e c r e s c i m e n t o i n d e t e r m i n a d o . Horticultura Brasileira 3: 547-552.
Calinski T and Harabasz J (1974) A dendrite method for cluster analysis. Communications in Statistics 3: 1-27.
Campbell CL and Madden LV (1990) Introduction to plant disease epidemiology. John Wiley, New York, 532p.
Cruz CD (2006) Programa genes: análise multivariada e simulação. Editora UFV, Viçosa, 175p.
C r u z C D , R e g a z z i A J a n d C a r n e i r o P C S ( 2 0 0 4 ) Modelos b i o m é t r i c o s a p l i c a d o s a o m e l h o r a m e n t o g e n é t i c o. Editora UFV, v.1, Viçosa, 480p.
Duda RO and Hart PE (1973) Pattern classification and scene analysis. John Wiley, New York, p. 189-225.
F i l g u e i r a FA R ( 2 0 0 8 ) N o v o m a n u a l d e o l e r i c u l t u r a : a g r o t e c n o l o g i a m o d e r n a n a p r o d u ç ã o e comercialização de hortaliças. 3. ed., Editora UFV, Viçosa, 4 2 1 p .
Kado CI and Heskett MG (1970) Selective media for isolation of Agrobacterium, Corynebacterium, Erwinia, Pseudomonas and Xanthomonas. Phytophathology 6: 969-976.
Leite Júnior RP and Behlau F (2001) Caracterização da murcha d o f e i j o e i r o n o P a r a n á . I n : A n a i s d a re u n i ã o S u l -Brasileira de feijão. IAPAR, Londrina, p. 50-54.
Maluf WR and Ferreira PE (1983) Análise multivariada da divergência genética em feijão-de-vagem (Phaseolus vulgaris L.). Horticultura Brasileira 2: 31-34.
Maringoni AC (2002) Comportamento de cultivares de feijoeiro c o m u m à m u r c h a - d e - c u r t o b a c t e r i u m . F i t o p a t o l o g i a Brasileira 2: 157-162.
M a r i n g o n i A C a n d R o s a E F ( 1 9 9 7 ) O c o r r ê n c i a d e C u r t o b a c t e r i u m f l a c c u m f a c i e n s p v. flac cum fac ie ns em
f e i j o e i r o n o E s t a d o d e S ã o P a u l o . S u m m a Phytopathologica 2: 160-162.
Oliveira VR, Casali VWD, Cruz CD, Pereira PRG and Braccini AL (1999) Avaliação da diversidade genética em pimentão através de análise multivariada. Horticultura Brasileira 1: 19-24.
Peixoto N, Braz LT, Banzatto DA, Moraes EA and Moreira FM (2002) Características agronômicas, produtividade, qualidade d e v a g e n s e d i v e r g ê n c i a g e n é t i c a e m f e i j ã o - v a g e m d e crescimento indeterminado. Horticultura Brasileira 3: 447-451.
Pinto CMF, Vieira RF, Vieira C and Caldas MT (2001) Idade de c o l h e i t a d o f e i j ã o - v a g e m a n ã o c u l t i v a r N o v i r e x . Horticultura Brasileira 1: 163-167.
SAS Institute (1988) SAS/STAT: user’s guide. SAS Institute, Cary, 1028p.
Schuster ML, Coyne DP and Singh K (1964) Population trends and movement of Corynebacterium flaccumfaciens var. a u r a n t i a c u m i n t o l e r a n t a n d s u s c e p t i b l e b e a n s . Plant Disease Report 48: 823-827.
Scott AJ and Knott M (1974) A cluster analysis method for grouping means in the analysis of variance. Biometrics 30: 507-512.
Silva MP, Amaral Júnior AT, Rodrigues R, Daher RF, Leal NR and Schuelter AR (2004) Análise dialélica da capacidade combinatória em feijão de vagem. Horticultura Brasileira 2: 277-280.
Singh D (1981) The relative importance of characters affecting genetic divergence. The Indian Journal of Genetic and Plant Breeding 41: 237-245.