http://www.uem.br/acta ISSN printed: 1679-9275 ISSN on-line: 1807-8621
Doi: 10.4025/actasciagron.v38i1.25577
AFLP analysis of genetic diversity in determinate and indeterminate
snap bean accessions
Felipe Aranha de Andrade1, Leandro Simões Azeredo Gonçalves1*, Édison Miglioranza1, Claudete de Fátima Ruas2, Paulo Mauricio Ruas2 and Lúcia Sadayo Assari Takahashi1
1
Departamento de Agronomia, Universidade Estadual de Londrina, Rodovia Celso Garcia Cid, Km 380, 86051-900, Londrina, Paraná, Brazil.
2
Departamento de Biologia, Universidade Estadual de Londrina, Londrina, Paraná, Brazil. *Author for correspondence. E-mail: [email protected]
ABSTRACT. The present study aimed to estimate and characterize the genetic divergence between determinate and indeterminate snap bean accessions from the Universidade Estadual de Londrina (UEL) germplasm bank based on amplified fragment length polymorphism (AFLP) markers. A total of 40 and 32 accessions with determinate and indeterminate growth habits, respectively, were characterized for this purpose. Seven combinations of primers corresponding to EcoR1 and Mse1 were tested for the AFLP analysis, and the combinations E-AAG/M-CTC, E-ACT/M-CTT and E-ACC/M-CTT were selected. These selective AFLP combinations revealed 485 informative loci in total, and the combination E-ACC/M-CTT detected the greatest number of informative loci (49%). The analysis of dissimilarity frequency distribution showed that the distribution was uniform, ranging from 0.1285 to 0.7310 with a mean of 0.4801, and the accessions with indeterminate growth habits exhibited greater variability than the accessions with determinate growth habits. The clustering UPGMA, PCoA and Bayesian analyses showed the formation of two large clusters, wherein there is a possible association between snap bean growth habit and gene pool. The determinate accessions may be more closely associated with the Andean gene pool, while the indeterminate ones may be associated with the Mesoamerican gene pool. The Bayesian analysis showed accessions intermediate to both groups, suggesting introgression between the Andean and Mesoamerican gene pools.
Keywords: Phaseolus vulgaris L., molecular markers, amplified fragment length polymorphism, gene bank.
Análise de AFLP na diversidade genética em acessos de feijão-de-vagem de hábito
determinado e indeterminado
RESUMO. O presente trabalho teve como objetivo estimar e caracterizar a divergência genética entre acessos de feijão-de-vagem determinado e indeterminado do banco de germoplasma da UEL com base em marcadores AFLP. Para tanto foram caracterizados 40 e 32 acessos de hábito determinado e indeterminado, respectivamente. Para análise do AFLP, sete combinações de primers EcoR1 e Mse1 foram testadas, sendo selecionadas as combinações E-AAG/M-CTC, E-ACT/M-CTT, E-ACC/M-CTT. Essas combinações de iniciador/enzima revelaram um total de 485 locos informativos, sendo a combinação E-ACC/M-CTT a que detectou o maior número de locos informativos (49%). A análise da distribuição das frequências da dissimilaridade revelou que a distribuição foi uniforme variando de 0.1285 a 0.7310 com média de 0.4801, com os acessos de hábito indeterminado apresentando uma maior variabilidade quando comparado com os de hábito determinado. Pelas análises de agrupamento UPGMA, PCoA e Bayesiana verificou-se a formação de dois grandes grupos, para os quais sugere-se uma possível predominância do hábito de crescimento do feijão-de-vagem quanto ao pool gênico. Os determinados podem estar mais associados ao poolgênico Andino, enquanto o indeterminado ao pool gênico Mesoamericano. Pela análise Bayesiana, verificou-se acessos intermediário aos dois grupos sugerindo-se uma introgressão entre os pool gênicos Andino e Mesoamericano.
Palavras-chave: Phaseolus vulgaris L., marcadores moleculares, polimorfismo no comprimento de fragmentos amplificados, banco de germoplasma.
Introduction
The snap bean (Phaseolus vulgaris L.) is considered one of the most important vegetable crops worldwide, and it is relatively rich in vitamins, minerals and antioxidants (Abu-Reidah, Arráez-Román, Lozano-Sánchez, Segura-Carretero,
In Brazil, data on snap bean production and market relevance are scarce, given the lack of reliable statistics and systematized information. However, this crop has been widely grown by small farmers, and it is considered a good source of income and an alternative by which to diversify production. It is increasingly being used in crop rotation or in the off-season of other vegetable crops, including bell peppers and tomatoes (Francelino, Gravina, Manhães, Cardoso, & Araújo, 2011; Santos et al., 2012).
The snap bean is classified according to three categories: pod type, pod color and growth habit. Pod type may be classified as flat-podded or round-podded. Four basic colors are included in the pod color category (dark green, light green, yellow and purple). Snap bean plants are classified in regards to growth habit as determinate, when the terminal portion of the stem ends in an inflorescence, and indeterminate, when the terminal portion of the stem ends in a vegetative meristem, enabling continued plant growth (Kwak, Toro, Debouck, & Gepts, 2012).
Two phenotypic loci have been reported to control the snap bean growth habit. The locus fin was the first identified in 1915 and subsequently mapped to chromosome Pv01, and the second locus, without identification, was mapped to chromosome Pv07 (Kolkman & Kelly, 2003; Koinange, Singh, & Gepts, 1996). The locus fin accounts for determinacy in most varieties with determinate growth habit, which originate from the Andean gene pool, whereas the second locus accounts for determinacy in some Michigan navy bean cultivars, which resulted from an artificial mutagenesis program (Kelly, 2001). Kwak, Toro, Debouck and Gepts (2012) hypothesize that the determinate growth habit is a domestication phenotype, which aims to decrease the plant biomass and optimize the allocation of photosynthates between vegetative and reproductive growth.
Londrina State University (Universidade Estadual de Londrina, UEL) maintains a snap bean germplasm bank, and most accessions were provided by the International Center for Tropical Agriculture (Ciat), including local varieties, traditional cultivars and lines derived from the Ciat breeding program. Accordingly, the characterization of these accessions is highly important because it may help to identify possible duplicates and provide data to facilitate the organization of accessions in the germplasm bank, thus facilitating their use in breeding programs (Gonçalves et al., 2008a; Moulin, Rodrigues, Gonçalves, Sudré, & Pereira, 2012; Sudré et al., 2010).
The germplasm characterization may be performed considering agronomic, morphological, biochemical, physiological, and molecular characteristics, among others (Gonçalves, Rodrigues, Amaral Júnior, Karasawa, & Sudré, 2008b). However, molecular markers have advantages over the other characteristics because they indicate genetic differences at a higher level of detail and without interference from the environment. Their use also quickly determines the diversity present (Leal et al., 2010).
There are different types of molecular markers, distinguished by their potential to detect differences between individuals, cost, ease of use and the consistency and repeatability of results (Gupta, Rustgi, & Mir, 2013). Amplified fragment length polymorphism (AFLP) markers (Vos et al., 1995) stand out among the types of markers available as a powerful tool by which to characterize germplasm, given their high reproducibility and robustness together with the fact that they generate few artifacts and allow extensive genome coverage (Meudt & Clarke, 2007; Santos, Oliveira, Rodrigues, Ribeiro, & Silva, 2011).
Accordingly, the present study aimed to estimate and characterize the genetic divergence among 72 (determinate and indeterminate) snap bean accessions of the UEL germplasm bank based on AFLP markers.
Material and methods
A total of 72 snap bean accessions belonging to the germplasm bank of the Londrina State University (Universidade Estadual de Londrina - Banco de Germoplasma de Feijão-de-Vagem, UEL – BGFV), including 40 and 32 accessions with determinate and indeterminate growth habits, respectively, were used.
Total DNA was extracted from young leaves of the analyzed accessions using the protocol by Doyle and Doyle (1987). After DNA extraction, the DNA integrity was assessed on a 1.0% agarose gel, which was stained in ethidium bromide solution
(0.5 μg mL-1) and visualized using a gel imaging
system. The DNA content of the samples was quantified using a NanoDrop 2000/2000c spectrophotometer (Thermo Scientific).
AFLP analysis was performed according to Vos et al. (1995), with some modifications. Approximately 700 ng of DNA from each accession
was double-digested by the enzymes EcoR1 and
Mse1, using 5 U of each, for 18 hours at 37°C. The generated fragments were ligated to the adaptors, 0.5
DNA ligase at 1 U, buffer for T4 DNA ligase at
1 X, 0.05 M sodium chloride (NaCl), 50 ng μL-1
bovine serum albumin (BSA) and 0.25 mM Dithiothreitol (DTT), in a final volume of 10 μL. The reaction mixture was incubated at 37°C for 3 hours, 17°C for 30 min. and 70°C for 10 min. a thermocycler and then diluted (1:1) with ultrapure water. Subsequently, the fragments were amplified using a primer pair with one selective base.
The pre-selective amplification was performed in
a final volume of 10 μL, using 3.5 μL of the GoTaq®
Green Master Mix kit (Promega), 4.75 μM
pre-selective primer and 3.0 μL from the diluted restriction/ligation reaction. The thermocycler program consisted of 2 minutes at 72ºC, followed by 20 1-s cycles at 94ºC, 30 s at 56ºC and 2 min. at 72ºC and, lastly, 30 min. at 60ºC. The selective
amplification reactions consisted of 0.54 μl of each
selective primer, 5μM MseI and 1μM EcoRI, 3.5 μl
GoTaq® Green Master Mix (Promega) and 3 μL of
the pre-amplified DNA diluted (1:8) with ultrapure water, in a final volume of 10 μL. Seven combinations of primers corresponding to EcoR1
and Mse1 (E-AAG/M-CTC, E-ACT/M-CTT,
E-ACC/M-CTT, E-ACG/M-CTT, E-ACA/M-CTT, E-AAC/M-CTT, E-ACT/M-CTA), with three selective nucleotides, were tested for the selective amplification. The reactions with selective nucleotides were performed in a thermocycler as follows: initial cycle of 2 min. at 94ºC; 30 s at 65ºC and 2 min. at 72ºC; 8 1-s cycles at 94ºC, 30 s at 64ºC and 2 min. at 72ºC, decreasing 1ºC at each cycle; 23 1-s cycles at 94ºC, 30 s at 56ºC and 2 min. at 72ºC and, finally, 30 min. at 60ºC. Three of the seven tested combinations were selected (E-AAG/M-CTC, E-ACT/M-CTT, E-ACC/M-CTT), wherein the primers for EcoR1 were labeled with fluorophores: blue (FAM), green (HEX) and yellow (NED), respectively.
The products of selective reactions were added to 0.2 μL of ROX-500 size standard (Applied Biosystems) and 8.8 μL of highly deionized (Hi-Di) formamide. Then, the products were denatured and subjected to capillary electrophoresis using the automated system 3500 xL (Applied Biosystems). All amplifications were performed in a thermocycler GeneAmp PCR System 9700 (Applied Biosystems).
For the AFLP analysis, the data were interpreted according to the presence and absence of bands, generating a binary matrix. The Jaccard similarity coefficient complement was used to estimate the genetic distances between the (determinate and indeterminate) snap bean accessions. The simplified representation of genetic distances between accessions was obtained using the hierarchical
clustering method Unweighted Pair-Cluster Method Using Artihmetic Average (UPGMA) and principal coordinates analysis (PCoA). Pseudo F
(Calinski & Harabasz, 1974), Pseudo T2 (Duda &
Hart, 1973)and Cubic Clustering Criterion (Sarle,
1983) statistics were used to assess the optimal number of clusters by UPGMA clustering, while the clustering reliability was assessed by Bootstrap analysis with 1000 replicates. The distance matrix estimate and PCoA and UPGMA clusters were performed using the software R (http://www.r-project.org).
The software STRUCTURE version 2.3.3 (Hubisz, Falush, Stephens, & Pritchard, 2009) was used to identify the number of similar accessions clusters (K). The analysis of the number of clusters was performed using the admixture model with a burn-in and run lengths of 10,000 and 100,000 interactions, respectively. The number of clusters was determined following the guidelines of Pritchard and Wen (2004) and Evano, Regnaut and Goudet (2005), in the online software Structure Harvester (Earl & Vonholdt, 2012).
Results and discussion
The three combinations of AFLP selective primers used (AAG/M-CTC, ACT/M-CTT, E-ACC/M-CTT) revealed a total of 485 loci. The combination E-ACC/M-CTT detected the greatest number of informative loci (237), while the combinations E-AAG/M-CTC and E-ACT/M-CTT detected 105 and 143 informative loci, respectively. Maciel, Echeverrigaray, Gerald and Grazziotin (2003) and Blair, Chaves, Tofiño, Claderón and Palacio (2010) also noted more polymorphisms for the combination E-ACC/M-CTT when evaluating the genetic variation and the relationship between common bean and snap bean accessions using AFLP markers.
Figure 1). Both accession groups (determinate and indeterminate) were mostly derived from the CIAT germplasm bank.
Figure 1. Box plot of the dissimilarity based on AFLP markers between 72 snap bean accessions (determinate and indeterminate).
UPGMA hierarchical clustering analysis showed the formation of two large clusters. The first cluster was exclusively formed by accessions of determinate growth habit, while the second cluster consisted of accessions with indeterminate growth habit and six accessions of determinate growth habit (Figure 2).
Figure 2. UPGMA dendrogram of the genetic relationships among 72 snap bean (determinate and indeterminate) accessions based on AFLP. Bootstrap values are given at the corresponding node for each cluster.
This result was corroborated by the Bayesian statistics, which showed that the highest value of ΔK was reached upon the formation of two large clusters. Cluster I (in red) was formed by most accessions with indeterminate growth habits, while
cluster II (in green) was formed by accessions with determinate growth habits. In addition, some accessions showed an intermediate classification pattern, as shown in the bar plot (Figure 3).
Figure 3. Bar plot structure based on three AFLP combinations of primer/enzyme (E-AAG/M-CTC, E-ACT/M-CTT, and E-ACC/M-CTT) for the 72 snap bean accessions (determinate and indeterminate), showing the distributions of both groups.
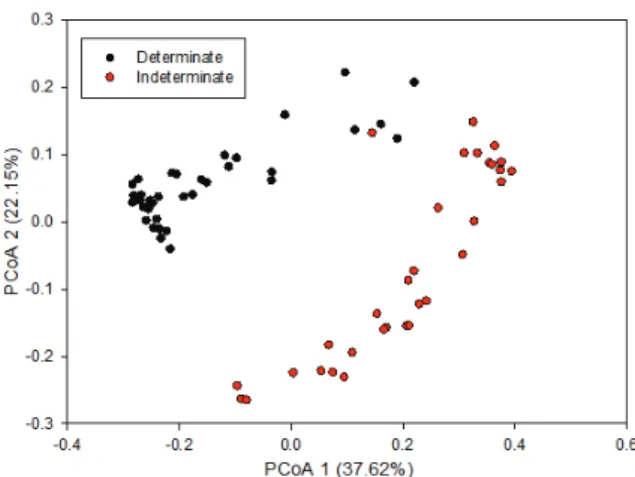
The PCoA also showed the separation of both groups of snap bean (Figure 4). The compact growth habit is related to legume domestication, which manifests as a number of characteristics, including reduced branching, shorter internodes, smaller number of nodes and reduced twining. In some cases, the terminal portion of the stem ends in an inflorescence, according to Smartt (1990). All wild species of Phaseolus are indeterminate, as are some domesticated types, while all determinate accessions are domesticated. Kwak et al. (2012) noted that
PvTFL1y (a gene associated with determinacy)
originated in both Andean and Mesoamerican gene pools when studying the multiple origins of the determinate growth habit in common bean plants.
Figure 4. PCoA of 72 snap bean (determinate and indeterminate) accessions based on AFLP.
Similarly to the other types of beans, the primary center of diversity for snap bean is believed to be the Americas. However, this crop has a wide distribution and is quite diverse in several regions of the world, especially Europe and Asia (Myers &
G B -S B -76( I) GB -S B-8 3 (I ) GB -SB -78 (I) GB -SB -77 (I) GB -SB -87 (I) GB -SB -89 (I) GB -SB -73 (I) GB -SB -74( I)
GB-S B-8
2(I)
GB-S B-72(
I)
GB-SB -88(
I)
GB-SB -84(I)
GB-S B-21 (D) GB-SB -06(D ) GB-SB -24(D) GB- SB-37(D)
GB-SB-51(I)
GB-SB-v17(D) GB-SB-09(D) GB-SB-56(I) GB-SB-66(I) GB-SB-52(I) GB-SB -65(I) GB-S B-67(I) GB-SB-62 (I) GB-SB -57(I) GB -SB-64 (I) G B-S B-8 1(I) G B-SB -5 4(I) GB -SB -71( I) GB -SB -6 1(I) GB -SB -63 (I) G B -S B -69 (I) GB -SB -85 (I) G B -SB -6 0 (I) G B -SB -5 3 (I) G B -S B -5 8 (I) G B -S B -59 (I) G B -S B -35 (D ) G B-S B-4 3 (D) GB -SB -11 (D) GB -SB -16( D) GB -SB -03 (D) GB -SB -18 (D) GB -SB -19 (D) GB -SB -38( D) GB -SB -12( D) G B-SB-1
3(D )
GB-SB
-14( D) GB-S B-05 (D) GB-S B-31 (D) GB-SB -32(D)
GB-SB-07 (D)
GB-SB-28(D ) GB-SB-29(D) GB-SB-45(D) GB-SB-01(D) GB-SB-02(D) GB-SB-04(D) GB-SB-25(D) GB-SB-20(D) GB-SB-08 (D) GB-SB -22(D) GB -SB-23 (D) G B-S B-1 0(D) G B-S B-3 0(D) GB -SB -3 9(D) GB -SB -4
0(D) GB
-SB -4
Baggett, 1999). According to Blair et al. (2010), there is a misconception among several authors that all or most snap bean genotypes were derived from the Andean gene pool because the initial analysis showed that the determinate snap bean usually shows patterns of Andean-type phaseolin proteins (‘T’, ‘C’, or ‘H’; (Brown, Mcferson, Bliss, & Hall, 1982; Gepts, Osborn, Rashka, & Bliss, 1986). However, Blair et al. (2010) noted that the accessions belonged to both gene pools, with a predominance of the Mesoamerican gene pool over the Andean, when evaluating the genetic diversity of 120 accessions of indeterminate snap bean using AFLP molecular markers and microsatellites.
Accordingly, a possible predominance of snap bean growth habit in relation to the gene pool is suggested based on the results of the present study, wherein the determinate accessions may be more closely associated with the Andean gene pool, while the indeterminate ones may be more closely associated with the Mesoamerican gene pool. That fact is corroborated by the fact that some indeterminate snap bean accessions used in the present study were derived from the Blue Lake (GB-SB-51, GB-SB-52, GB-SB-53, GB-SB-54, GB-SB-60, GB-SB-73 and GB-SB-87), Osu 4852 (GB-SB-61 and GB-SB-63), Lago Azul (GB-SB-64), G15300-Zambia (GB-SB-69) and G15801-Zambia (GB-SB-77) varieties, which were classified as Mesoamerican by Blair et al. (2010).
Regarding the diversity within the snap bean
accession groups (growth habits), Pseudo T2 and CCC
statistics showed the formation of six subclusters of indeterminate growth habit accessions in the UPGMA clustering, while five subclusters were formed in the clustering of determinate accessions. The pseudo F parameter precluded an assessment of the optimal number of clusters because the calculated F increased with the number of clusters formed, indicating the lack of a ‘natural’ data partition.
In the indeterminate accessions, subcluster I consisted of 12 accessions, with all accessions clustered with the same pattern as suggested by the Bayesian analysis and represented by the bar plot. Single accessions were allocated to subclusters II, III and V (GB-SB-51(I), GB-SB-56(I) and GB-SB-67(I), respectively), while subclusters IV and VI were formed by three and 14 accessions, respectively. The accessions from those subclusters (II, III, IV, V and VI) showed a two-color pattern (red and green) in the bar plot (Figure 3), indicating introgression in the gene pool. This introgression is most evident in accessions GB-SB-52(I), GB-SB-66(I), GB-SB-SB65(I), GB-SB-57(I) and GB-SB-62(I), wherein an intermediate pattern of the gene pools is noted.
In the determinate growth habit accessions, subclusters I, II, III, IV and V consisted of 6, 2, 10, 3 and 19 accessions, respectively. Subcluster I (GB-SB-21(D), GB-SB-06(D), GB-SB-24(D), GB-SB-37(D), GB-SB-17(D) and GB-SB-09(D)) was the most divergent from the other clusters, as those accessions showed a broad effect of the gene pool, as shown in the bar plot. Accessions GB-SB-43(D) and GB-SB-35D(D) from subcluster II and accessions GB-SB-05(D) from subcluster III also showed that same effect. The other accessions showed a single color pattern in the bar plot. The introgression of Andean and Mesoamerican gene pools was also shown in other studies (Blair et al., 2010; Cunha, Hintz, & Griffiths, 2004; Metais, Hamon, Jalouzot, & Peltier, 2002). According to Blair et al. (2010), the introgression between the gene pools in snap beans may be more likely than in dry beans because seed size and color constraints are different in snap beans than in dry beans.
Conclusion
The results showed a good level of genetic variability in the germplasm bank of snap beans of Universidade Estadual de Londrina. This on formation will be useful in future breeding programs. UPGMA, PCoA and Bayesian analysis showed the formation of two large groups, suggesting a possible relationship between the bean growth habitat and the gene pool.
References
Abu-Reidah, I. M., Arráez-Román, D., Lozano-Sánchez, J., Segura-Carretero, A., & Fernández-Gutiérrez, A. (2013). Phytochemical characterization of green beans (Phaseolus vulgaris L.) by using high-performance liquid chromatography coupled with time-of-flight mass spectrometry. Phytochemical Analysis, 24(2), 105-116. Blair, M. W., Chaves, A., Tofiño, A., Claderón, J. F., &
Palacio, J. D. (2010). Extensive diversity and inter-genepool introgression in a world-wide collection of indeterminate snap bean accessions. Theoretical and Applied Genetics, 120(7), 1381-1391.
Brown, J. W. S., Mcferson, J. R., Bliss, F. A., & Hall, T. C. (1982). Genetic divergence among commercial classes of Phaseolus vulgaris in relation to phaseolin pattern.
HortScience, 17(5), 752-754.
Calinski, T., & Harabasz, J. (1974). A dendrite method for cluster analysis. Communications in Statistics, 3(1), 1-27. Cunha, C., Hintz, T., & Griffiths, P. (2004). Genetic
diversity of snap bean cultivars determined using randomly amplified polymorphic DNA (RAPD) markers. HortScience, 39(3), 481-484.
Duda, R. O., & Hart, P. E. (1973). Pattern classification ans scene analysis. New York, NY: John Wiley e Sons. Earl, D. A., & Vonholdt, B. M. (2012). Structure
Harvester: a website and program for visualizing Structure output and implementing the Evanno method. Conservation Genetics Resources, 4(2), 359-361. Evano, G., Regnaut, S., & Goudet, J. (2005). Detecting the
number of clusters of individuals using the software STRUCTURE: a simulation study. Molecular Ecology, 14(8), 2611-2620.
FAO-Food and Agriculture Organization. Statisitical databases – Agriculture. Rome: FAO. Retrivede from: http:www.//apps.fao.org
Francelino, F. M. A., Gravina, G. A., Manhães, C. M. C., Cardoso, P. M. R., & Araújo, L. C. (2011). Avaliação de linhagens de feijão-de-vagem para as regiões norte e noroeste fluminense. Ciência Agronômica, 42(2), 554-562. Gepts, P., Osborn, K., Rashka, K., & Bliss, F. (1986).
Phaseolin-protein variability in wild forms and landraces of the common bean (Phaseolus vulgaris): evidence for multiple center of domestication.
Economic Botany, 40(4), 451-468.
Gonçalves, L. S. A., Rodrigues, R., Sudré, C. P., Bento, C. S., Moulin, M. M., Araujo, M. L., ... Pereira, M. G. (2008a). Divergência genética em tomate estimado por marcadores RAPD em comparação com descritores multicategóricos. Horticultura Brasileira, 26(3), 364-370. Gonçalves, L. S. A., Rodrigues, R., Amaral Júnior, A. T.,
Karasawa, M., & Sudré, C. P. (2008b). Comparison of multivariate statistical algorithms to cluster tomato heirloom accessions. Genetics and Molecular Research, 7(4), 1289-1297.
Gupta, P. K., Rustgi, S., & Mir, R. R. (2013). Array-based high-throughput DNA markers and genotyping platforms for cereal genetics and genomics. In Cereal Genomics II (p. 11-55). Dordrecht: Springer.
Hubisz, J. M., Falush, D., Stephens, M., & Pritchard, J. K. (2009). Inferring weak population structure with the assistance of sample group information. Molecular Ecology, 9(5), p. 1322-1332.
Kelly, J. D. (2001). Remaking bean plant architecture for efficient production. Advances in Agronomy, 71(1), 109-143. Koinange, E. M. K., Singh, S. P., & Gepts, P. (1996). Genetic control of the domestication syndrome in common-bean. Crop Science, 36(4), 1037-1045. Kolkman, J. M., & Kelly, J. D. (2003). QTL conferring
resistance and avoidance to white mold in common bean. Crop Science, 43(2), 539-548.
Kwak, M., Toro, O., Debouck, D. G., & Gepts, P. ( 2012). Multiple origins of the determinate growth habit in domesticated common bean (Phaseolus vulgaris). Annals of Botany, 110(8), 1573-1580.
Leal, A. A., Mangolin, C. A., Amaral Júnior, A. T., Gonçalves, L. S. A., Scapim, C. A., Mott, A. S., … Silva, M. F. P. (2010). Efficiency of RAPD versus SSR markers for determining genetic diversity among popcorn lines.
Genetics and Molecular Research, 9(1), 9-18.
Maciel, F. L., Echeverrigaray, S., Gerald, L. T. S., & Grazziotin, F. G. (2003). Genetic relationships and diversity among Brazilian cultivars and landraces of common beans (Phaseolus vulgaris L.) revealed by AFLP.
Genetics Resources and Crop Evolution, 50(8), 887-893. Metais, I., Hamon, B., Jalouzot, R., & Peltier, D. (2002).
Structure and level of genetic diversity in various bean types evidenced with microsatellite markers from a genomic enriched library. Theoretical and Applied Genetics, 104(8), 1346-1352.
Meudt, H. M., & Clarke, A. C. (2007). Almost forgotten or latest practice? AFLP applications, analyses and advances. Trends in Plant Science, 12(1), 107-117. Moulin, M. M., Rodrigues, R., Gonçalves, L. S. A., Sudré,
C. P., & Pereira, M. G. A. (2012). comparison of RAPD and ISSR markers reveals genetic diversity among sweet potato landraces (Ipomoea batatas (L.) Lam.). Acta Scientiarum. Agronomy, 34(2), 139-147. Myers, J. R., & Baggett, J. R. (1999). Improvement of snap
beans. In Singh, S. (Ed.), Common bean improvement for the 21 st century (p. 289-329). Dordrecht, NL: Springer. Pritchard, J. K., & Wen, W. (2004). Documentation for the
STRUCTURE software version 2. 2004. Retrivede from http://www.pritch.bsd.uchicago.edu/software/structure2_1. html
Santos, C. A. F., Oliveira, V. R., Rodrigues, M. A., Ribeiro, H. L. C., & Silva, G. O. (2011). Similaridade genética entre cultivares de cebola de diferentes tipos e origens, baseada em marcadores AFLP. Horticultura Brasileira, 29(1), 32-37.
Santos, D., Haesbaert, F. M., Lúcio, A. D.’C., Lopes, S. J., Cargnelutti Filho, A., & Benz, V. (2012). Aleatoriedade e variabilidade produtiva de feijão-de-vagem. Ciência Rural, 42(7), 1147-1154.
Sarle, W. S. (1983). The cubic clustering criterium [SAS, Technical Report – A-108]. Cary, NC: SAS Institute Inc. Smartt, J. (1990). Grain legumes: evolution and genetic
resources. Cambridge, UK: Cambrifge University Press. Sudré, C. P., Gonçalves, L. S. A., Rodrigues, R., Amaral Júnior, A. T., Riva-Souza, E. M., & Bento, C. S. (2010). Genetic variability in domesticated Capsicum
spp. as assessed by morphological and agronomic data in mixed statistical analysis. Genetics and Molecular Research, 9(1), 283-294.
Vos, P., Hogers, R., Bleeker, M., Reijans, M., Lee, T. V., Hornes, M., Friters, M., Pot, J., … Zabeau, M. (1995). AFLP: a new technique for DNA fingerprinting.
Nucleic Acids Research, 23(21), 4407-4414.
Received on November 4, 2014. Accepted on January 26, 2015.