Low-Lying Collective Levels in
224-
234Th Nuclei
Sohair M. Diab
Faculty of Education, Phys. Dept., Ain Shams University, Cairo, Egypt E-mail: [email protected]
The low-lying collective levels in224-234
Th isotopes are investigated in the frame work of the interacting boson approximation model (IBA-1). The contour plot of the poten-tial energy surfaces,V (; ), shows two wells on the prolate and oblate sides which indicate that all thorium nuclei are deformed and have rotational characters. The levels energy, electromagnetic transition rates B(E1) and B(E2) are calculated. Bending at angular momentumI+=20 has been observed for230
Th. Staggering effect has been calculated and beat patterns are obtained which indicate the existence of an interaction between the ground state band, (GSB), and the octupole negative parity band, (NPB). All calculated values are compared with the available experimental data and show rea-sonable agreement.
1 Introduction
The level schemes of 224-234
Th isotopes are characterized by the existence of two bands of opposite parity and lie in the region of octupole deformations. The primary evidence for this octupole deformaton comes from the parity-doublet bands, fast electric transition(E1)between the negative and positive parity bands and the low-lying1 ,0+2 and2+2 excita-tion energy states. This kind of deformaexcita-tion has offered a real challenge for nuclear structure models. Even-even thorium nuclei have been studied within the frame work of theSpdf interacting boson model [1] and found the properties of the low-lying states can be understood without stable octupole deformation. High spin states in some of these nuclei suggest that octupole deformation develops with increasing spin.
A good description of the first excited positive and neg-ative parity bands of nuclei in the rare earth and the actinide region has achieved [2–4] using the interacting vector boson model. The analysis of the eigen values of the model Hamil-tonian reveals the presence of an interaction between these bands. Due to this interaction staggering effect has repro-duced including the beat patterns.
Shanmugam-Kamalahran (SK) model [5] for-decay has been applied successfully to226-232
Th for studying their sha-pes, deformations of the parent and daughter nuclei as well as the charge distribution process during the decay. Also, a solu-tion of the Bohr Hamiltonian [6] aiming at the descripsolu-tion of the transition from axial octupole deformation to octupole vi-brations in light actinides224Ra and226Th is worked out.The parameter free predictions of the model are in good agree-ment with the experiagree-mental data of the two nuclei, where they known to lie closest to the transition from octupole deforma-tion to octupole vibradeforma-tions in this region. A new frame-work for comparing fusion probabilities in reactions [7] forming heavy elements, 220Th, eliminates both theoretical and ex-perimental uncertinities, allowing insights into systematic
be-havior, and revealing previously hidden characteristics in fu-sion reactions forming heavy elements.
It is found that cluster model [8] succeeded in reproducing satisfactorily the properties of normal deformed ground state and super deformed excited bands [9, 10] in a wide range of even-even nuclei,222 6 A > 242[11]. The calculated spin dependences [12] to the parity splitting and the electric multi pole transition moments are in agreement with the experimtal data. Also, a new formula between half-lives, decay en-ergies and microscopic density-dependent cluster model [13] has been used and the half-lives of cluster radioactivity are well reproduced.
A new imperical formula [14], with only three ters, is proposed for cluster decay half-lives. The parame-ters of the formula are obtained by making least square fit to the available experimental cluster decay data. The cal-culated half-lives are compared with the results of the ear-lier proposed models models, experimental available data and show excellent agreement. A simple description of the cluster decay by suggesting a folding cluster-core interaction based on a self-consistant mean-field model [15]. Cluster decay in even-even nuclei above magic numbers have investigated.
Until now scarce informations are available about the ac-tinide region in general and this is due to the experimental difficulties associated with this mass region. The aim of the present work is to:
(1) calculate the potential energy surfaces, V (; ), and know the type of deformation exists;
(2) calculate levels energy, electromagnetic transition rates
B(E1)andB(E2);
(3) study the relation between the angular momentum I, the rotational angular frequency~!and see if there any
bending for any of thorium isotopes;
nucleus EP S P AIR ELL QQ OCT HEX E2SD(eb) E2DD(eb)
224Th 0.2000 0.000 0.0081 0.0140 0.0000 0.0000 0.2150 0.6360
226Th 0.2000 0.000 0.0058 0.0150 0.0000 0.0000 0.2250 0.6656 228Th 0.2000 0.0000 0.0052 0.0150 0.0000 0.0000 0.1874 0.5543
230Th 0.2000 0.0000 0.0055 0.0150 0.0000 0.0000 0.1874 0.5543 232Th 0.2000 0.0000 0.0055 0.0150 0.0000 0.0000 0.1820 0.5384
234Th 0.2000 0.0000 0.0063 0.0150 0.0000 0.0000 0.1550 0.4585
Table 1: Parameters used in IBA-1 Hamiltonian (all in MeV).
2 (IBA-1) model
2.1 Level energies
The IBA-1 model was applied to the positive and negative parity low-lying states in even-even224-234
Th isotopes. The proton,, and neutron,, bosons are treated as one boson and the system is considered as an interaction betweens-bosons andd-bosons. Creation(sydy)and annihilation(s ~d) operat-ors are forsanddbosons. The Hamiltonian [16] employed for the present calculation is given as:
H = EP S nd+ P AIR (P P )
+12ELL (L L) +12QQ (Q Q)
+ 5OCT (T3 T3) + 5HEX (T4 T4) ;
(1)
where
P p = 12 2 4
n
(sysy)(0) 0
p
5(dydy)(0) 0
o x n
(ss)(0)0 p5( ~d ~d)(0)0 o
3 5
(0)
0
; (2)
L L = 10p3h(dyd)~(1)x (dyd)~(1)i(0)
0 ; (3)
Q Q =p5 2 6 6 6 4
(Syd + d~ ys)(2)
p 7
2 (dyd)~(2)
x
(syd + + ~~ ds)(2)
p 7
2 (dyd)~(2) 3 7 7 7 5 (0) 0 ; (4)
T3 T3=
p
7h(dyd)~(2)x (dyd)~(2)i(0)
0 ; (5)
T4 T4= 3
h
(dyd)~(4)x (dyd)~(4)i(0)
0 : (6)
In the previous formulas,ndis the number of boson;P P,
L L,Q Q,T3 T3andT4 T4represent pairing, angular mo-mentum, quadrupole, octupole and hexadecupole interactions between the bosons;EP Sis the boson energy; andP AIR,
ELL,QQ,OCT,HEX is the strengths of the pairing, an-gular momentum, quadrupole, octupole and hexadecupole in-teractions.
2.2 Transition rates
The electric quadrupole transition operator [16] employed in this study is given by:
T(E2) = E2SD (syd + d~ ys)(2)+
+ p1
5E2DD (dyd)~(2): (7)
The reduced electric quadrupole transition rates between
Ii! Ifstates are given by
B (E2; Ii If) = [< If k T (E2)k I
i>]2
2Ii+ 1 : (8)
3 Results and discussion
3.1 The potential energy surface
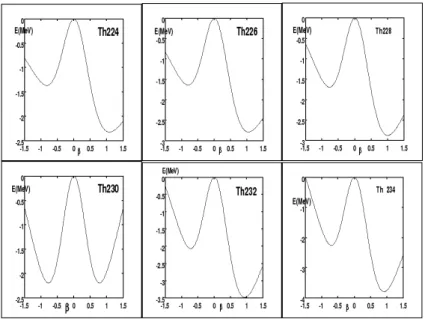
The potential energy surfaces [17],V (,), for thorium iso-topes as a function of the deformation parameters and have been calculated using :
ENN(; ) = <NN; jHjNN; > =
= d(NN)2(1 + 2) + 2(1 + 2) 2
kNN[4 ( XX) cos 3] +
+
[ XX2] + N(N 1)
1 10c0+
1 7c2
2;
(9)
where
X=
2 7
0:5
X = or : (10)
I+i I+f 224Th 226Th 228Th 230Th 232Th 234Th
01Exp. 21 ——- 6.85(42) 7.06(24) 8.04(10) 9.28(10) 8.00(70)
01Theor. 21 4.1568 6.8647 7.0403 8.038 9.2881 8.0559
2101 0.8314 1.3729 1.4081 1.6076 1.8576 1.6112
2201 0.0062 0.0001 0.0044 0.0088 0.0105 0.0079
2202 0.4890 0.8357 0.8647 1.0278 1.2683 1.1659
2301 0.0127 0.0272 0.0211 0.0157 0.0122 0.0075
2302 0.1552 0.0437 0.0020 0.0023 0.0088 0.0099
2303 0.1102 0.0964 0.0460 0.0203 0.0079 0.0023
2403 0.2896 0.4907 0.5147 0.6271 0.8048 0.7786
2404 0.1023 0.0709 0.0483 0.0420 0.0385 0.0990
2221 0.1837 0.1153 0.0599 0.0387 0.0286 0.0174
2321 0.0100 0.0214 0.0211 0.0198 0.0178 0.0118
2322 0.8461 1.0683 0.5923 0.2989 0.1538 0.0697
4121 1.3733 2.0662 2.0427 2.2957 2.6375 2.2835
4122 0.0908 0.1053 0.0764 0.0579 0.0445 0.0266
4123 0.0704 0.0325 0.0104 0.0038 0.0018 0.0008
6141 1.5696 2.2921 2.2388 2.4979 2.8606 2.4745
6142 0.0737 0.0858 0.0685 0.0585 0.0493 0.0312
6143 0.0584 0.0404 0.0198 0.0106 0.0061 0.0029
8161 1.5896 2.3199 2.2720 2.5381 2.9105 2.5220
8162 0.0569 0.0660 0.0554 0.0511 0.0466 0.0314
8163 0.0483 0.0421 0.0256 0.0166 0.0109 0.0055
10181 1.4784 2.2062 2.1948 2.4760 2.8586 2.4899 10182 0.0448 0.0513 0.0438 0.0422 0.0407 0.0290
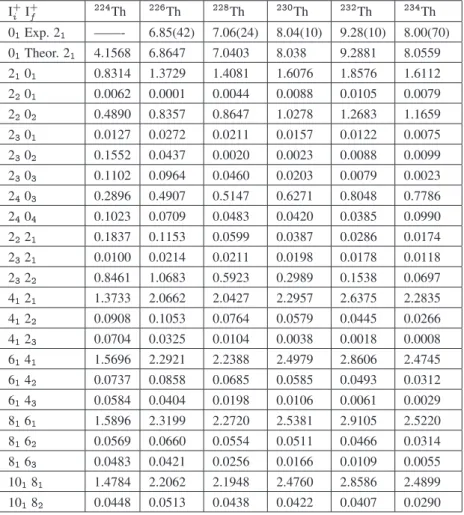
Table 2: Values of the theoretical reduced transition probability,B(E2)(ine2b2).
Ii I+f 224Th 226Th 228Th 230Th 232Th 234Th
1101 0.0428 0.0792 0.1082 0.1362 0.1612 0.1888 1102 0.0942 0.0701 0.0583 0.0534 0.0515 0.0495
3121 0.1607 0.1928 0.2209 0.2531 0.2836 0.3227 3122 0.0733 0.0829 0.0847 0.0817 0.0768 0.0717
3123 0.0360 0.0157 0.0054 0.0013 0.0002 0.0000 3141 0.0233 0.0441 0.0652 0.0884 0.1150 0.1384
3142 0.0170 0.0285 0.0371 0.0424 0.0460 0.0449 5141 0.2873 0.3131 0.3363 0.3657 0.3946 —–
5142 0.0787 0.0834 0.0868 0.0865 0.0835 —– 5143 0.0160 0.0101 0.0051 0.0020 0.0006 —–
7161 0.4178 0.4387 0.4581 0.4839 0.5100 —– 7162 0.0732 0.0757 0.0798 0.0817 0.0812 —– 9181 0.5532 0.5690 0.5848 0.6070 0.6301 —–
9182 0.0639 0.0665 0.0707 0.0735 0.0748 —–
Fig. 1: Potential Energy surfaces for224-234
Th nuclei.
3.2 Energy spectra
IBA-1 model has been used in calculating the energy of the positive and negative parity low -lying levels of thorium se-ries of isotopes. In many deformed actinide nuclei the neg-ative parity bands have been established and these nuclei are considered as an octupole deformed. A simple means to ex-amine the nature of the band is to consider the ratio R which for octupole band ,R 1, and defined as [18]:
R = E (I + 3) E (IE (I) E (I 2)1)NP B
GSB : (11)
In the present calculations all values of R for thorium se-ries of isotopes are 1, and we treated them as octupole deformed nuclei.
A comparison between the experimental spectra [19–24] and our calculations, using values of the model parameters given in Table 1 for the ground and octupole bands, are illus-trated in Fig. 2. The agreement between the calculated levels energy and their correspondence experimental values for all thorium nuclei are slightly higher especially for the higher excited states. We believe this is due to the change of the projection of the angular momentum which is due to band crossing and octupole deformation.
Unfortunately there is no enough measurements of elec-tromagnetic transition ratesB (E2)orB (E1)for these series of nuclei. The only measured B (E2; 0+1 ! 2+1)’s are pre-sented, in Table’s 2,3 for comparison with the calculated val-ues. The parameters E2SDand E2DD used in the pres-ent calculations are determined by normalizing the calculated values to the experimentally known ones and displayed in Table 1.
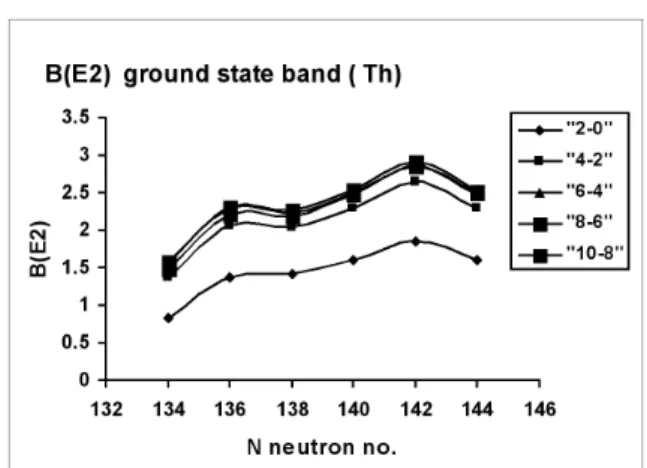
For calculatingB (E1)andB (E2)electromagnetic tran-sition rates of intraband and interaband we did not introduce any new parameters. Some of the calculated values are pre-sented in Fig. 3 and show bending at N =136, 142 which means there is an interaction between the (+ve)GSB and
( ve)parity octupole bands.
The moment of inertia I and energy parameters ~! are
calculated using equations (12, 13):
2I
~2 =
4I 2
E(I ! I 2); (12)
(~!)2= (I2 I + 1)
E(I ! I 2) (2I 1)
2
: (13)
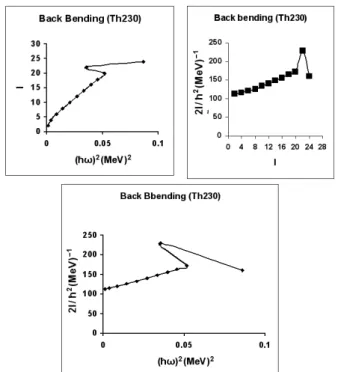
All the plots in Fig. 4 show back bending at angular mo-mentumI+= 20for230Th. It means, there is a band crossing and this is confirmed by calculating staggering effect to these series of thorium nuclei. A disturbance of the regular band structure has observed not only in the moment of inertia but also in the decay properties.
Fig. 3: The calculated B(E2)’s for the ground state band of
224-234Th isotopes.
3.3 The staggering
The presence of odd-even parity states has encouraged us to study staggering effect for 218-230Th series of isotopes [10, 12, 25, 26]. Staggering patterns between the energies of the GSB and the ( ve) parity octupole band have been calcu-lated,I = 1, using staggering function equations (14, 15) with the help of the available experimental data [19–24].
Stag (I) = 6E (I) 4E (I 1) 4E (I + 1) + E (I + 2) + E (I 2) ; (14)
with
E (I) = E (I + 1) E (I) : (15) The calculated staggering patterns are illustrated in Fig. 5, where we can see the beat patterns of the staggering behavior which show an interaction between the ground state and the octupole bands.
3.4 Conclusions
The IBA-1 model has been applied successfully to224-234Th isotopes and we have got:
1. The ground state and octupole bands are successfully reproduced;
2. The potential energy surfaces are calculated and show rotational behavior to 224-234Th isotopes where they are mainly prolate deformed nuclei;
3. Electromagnetic transition rates B (E1) and B (E2) are calculated;
4. Bending for 230Th has been observed at angular mo-mentumI+= 20;
5. Staggering effect has been calculated and beat patterns are obtained which show an interaction between the ground state and octupole bands;
Fig. 4: Angular momentumI as a function of the rotational fre-quency (~!)2and 2I/~2as a function of (~!)2for the GSB of230Th.
Fig. 5: I = 1, staggering patterns for the ground state and oc-tupole bands of224-232Th isotope.
References
1. Hinde D. J and Dasgupta M.Nucl. Phys. A, 2007, v. 787, 176c.
2. Lenis D. and Bonatsos D.Phys. Lett. B, 2006, v. 633, 474.
3. Xu F. R. and Pei J. C.Phys. Lett. B, 2006, v. 642, 322.
4. Ghanmugam G., Sudhakar S and Niranjani S.Phys. Rev. C, 2005, v. 72, 034310.
5. Buck B., Merchant A. C., Perez S. M. and Seals H. E.J. Phys. G, 2005, v. 31, 1499.
6. Balasubramaniam M., Kumarasamy S. and Arunachalam N.
Phys. Rev. C, 2004, v. 70, 017301.
7. Zhongzhou Ren, Chang Xu and Zaijun Wang.Phys. Rev. C, 2004, v. 70, 034304.
8. Shneidman T. M., Adamian G. G., Antonenko N. V., Jolos R. V. and Scheid W.Phys. Rev. C, 2003, v. 67, 014313.
9. Buck B., Merchant A. C. and Perez S. M.Phys. Rev. C, 2003, v. 68, 024313.
10. Ganev V. P., Garistov V. P., and Georgieva A. I.Phys. Rev. C, 2004, v. 69, 014305.
11. Minkov N., Drenska S. B.,Drenska S. B., Raychev P. P., Rous-sev R. P. and Bonatsos D.Phys. Rev. C, 2001, v. 63, 044305.
12. Bonatsos D., Daskaloyannis C., Drenska S. B., Karoussos N., Minkov N., Raychev P. P. and Roussev R. P.Phys. Rev. C, 2000, v. 62, 024301.
13. Adamian G. G., Antonenko N. V., Jolos R. V., Palchikov Yu. V., Scheid W. and Shneidman T. M.Nucl. Phys. A, 2004, v. 734, 433.
14. Buck B., Merchant A. C., Horner M. J. and Perez S. M.Phys. Rev. C, 2000, v. 61, 024314.
15. Zamfir N. V. and Kusnezov D. Phys. Rev. C, 2001, v. 63, 054306.
16. Feshband H. and Iachello F.Ann. Phys., 1974, v. 84, 211.
17. Ginocchio J. N and Kirson M. W.Nucl. Phys. A, 1980, v. 350, 31.
18. Gross E., de Boer J., Diamond R.M., Stephens F. S. and Tjom P.Phys. Rev. Lett, 1975, v. 35, 565.
19. Agda Artna-Cohen.Nucl. Data Sheets, 1997, v. 80, 227.
20. Akovali Y. A.Nucl. Data Sheets, 1996, v. 77, 433.
21. Agda Artna-Cohen.Nucl. Data Sheets, 1997, v. 80, 723.
22. Akovali Y. A.Nucl. Data Sheets, 1993, v. 69, 155.
23. Browne E.Nucl. Data Sheets, 2006, v. 107, 2579.
24. Browne E.Nucl. Data Sheets, 2007, v. 108, 681.
25. Minkov N., Yotov P., Drenska S. and Scheid W.J. Phys. G, 2006, v. 32, 497.