An In fra-Red H eatin g Based Fast Method of Moisture
Con ten t Measurem en t an d Its Application to Measure
Blen d Proportion of Polyester-Viscose Woven Fabrics
V.K. Kothari and Kausik Bal
Indian Institute of Technology, New Delhi, INDIA
Correspondence To:
V.K. Kothari, email:
kotharivk@gmail.com
ABSTRACT
Moisture content values of plain woven fabrics of polyester-viscose blended yarns were measured using standard conditioning procedures as well as a new method of preconditioning of samples using infrared heating and subsequent conditioning in a desiccator for a specific conditioning time. The effects of drying time and conditioning time on measured moisture content values were studied and optimization of these parameters were done. Results of the moisture content measurement using these methods show a sufficiently linear relationship between measured moisture content and the proportion of viscose in the fabric samples. The regression analysis showed very high coefficients of determination (above 0.98) in all cases. Regression equations were used to predict the blend proportion of fabric samples from the moisture content data. It was found that even the moisture content values using a shorter conditioning time of 60 minutes and even 10 minutes yielded correct prediction with a maximum error of magnitude less than 3.0 in blend percentage values.
INTRODUCTION
Since the advent of man-made fibers, blends of various synthetic and cellulosic fibers have come to market with generally wide acceptance, as these offer better properties at reasonable price. Polyester-cotton, polyester-viscose are such popular blends. The addition of more than one type of fibers has proved to be beneficial on various accounts. This is done on economic grounds, to create decorative effects, to produce materials with improved properties or special effects, to take advantage of differences in dyeing properties of the fibers, or to facilitate the production of special type of fabrics. Measurement of
the proportion of the components in a blend is very important in the manufacturing industry for quality control. Standard methods for determination of the proportion of components in a blended textile product generally involve either chemical analysis or microscopic analysis [1]. However, both are destructive, time consuming and sometimes hazardous. The NIR spectroscopic method offers another method for analysis of blend proportion [2]. But it hardly seems a convenient alternative for industrial purposes, as the cost involved would be quite high. A physical non-destructive method for determination of blend composition in case of fiber blends has been described for blends of polynosic, viscose, polyester-wool and cotton-wool [3,4]. This physicochemical method is based on measurement of moisture content of the fiber blend and its component fibers. It has been shown that in all cases studied, the equilibrium moisture regain of the fiber blend was a linear function of the blend composition. The moisture regain was measured using standard method which included drying of the samples in an air-circulated oven for 3hours and conditioning in a desiccator for 48hours.
23 hygroscopic materials such as cellulosic and protein fibers.
This manuscript describes a physical approach to determine the blend composition of polyester-viscose blended fabrics using moisture content measurement. A thermo-gravimetric method of moisture content measurement was adopted. A commercially available digital moisture analyzer was used for this purpose. The samples were dried in the apparatus by an infra-red heater and the weight of the sample under study was continuously measured to calculate the moisture content value. The possibility of reducing the total time of measurement was explored by adopting a faster preconditioning and conditioning procedure.
MATERIALS AND METHODS
Plain woven fabric samples of polyester-viscose blend were used for this study. The details of the various fabric samples are given in Table I. The nominal blend proportion was supplied by the manufacturer of the fabrics. The actual blend proportion was measured using standard chemical analysis [1].
TABLE I: Details of fabrics
Fabric Code
Actual Proportion of Viscose in Fabric
(%)
Fabric Weight (g/m2)
Warp Count (Ne)
Weft Count (Ne)
Ends /inch
Picks /inch
PV1 0 189 14.2 13.9 61 53
PV2 20 189 14.6 15 60 53
PV3 28.3 194 14.5 14.2 62 52
PV4 37 194 14.2 14 62 53
PV5 47.7 201 14.8 14 62 54
PV6 56.3 199 14.6 14.7 62 53
PV7 100 182 14.1 14.1 62 52
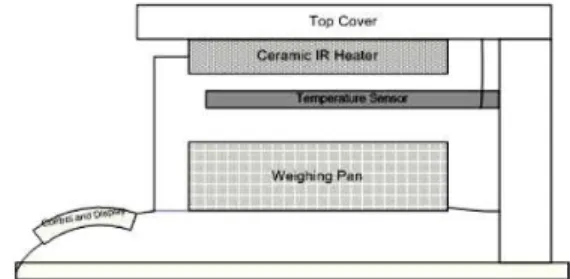
An electronic moisture analyzer Sartorius MA 45 was used for measurement of moisture content of the fabrics [6]. This moisture analyzer has a digital weighing scale with a 3” diameter pan. The samples were cut into pieces to cover this pan. A ceramic infra-red heater of circular shape is fixed on the lower side of the top cover of the analyzer. A sensitive thermometer measures the temperature of the heated chamber. A microcontroller circuit detects the change of weight of the sample with time as the sample is heated with the infra-red heat. As the sample is heated, the water molecules start evaporating as a result of which the weight of the sample decreases. The instrument can automatically detect the end point
of analysis when the rate of change of weight falls under a specific value [7, 8]. Figure 1 shows a schematic diagram of this instrument.
FIGURE 1. Schematic diagram of Sartorius Moisture Analyzer
Moisture content measurement was done by first drying the samples, then conditioning in a desiccator and then measuring the moisture content using the Sartorius moisture analyzer. Two types of sample preparation were tried. In one case, the drying of samples was done in a hot air oven with air circulation by subjecting the samples at 105°C (± 1°C) for 1 hour. The samples were then inserted inside a desiccator containing saturated solution of sodium nitrite. Thus the samples were conditioned at an RH of 66% (± 1%) for 24 hours. This procedure is referred in this paper as conventional conditioning.
In the other case, which will be termed as new conditioning method in this paper, the samples were heated by infra-red heater using. The Sartorius moisture analyzer for a short time in order to evaporate all the moisture from the fabrics, then the samples were kept in the desiccator containing a saturated solution of sodium nitrite for conditioning. The conditioning time in this case was relatively low. In order to optimize the drying and conditioning time, separate studies were done to see the effect of these two parameters on the measured moisture content of fabrics.
the calibrated curve. The errors are reported here under.
RESULTS AND DISCUSSION
Study of Drying Rate Using Infra-red Heating
In order to optimize the drying time for pre-conditioning using the Sartorius moisture analyzer’s infra-red heater, fabrics of PV1 and PV7 were chosen. Choice of 100 % polyester and 100% viscose was made so that the extreme rates on both high and low side could be obtained. Five pieces of each fabric were cut and kept in a hot air oven at 105°C (± 1°C) for 1 hour and then the samples were kept in a desiccator containing saturated solution of sodium nitrite. After conditioning for 48 hours, the samples were tested in Sartorius moisture analyzer using a continuous drying program up to 5 minutes. The samples were taken from the desiccator for testing in a random order. The results are given in Figure 2.
0.00 2.00 4.00 6.00 8.00 10.00 12.00 14.00
0 1 2 3 4 5
T im e (m in u te s )
Lo
s
s
of
mo
is
tu
re
(%
)
P oly es ter
V is c os e
FIGURE 2. Rate of drying of polyester and viscose fabrics under infra-red heating (data points are average of five readings, standard
deviations are shown by vertical error bars)
It is clearly observed from the figure that polyester is completely dried after 1.5 minutes and viscose is completely dried after 3.5 minutes. Hence, 4 minutes of drying time would be sufficient for completely drying all types of polyester-viscose blends using this method.
Effect of Conditioning Time using the New Conditioning Method
The effect of conditioning time using the the new method on the measured moisture content values were studied using five levels of blend compositions and four levels of conditioning time. For this purpose PV1, PV4, PV5, PV6 and PV7 fabrics were chosen. Five pieces of each of these fabrics were dried under
infra-red at 105°C (± 1°C) for 4 minutes and then kept in a desiccator containing saturated solution of sodium nitrite for Δt time. Then the moisture content values of the samples were measured using automatic measurement mode of Sartorius moisture analyzer at a testing temperature of 105°C. The samples were selected in a random order. For Δt, four levels were chosen: 5, 10, 30 and 60 minutes. The results are shown graphically in Figure 3.
It is clear from the figure that the effect of conditioning time is relatively less on PV1 fabric whereas it is maximum for PV7. This indicates that the hygroscopic material viscose not only has higher equilibrium moisture content but also takes a much longer time to reach the equilibrium value. The error bars partially overlap in case of PV4, PV5 and PV6 fabrics at lower conditioning time, however, at 60 minutes, the difference between the fabrics appears more significant.
0 1 2 3 4 5 6 7 8 9 10
5 10 15 20 25 30 35 40 45 50 55 60
C onditioning Time (minute s)
Mo
is
tu
re
Co
n
te
n
t
(%
)
PV 1 PV 4 PV 5 PV 6 PV 7
FIGURE 3. Effect of conditioning time on measured moisture content (data points are average of five readings, standard
deviations are shown by vertical error bars with caps)
Study on Dependence of Moisture Content on Blend Proportion of Polyester-Viscose Woven Fabrics
25 PV6 and PV7. The results are given in a graphical mode in Figure 4. Trend lines by linear curve fitting along with the coefficient of determinations, standard errors and regression equations are also given in the figure.
All the curves are linear having very high R2 values (above 0.98) which confirm the linear dependency of moisture content on the blend proportion. However, the curve for conditioning time of 10 minutes has a significantly higher initial Y-value resulting in a lower slope. The standard error of the corresponding regression line is also much higher than the other two cases.
It is obvious from Figure 4 that the curve for a conditioning time of 24 hours can be used as a standard calibration master curve for calculating equilibrium moisture content of polyester-viscose woven fabrics within a standard error of 0.159. It is also very interesting to note that even the curve for a conditioning time of 60 minutes can also be used for the same purpose within a standard error of 0.128. Although this curve yields a relatively low value of moisture content, it is expected that for comparing unknown samples of polyester-viscose fabric, this curve would be sufficient because of its good linearity and low standard error value.
y = 0.0925x + 0.4586 R2 = 0.9985
y = 0.0808x + 0.5393 R2 = 0.9987
y = 0.0502x + 0.9889
R2 = 0.9838
0 2 4 6 8 10 12
0 20 40 60 80 100
P r o p o r tio n o f vis c o s e in p o lye s te r‐vis c o s e w o ve n
fab r ic (% )
Mo
is
tu
re
Co
n
te
n
t
(%
)
24 h c onditioning 60 min. c onditioning 10 min. c onditioning
FIGURE 4. Variation of moisture content with blend proportion (data points are average of five readings, standard deviations are
shown by vertical error bars with caps)
Faster Determination of Blend Proportion of Polyester-Viscose Woven Fabrics using Moisture Content
The regression equations as given in Figure 4 are:
458
.
0
92
.
0
x
y
(1)539
.
0
080
.
0
x
y
(2)988
.
0
050
.
0
x
y
(3)for conditioning time of 24 hours, 60 minutes and 10 minutes respectively, where percentage of viscose in polyester-viscose blended woven fabric and moisture content percentage.
Now transposing the above equations we can write
978
.
4
869
.
10
M
P
V C (4)738
.
6
5
.
12
M
P
V C (5)76
.
19
0
.
20
M
P
V C (6)Where
x
P
V percentage of viscose inpolyester-viscose blended woven fabric and
y
M
C measured moisture contentpercentage.
Two fabrics PV3 and PV5 were taken for checking the accuracy of the above equations. The moisture content of five pieces of each of these fabrics were measured using 24 hours conditioning, 60 minute conditioning and 10 minute conditioning times. The results are given in Table II.
TABLE II. Moisture content values of fabrics which are used to check the calibration master curve (values in parenthesis correspond to the standard deviation of five readings in each case)
Fabric Code
Moisture content after conditioning for 24 h
(%)
Moisture content after conditioning for 60 min.
(%)
Moisture content after conditioning for 10 min.
(%) PV3 3.18 (0.138) 2.988 (0.127) 2.50 (0.118) PV5 4.98 (0.27) 4.38 (0.39) 3.42 (0.3)
hours conditioning, Eq. (5) for 60 minute conditioning and Eq. (6) for 10 minute conditioning time.
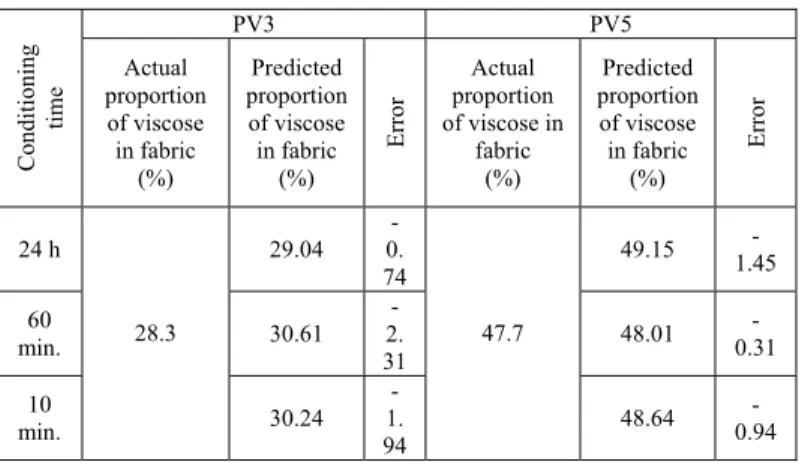
TABLE III. Errors in prediction of blend proportion using moisture content of polyester-viscose blended woven fabrics
PV3 PV5
Conditioning
time
Actual proportion of viscose in fabric
(%)
Predicted proportion of viscose in fabric
(%)
Erro
r
Actual proportion of viscose in
fabric (%)
Predicted proportion
of viscose in fabric
(%)
Erro
r
24 h 29.04
-0. 74
49.15
-1.45
60
min. 30.61
-2. 31
48.01
-0.31
10 min.
28.3
30.24 -1. 94
47.7
48.64
-0.94
From Table III, it is observed that the maximum error in prediction is 2.31% in magnitude which is encouraging. Probably if more samples of runs are used (in this study only five runs were used), the accuracy of the master curve as well as that of the prediction would improve further. However, the above study definitely indicates that with a reasonable compromise on the accuracy, a faster method of conditioning and moisture content measurement can be used to determine the blend proportion of polyester-viscose woven fabrics.
SUMMARY
The present study establishes the utility of this approach to determine the blend proportion in polyester-viscose blends in woven fabrics. Several plain woven fabrics were developed and used for this study. All the fabrics had approximately similar structures, but had different blend proportions. Equilibrium moisture content was measured using a standard conditioning procedure with a commercial moisture analyzer. A new rapid conditioning method by drying the samples with infra-red and then conditioning them for a shorter duration was also used to compare the moisture content values of different blend levels. In all cases, the moisture content values showed linear relationships with the proportion of viscose in the fabrics. Regression equations were used to predict the blend proportion of polyester-viscose blended woven fabrics with reasonable accuracy. The results show that it is
possible to reduce the total time of testing by a significant amount with reasonable accuracy when determining the blend proportion of fabrics. It is expected, therefore, that such a method could be used for low cost quality control purposes in siuations where a slight compromise compromise in accuracy would be acceptable in view of a huge reduction in testing time.
REFERENCES
1. Standard Test Methods for Quantitative Analysis of Textiles, ASTM D 629-99; ASTM International, West Conshohocken, PA, (2000)
2. Ghosh, S.; New Approaches to Textile Measurements, in Testing and Quality Management, Vol. 1, edited by Kothari V K, (1999)
3. Kumar, R.; Sarma, T. S.; Srivastava, H. C.; Quantitative Analysis of Cotton-Polynosic Blends; Textile Res. J., 49, 11, 1979, 673-675.
4. Kumar, R.; Srivastava, H. C.; Analysis of Fiber Blends Part II Determination of Blend Composition by Moisture Regain; Textile Res. J., 50, 6, 1980, 359-362. 5. Saville, B. P.; Physical Testing of Textiles; The Textile
Institute, Woodhead Publishing Ltd., Cambridge, England, 1999.
6. Sartorius MA 45 Operating Instructions, Sartorius AG, Germany, 2001.
7. US 4889201, Drying Balance with Evaluation Circuit for Determining the End of the Drying, United States Patent, 1989.
8. US D438808S, Moisture Analyzer, United States Design Patent, 2001.
AUTHOR ADDRESS
V.K. Kothari Kausik Bal
Department of Textile Technology Indian Institute of Technology Hauz Khas, New Delhi 110016 INDIA