A Framework to Explore the Knowledge
Structure of Multidisciplinary Research Fields
Shahadat Uddin1, Arif Khan1*, Louise A. Baur2
1Complex Systems Research Group, Project Management Program, University of Sydney, Sydney, New South Wales, Australia,2Discipline of Paediatrics & Child Health, and Sydney School of Public Health, University of Sydney, Sydney, New South Wales, Australia
Abstract
Understanding emerging areas of a multidisciplinary research field is crucial for research-ers, policymakers and other stakeholders. For them a knowledge structure based on longi-tudinal bibliographic data can be an effective instrument. But with the vast amount of available online information it is often hard to understand the knowledge structure for data. In this paper, we present a novel approach for retrieving online bibliographic data and pro-pose a framework for exploring knowledge structure. We also present several longitudinal analyses to interpret and visualize the last 20 years of published obesity research data.
Introduction
Scientific articles are valuable sources of information for scholarly research. Apart from the main text, their metadata hold a significant amount of information. For example, keywords and title can reveal the subject matter of the article, while citation count, impact factor etc. are used to roughly estimate significance of the article. The learnings and inferences from metadata can be treated as simple information retrieval which performs quite well when dealing with a limited number of specific articles. However, when someone wants to synthesize broader un-derstandings on an area, such an approach has some shortcomings. One problem is that, the high volume of metadata from a large number of articles often makes it hard for readers to as-similate—resulting in an information overload [1]. Although traditional search engines and various web services (e.g., Google Scholar [2], PubMed [3], Scopus [4] and Web of Science [5]) offer search and limited analysis functions in this regard, they cannot be used effectively to ana-lyze more complex relationships of metadata entities such as keywords, affiliation etc. So, in order to gain insights about the research field from a broader perspective, we need further anal-ysis of metadata information to synthesize higher meaning. This can be termed as a knowledge system which abstracts, organizes and represents metadata information to general audiences. An effective knowledge system [6], therefore, acts as a valuable tool for retrieving relevant, im-portant and summarized information [7] that are essential for different communities of stake-holders in today’s knowledge-driven society. For example, this can bring a competitive advantage to stakeholders by choosing suitable field for investment, help aspiring researchers a11111
OPEN ACCESS
Citation:Uddin S, Khan A, Baur LA (2015) A Framework to Explore the Knowledge Structure of Multidisciplinary Research Fields. PLoS ONE 10(4): e0123537. doi:10.1371/journal.pone.0123537
Academic Editor:Frederique Lisacek, Swiss Institute of Bioinformatics, SWITZERLAND
Received:July 23, 2014
Accepted:March 4, 2015
Published:April 27, 2015
Copyright:© 2015 Uddin et al. This is an open access article distributed under the terms of the
Creative Commons Attribution License, which permits unrestricted use, distribution, and reproduction in any medium, provided the original author and source are credited.
Data Availability Statement:All relevant data are within the paper and its Supporting Information files.
Funding:The authors have no support or funding to report.
to choose a promising topic and guide funding agencies as well as policy makers in distributing funds. In this paper, we present a novel framework in order to obtain a summary picture of longitudinal research trend from web mining of bibliographical data.
Considerable amount of research has been done in organizing knowledge systems from bib-liographic data. For example, metadata that contain evaluative entities [8] (e.g., paper, author, journal and affiliation) are utilized to measure scholarly impacts [9] such as identifying influen-tial players in a specific scientific field using author citation analysis [10,11] or ranking presti-gious journals using journal citation networks [12]. Also metadata containing knowledge entities such as keyword, topics, subject categories, key method etc. act as a carrier of knowl-edge units in scientific articles [9] and facilitate knowledge discovery [8]. Several methods can be found which deal with the analysis of bibliographic data containing time-stamp markers (i.e., longitudinal data such as publication year, funding duration etc.). These methods [13–17] are mostly being focused on the particular contexts of trend analysis or link prediction and often employ generic statistical methods such as frequency analysis and regression analysis in various contexts to understand the research intensity and forecast future trends. Such ap-proaches are often applied in citation analysis to reveal various scholarly impacts such as prom-inent articles, authors’expertise and future collaborations [18]. Some higher level approaches that consider the relation between metadata including co-word analysis [19] of entities (key-words, citation etc.), knowledge maps [20] and gene-word analysis [21] are often being used to trace the relationships between the evolution of research fields [22,23]. The application of so-cial network theories to bibliographic data might be considered as a more recent phenomenon which takes the complex relationships between entities into account [19]. For example, schol-ars use network theories on keywords to analyze the knowledge structure of research domains by defining keywords as actors and co-occurrences between keywords as ties between them. These methods can reveal different aspects of knowledge structure. However, they have some limitations at presenting the complete picture of a multi-dimensional research domain such as obesity, especially when acquiring bibliographic information from large unstructured or semi-structured data and organizing them [24]. In our proposed framework, we introduce a system-atic set of analysis methods that can address this issue.
study is to analyze the keywords of these research articles in order to explore how effectively they can explain these evolutions in understanding obesity as well as revealing any insight that might be otherwise overlooked.
Research Methods
In this section, we first introduce the framework and discuss its different functional parts. In the later part, we implement our research framework on particular research domain (i.e., obesi-ty) and describe specific adaptation methods of the framework in the implementation.
Proposed framework
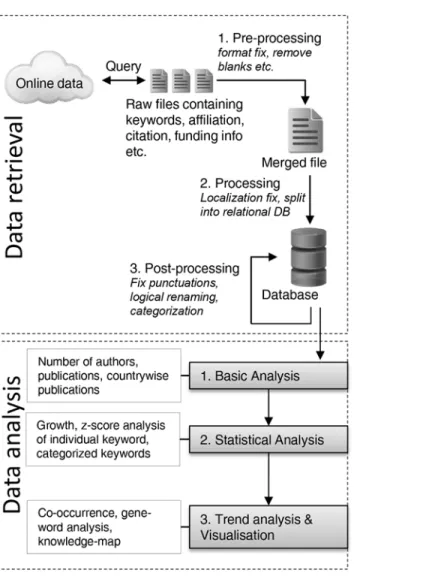
Our proposed framework consists of two major parts. The first part deals with retrieving unor-ganized or semi-orunor-ganized data from online sources and then organizes them in structured fashion. This makes the data ready for further analysis for the next part. The analysis part is ex-ecuted in several steps to discover different sorts of information from the data.Fig 1shows summarized steps of the framework. Each of the parts is described in details below.
Fig 1. Summarized research framework.
Data retrieval. Different online sources, institutional libraries and web services provide bibliographic data for general users. Although these repositories contain vast amount of meta-data, their web interfaces normally provide basic search and analysis function like simple fre-quency and trending keywords statistics etc. For most users, this information is quite sufficient but when utilized fully this vast amount of background metadata has potential to reveal the knowledge structure of the complete research field. For that, first part of the research frame-work concentrates on retrieving the complete metadata on particular research topic. Normally most web services let user download the metadata in tabular (i.e., excel) or structured (i.e., xml) format. However, some restrictions still apply on data usage and access policy. Many web ser-vices have subscription policy and access and downloading of metadata are limited to individu-ally subscribed users. Many higher educational and research institutions also have group subscription and users can download the metadata within institutional network. However, this data normally do not come all at once. One important reason behind that is the security which prevents users from exhausting web resources (e.g., denial of service or DoS attack [33]). So, to get the complete metadata, our framework follows a approach which downloads the metadata sequentially either by manual querying (if download number is small) or using a script that fol-lows the request limit guidelines setup by the web service policy. The actual method depends on the type of web service used to download the metadata.
Next, the downloaded metadata files that normally come in comma separated, XML, text or excel file format are merged together by means of a script or software in a quite straightforward way. The merged file is then inspected in several steps for formatting inconsistencies and am-biguous entries. Atpre-processingpart, the file is inspected to make sure that all records are valid. Metadata that have missing titles, empty author names or having other essential fields empty—are removed from the file. Also the file is searched for duplicate entries by matching the unique identifiers like paper titles, DOI (Digital Object Identifier) number etc. Then, in the
mainprocessingpart, the file is inspected again to normalize entries such as renaming same
words with different spelling. Due to localization of spelling of papers from different locations, same information can be present throughout the file in different formats. For example, ac-cented letters‘á’becomes‘a’,Brasilis renamed toBraziletc. After this processing, files are saved into a database. The database structure is relational i.e., divided into different tables like authors, keywords, paper information, affiliation etc. that are connected by relational keys. This greatly reduces the overall size of data and makes complex analysis using database queries faster.
Finally, the last part of filtering ispost-processingwhich mostly deals with the fine-tuning of entries. Although the data is organized into database, some noise is still likely to be present in forms of misspelled or synonymous entries. For example, same keyword can have several synonyms or can be spelled differently (specially chemical or compound names) using different punctuation marks. These synonymous entries are renamed to the standard name by searching into the database using script or software. As this fine-tuning method is quite exhaustive and it is quite impossible to make the dataset fully noise-free, the amount of filtering that are needed will depend on the actual dataset.
Data analysis approaches and methods. This part of the framework focuses on
In thefirstpart of analysis, our framework focuses on revealing vital information about the overall research domain like magnitude of research involved, distribution of research across countries and the number of authors involved. To do that, we applied basic frequency based analysis methods on the dataset by executing database queries over the relational entities. In
thesecondpart, we applied statistical analysis method on the dataset to understand how
differ-ent sub-domains of the research area have grown over the years. We focused on two statistics based methods—growth analysis and z-score. These methods are applied on individual author keywords that resemble the core topic of the paper. This in turns reveals the growth of different topics or keywords of the research area. These statistical methods are also applied similarly on grouping of the keywords into different categories that can reveal dynamics of sub-domains of research field. We have briefly described these two statistical methods and concept of
categorization below.
Growth analysistest aims to find relative expansion or growth of particular key-topics of
research fields denoted by individual keywords. It can detect sudden bursts or declines of key-word occurrence which often give an indication of major milestone, discovery or failure of a re-search topic. Growth analysis works by finding relative increment or decrement of frequency statistics of keywords over a certain period of time and expresses how much time, as a percent-age, the statistic under consideration had increased or decreased compared to its previous value. The equation is as follows:
Growth ¼
X
n 1i¼1
ðfiþ1 fiÞ fi
100% ð1Þ
Where fiis frequency of a particular keyword in the ithtime segment.
Z-score testis a standardized score that is used to find out the probability of occurrence of a
certain topic. At first, it draws a frequency distribution graph from given a set of values (e.g., frequency of keywords) and calculate the mean and standard deviation. Then z-score utilizes these basic parameters to translate the actual frequency distribution to a standard normal dis-tribution having mean and standard deviation of 0 and 1 respectively. The mathematical equa-tion is:
z¼X X
s ð2Þ
Where,Xis the value to translate,Xis the mean andsis the standard deviation. The resultant score provides a common framework to compare different set of values. Mathematically, z-score indicates the probability of occurrence. The greater the z-z-score the less the probability of occurrence. In our framework, a keyword having a high z-score (in terms of frequency) indi-cates that there is less probability of the occurrence of that keyword.
Categorizationprovides a way to group keywords that in turns represent a sub-domain
to more generic domain or category as one goes to upper levels. How generic the categorization will be actually depends on the volume of research domain. Also, there are different classifica-tion scheme available for different research domain, for example, ACM Computing Classifica-tion System [34] for computing field, MeSH classification system [35] for medical science, Mathematics Subject Classification (MSC) [36] etc. Choice of exact classification system also depends on the actual research context. We specifically discussed the classification scheme that we followed for our context later in this section.
Finally, in thethirdpart of analysis in our research framework, we focused on exploring the longitudinal relation and interaction between the topics and tried to visualize them graphically. The core idea is that, the topics of any research domain are related and to understand how the research trend changes, we need to look at those interrelations between the topics. For this analysis, we looked at which keywords have appeared together in a paper (co-occurrence) and made a graph based on it where nodes represent keywords and edges represent co-occurrence of keywords. The framework then applies social network measures on these keyword graphs to understand the relation between them and how they changes over the years. Also in this part, the framework analyzes the formation of keywords from a lexical perspective called Gene-word analysis and finally introduces the concept of visualization using knowledge map. These topics are described in short below.
Descriptive measures of keyword co-occurrence network
Average weighted degree. This is a measure of average connection strength between any
two nodes of a network [37]. For our keyword co-occurrence network, it means the average of frequency of all keyword pairs. For example, if A-B keyword pair co-occurred 10 times, B-C co-occurred 20 times and A-C co-occurred 0 times, then the average weighted degree of the network made by A, B and C will be 15. An increasing (over time) average weighted degree value for a keyword pair indicates that, on average, more research efforts have been given on the field(s) indicated by those keywords.
Network density. Network density is a measure of compactness [38]. A network becomes
more compact when there are more links between its member nodes. Similarly, it becomes sparse when most of the nodes do not have any link between them. Mathematically, network density quantifies the number of links between any two keyword pairs over all possible pairs. A greater graph density value indicates that more inter-disciplinary research has been carried out in this field. However, this only represents, whether or not, research is carried out on two keywords simultaneously.
Modularity. This indicates the strength of grouping in a network [38]. Many networks
show a grouping tendency. This means that network members are divided into different com-munities. A high modularity means nodes of the same community have more ties between them and nodes of different communities have fewer ties in between. Modularity index ranges between 0 and 1. A higher value means that grouping tendency is higher within keywords rep-resenting there are fewer occurrences between keywords of different groups and more co-occurrences between keywords of the same group.
Clustering co-efficient. This indicates the degree to which the nodes of a graph cluster
to-gether [38]. Stemming from the social network concept“all of my friends know each other”or
A, B and C will form a triangle when they are visualized in a co-occurrence network. A cluster-ing co-efficient with this perspective indicates the number of these triplets over all possible trip-lets representing the probability of research on any keyword pair or triplet.
Gene-word. A gene-word is one of the highly used words that either serves as a root of, or
helps to form, many other keywords through cross-references and hybridization (i.e., being uti-lized as a suffix or a prefix) [21]. By following the procedure as described by Wu el al. [21], we formulated and followed three principles to extract gene-words. First, a gene-word must have a frequency of appearance of over 100 times and be ranked amongst the top-100 keywords. Sec-ond, a gene-word must be related or cross-referenced to a minimum of 10 other core keywords, each with a frequency higher than 10 and, at an aggregate level, accounting for over 20% of all keyword frequencies. Third, a gene-word must represent a priority issue in the underlying research domain.
Data visualization using knowledge map. A knowledge map is a discipline-specific visual
representation of knowledge [19]. By considering the relative positions and density of nodes (i.e., keywords) in a network (i.e., keyword co-occurrence network), two dimensional knowl-edge maps can be created by using the VOSviewer which is a computer program primarily in-tended to be used for mapping, analyzing and exploring different types of networks (e.g., bibliometric network) [19]. In these maps, a shorter distance between any pair of keywords provides an indication of larger number of co-occurrences of those keywords (and vice versa). The font size of a keyword depends on the number and strength of its connections with the neighborhood keywords and their level of connectivity in the network. Each point in a map has a color, somewhere in between blue and red, that depends on the density of keywords at that point. The range of this color is from blue (of score 0) to green (of score 1) to red (of score 2). The larger the number of keywords in the neighborhood of a point and the higher the connec-tivity of the neighboring keywords, the closer the color of the point is to red. Conversely, the smaller the number of keywords in the neighborhood of a point and the lower the connectivity of the neighboring keywords, the closer the color of the point is to blue. These maps are partic-ularly important in analyzing the fundamental structure of knowledge that is represented by keywords. For a detailed description of technical implementation and algorithm used in devel-oping this software, see Van Eck and Waltman [39].
Applying framework on obesity research
In this section we illustrate how this research framework can be adapted and applied on a par-ticular research domain i.e., obesity. We also discuss specific considerations and modifications needed to apply the proposed framework on actual context.
Data source selection and knowledge generation. Our framework is applied on obesity
research dataset retrieved from Scopus which is an online bibliographic database by Elsevier. We chose it over other online sources (e.g., Google Scholar) because of its wide coverage of medical articles, consistent accuracy, filtering options and provision for downloading complete metadata as comma-separated file(s). Scopus contents are available via subscription and there is a limit on maximum records that can be downloaded at once. The contents were accessed and downloaded manually through the University of Sydney Library’s access to Scopus. The constraints for querying obesity related articles from Scopus web interface were set in this way—(i) consider only journal articles; (ii) published in English; (iii) published between year 1993 and 2013 inclusive; and (iv) the term“obesity”was included in the title or in author keyword list.
author name and affiliation, publication year, citation count, journal name, funding details and identification number. We developed custom data-mining software to automate most of the processing and filtering of the web-data as per the specification of the framework.
In the pre-processing step of filtering, we manually looked for formatting inconsistencies such as encoding error, incomplete or corrupted data in the downloaded raw files. Some entries were duplicated across multiple files. These files were then inspected by software to remove those duplicate entries. Articles missing essential information (e.g., author information, year or citation count) were also discarded at this stage. Then filtered data from multiple files were merged into a single file. The output file was then inspected to normalize the entries. Because the same information may be presented throughout the file in different spellings, we program-matically fixed these spelling inconsistencies. For example, accented letters were renamed (e.g.,
‘á’became‘a’andBrasilwas renamed toBrazil). After that, the data were transferred to a rela-tional database for efficient and complex analysis. In the post-processing step, we focused on normalizing keywords with different spellings often due to misspelling and compounding of multiple words but have the same meaning. Some keywords also have a standard name from the scientific community. For example, keywordscalcifediol,calcidiol,25-hydroxyvitamin D,
25-hydroxy vitamin Dand25(OH) vitamin Dall refers to the same chemical, but are lexico-graphically different from the software perspective. We manually checked for such synonyms in most frequent keywords. This list was given to software which automatically merged the da-tabase entries. Approximation algorithms were also used by the software to merge keywords that looked different due to leading or trailing punctuation marks (e.g.,hypertensionand
hyper-tension). Finally, we considered articles that were published between 1993 and 2012 in-clusive and for which we had information about the author-provided keywords. Articles pub-lished in 2013 were not considered as the indexing was not completed in Scopus at the time of dataset downloading. The final dataset consisted of 66,567 articles.
Data analysis of Obesity dataset. According to the framework, we applied analysis
meth-ods on dataset to understand the knowledge structure in obesity research. In the first part of analysis, we usedbasic statisticsof entities to provide a quick overview of obesity research. We explored issues such as how the research is expanding, which countries have been at the fore-front of the research, and the amount of scientific workforce that is engaged in obesity research. We looked at the publication count and authors’affiliation data to answer these questions.
In thesecond partof the analysis, we focused on exploring important obesity research top-ics using different statistical analyses of the author provided keywords. Each article had around 5–7 keywords and, to increase accuracy in detecting topics, we merged synonymous keywords during the data retrieval stage discussed above. In order to understand the importance or sig-nificance of keywords statistically, frequency, growth and z-score analysis were applied on indi-vidual obesity keywords according to the framework. We considered p<0.01 level for
z-score significance.
Furthermore, the keywords were grouped into logical categories such as“endocrine system diseases”and“cardiovascular diseases”etc. to understand the trends of obesity sub-domains which might be unnoticed in individual keyword scores. Categorization was undertaken fol-lowing the MeSH (Medical Subject Heading) database [35] provided by the U.S. National Li-brary of Medicine. The classification covers the field of medicine and related sciences. The keywords are classified logically in a hierarchical fashion from generic to more specific termi-nologies. For example, keywordgastroplastyis categorized asSurgery->digestive system
sur-gery->gastroplasty. The complete MeSH database is available to download with this
Finally, in thethird partof analysis we looked further into the relation between the key-words or topics according the measure described in the framework. It is obvious that many of the topics of obesity research will be highly related. Obesity is highly associated with different diseases, their causes, diagnostic methods and treatments are also closely related and are often researched together. Also, two obesity related keywords can individually occur more but to-gether they might appear less. The implication may be either that the topic represented by these keywords has not much prospect or the topic might not be studied widely and, hence, there are potential research opportunities. So it might be wise for researchers looking for trend-ing research topics to choose those keywords whose individual and combined co-occurrence score is high. Therefore, we applied network measures and statistical methods as described above to the co-occurrence network to explore how keywords expressing the different topics have occurred together in the articles’metadata and how this relation has changed over time. This part of the analysis also involves“Gene-word”analysis that is utilized to understand the syntactical relation of medical terminologies whereby a core keyword is derived into other key-words, making the topic divided into smaller branches. For example, a core keyword“lipid” had derived into different related keywords e.g.,dyslipidemia,hyperlipidemia,phospholipids,
plasma lipidsetc. Finally, according to the framework we generated the“knowledge map”, a vi-sual representation of keyword co-occurrences to help in understanding the structure of obesity topics.
Results
For cross-time analysis and ease of illustration, we divided our research dataset into four clus-ters or time slots based on the publication years of articles. These clusclus-ters are: 1993–1997 (clus-ter 1), 1998–2002 (cluster 2), 2003–2007(cluster 3) and 2008–2012 (cluster 4). All analyses were applied on these four clusters as well as overall 20 years data.
Basic statistics and network characteristics of the research dataset
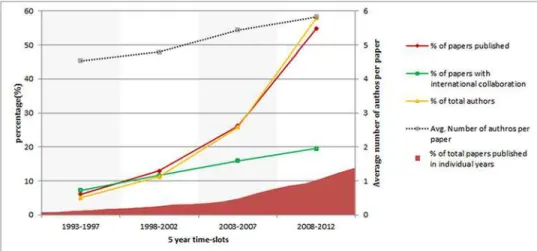
Number of publications. According to our research dataset, during the last 20 years
(1993–2012) 66,567 papers were published in the area of obesity research. The detailed break-down into time periods is shown inFig 2. It is evident that since 1993 there had been a continu-al increase in the number of published research papers in the obesity research. This indicates
Fig 2. Basic statistics of published papers (number of published paper, number of authors, international collaboration).
that obesity, as a research domain, has been gaining more importance to researchers over the time.
Number of authors. There has been a steady increase in the number of authors per article
over time. The statistics of the number of authors per paper in different time periods is illus-trated also inFig 2.
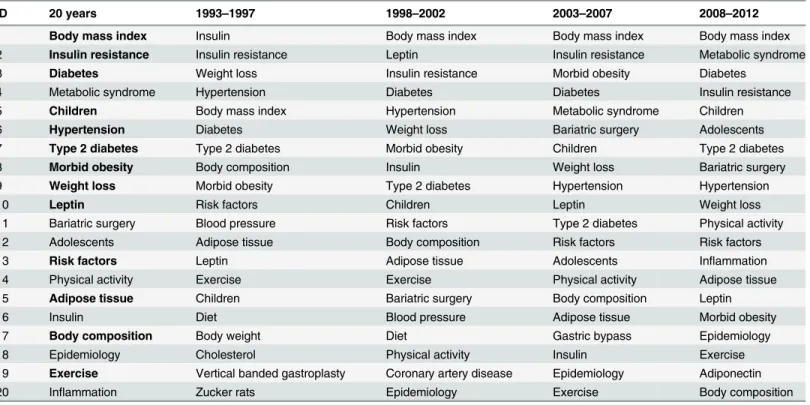
Frequently used keywords. In total, there were 327,879 keywords that appeared in 66,567
papers published over 20 years. On average, each paper had approximately 5 keywords. The top 20 most frequent author keywords in different time periods are given inTable 1.‘Body mass index’is the most frequent keyword over the data collection period. Of the top 20 key-words for the aggregated time (i.e., 20 years), 13 keykey-words appeared in the top 20 list for each of the four time periods.
International collaboration. There were 11,185 articles out of 66,567 (16.8%) that had
au-thors from more than one countries. The international collaboration statistics are shown also inFig 2along with other statistics. It reveals that there has been a sharp growth in the interna-tional collaboration of obesity research over time.
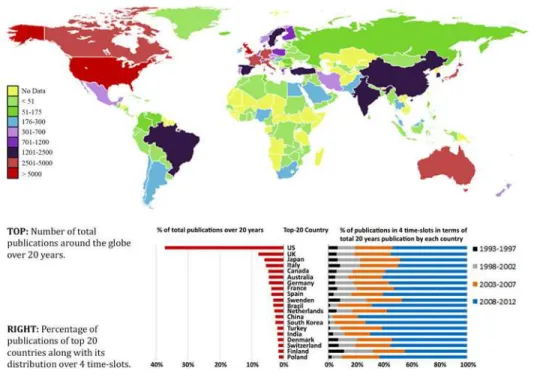
Top-countries publishing most papers. Authors from around 130 countries were
re-corded as publishing papers on the topic of obesity over the last 20 years. The publication sta-tistics for the top 20 countries in the 4 time-slots and the global distribution of country-wise publications are shown inFig 3. This graph shows that US had the largest numbers, followed by the UK, Japan, Italy, Canada, Australia, Germany and France.
Network statistics of keyword co-occurrence network. The network statistics of keyword
co-occurrence networks for four time periods are given inTable 2. Over time the number of
Table 1. Top-20 frequently occurring keywords.
ID 20 years 1993–1997 1998–2002 2003–2007 2008–2012
1 Body mass index Insulin Body mass index Body mass index Body mass index
2 Insulin resistance Insulin resistance Leptin Insulin resistance Metabolic syndrome
3 Diabetes Weight loss Insulin resistance Morbid obesity Diabetes
4 Metabolic syndrome Hypertension Diabetes Diabetes Insulin resistance
5 Children Body mass index Hypertension Metabolic syndrome Children
6 Hypertension Diabetes Weight loss Bariatric surgery Adolescents
7 Type 2 diabetes Type 2 diabetes Morbid obesity Children Type 2 diabetes
8 Morbid obesity Body composition Insulin Weight loss Bariatric surgery
9 Weight loss Morbid obesity Type 2 diabetes Hypertension Hypertension
10 Leptin Risk factors Children Leptin Weight loss
11 Bariatric surgery Blood pressure Risk factors Type 2 diabetes Physical activity
12 Adolescents Adipose tissue Body composition Risk factors Risk factors
13 Risk factors Leptin Adipose tissue Adolescents Inflammation
14 Physical activity Exercise Exercise Physical activity Adipose tissue
15 Adipose tissue Children Bariatric surgery Body composition Leptin
16 Insulin Diet Blood pressure Adipose tissue Morbid obesity
17 Body composition Body weight Diet Gastric bypass Epidemiology
18 Epidemiology Cholesterol Physical activity Insulin Exercise
19 Exercise Vertical banded gastroplasty Coronary artery disease Epidemiology Adiponectin
20 Inflammation Zucker rats Epidemiology Exercise Body composition
Bold keywords have appeared in all four time periods (could be in different numerical order) as well as in the top-20 list of the aggregated time (i.e., 20 years)
edges has increased steadily, which means that more keywords are appearing together in the more recent articles. This suggests that obesity research has been diversifying over time. Fur-thermore, it is evident that the values of the next two network measures (i.e., average weighted degree and network density) inTable 2show a continual increase over time. This indicates that more keywords or topics have appeared together in the obesity research and their frequencies have increased over time. The other two measures, modularity and average clustering co-effi-cient, have slightly decreased over time. It suggests that more keywords from different groups have been appearing together over time, indicating an increasing trend of inter-disciplinary re-search conducted within the obesity domain.
Trend in obesity knowledge structure
Emerging keywords in obesity research. UsingEq (1), we computed the growth of each
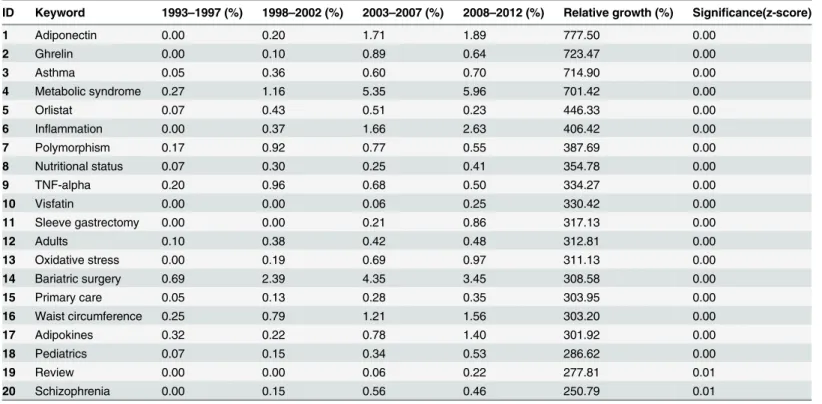
keyword. The top-20 keywords with the highest growth are shown inTable 3. UsingEq (2), we then computed z-score for the growth of each keyword in order to identify whether or not this growth is statistically significant. All of these 20 keywords (except the last two) showed statisti-cally significant growth. The top-20 keywords with the greatest decrease are shown inTable 4.
Fig 3. Global distribution of published paper in obesity research by countries.
doi:10.1371/journal.pone.0123537.g003
Table 2. Network statistics of the keyword co-occurrence networks.
Network Measures 1993–1997 1998–2002 2003–2007 2008–2012 Total in 20 years
Edges 7656 15542 24922 38345 58532
Average weighted degree 25.052 59.520 113.944 205.934 404.460
Network density 0.015 0.031 0.050 0.077 0.117
Modularity 0.325 0.320 0.323 0.276 0.289
Average clustering co-efficient 0.525 0.491 0.446 0.455 0.477
Table 3. Top-20 keywords that showed significant growth in appearance in 20 years.
ID Keyword 1993–1997 (%) 1998–2002 (%) 2003–2007 (%) 2008–2012 (%) Relative growth (%) Significance(z-score)
1 Adiponectin 0.00 0.20 1.71 1.89 777.50 0.00
2 Ghrelin 0.00 0.10 0.89 0.64 723.47 0.00
3 Asthma 0.05 0.36 0.60 0.70 714.90 0.00
4 Metabolic syndrome 0.27 1.16 5.35 5.96 701.42 0.00
5 Orlistat 0.07 0.43 0.51 0.23 446.33 0.00
6 Inflammation 0.00 0.37 1.66 2.63 406.42 0.00
7 Polymorphism 0.17 0.92 0.77 0.55 387.69 0.00
8 Nutritional status 0.07 0.30 0.25 0.41 354.78 0.00
9 TNF-alpha 0.20 0.96 0.68 0.50 334.27 0.00
10 Visfatin 0.00 0.00 0.06 0.25 330.42 0.00
11 Sleeve gastrectomy 0.00 0.00 0.21 0.86 317.13 0.00
12 Adults 0.10 0.38 0.42 0.48 312.81 0.00
13 Oxidative stress 0.00 0.19 0.69 0.97 311.13 0.00
14 Bariatric surgery 0.69 2.39 4.35 3.45 308.58 0.00
15 Primary care 0.05 0.13 0.28 0.35 303.95 0.00
16 Waist circumference 0.25 0.79 1.21 1.56 303.20 0.00
17 Adipokines 0.32 0.22 0.78 1.40 301.92 0.00
18 Pediatrics 0.07 0.15 0.34 0.53 286.62 0.00
19 Review 0.00 0.00 0.06 0.22 277.81 0.01
20 Schizophrenia 0.00 0.15 0.56 0.46 250.79 0.01
doi:10.1371/journal.pone.0123537.t003
Table 4. Top-20 keywords that showed significant decrease in appearance in 20 years.
ID Keyword 1993–1997 (%) 1998–2002 (%) 2003–2007 (%) 2008–2012 (%) Relative growth (%) Significance(z-score)
1 Norepinephrine 0.81 0.28 0.06 0.00 -243.00 0.02
2 C-Peptide 0.54 0.21 0.06 0.00 -231.16 0.03
3 Catecholamines 0.71 0.38 0.10 0.00 -219.31 0.04
4 mRNA 0.42 0.16 0.07 0.00 -218.74 0.04
5 Uncoupling protein 0.64 0.38 0.10 0.00 -214.61 0.05
6 Glucose Clamp Technique 0.32 0.12 0.06 0.00 -214.24 0.05
7 Plasma lipids 0.27 0.12 0.06 0.00 -207.64 0.05
8 Weight cycling 0.32 0.14 0.07 0.00 -202.85 0.06
9 Respiratory quotient 0.42 0.32 0.06 0.00 -202.82 0.06
10 Apolipoprotein A-I 0.10 0.00 0.07 0.00 -200.00 0.07
11 Bulimia 0.12 0.00 0.07 0.00 -200.00 0.07
12 Hernia 0.10 0.00 0.06 0.00 -200.00 0.07
13 Nutrient intake 0.22 0.00 0.06 0.00 -200.00 0.07
14 Corticosterone 0.29 0.19 0.08 0.00 -193.79 0.08
15 Cholelithiasis 0.22 0.13 0.06 0.00 -192.85 0.08
16 Paraventricular nucleus 0.29 0.16 0.09 0.00 -191.94 0.08
17 Prolactin 0.25 0.16 0.07 0.00 -191.52 0.08
18 Left ventricular mass 0.29 0.12 0.08 0.00 -191.43 0.08
19 Cardiac output 0.20 0.09 0.06 0.00 -190.98 0.08
20 Fluoxetine 0.32 0.14 0.09 0.00 -190.49 0.08
None of these 20 keywords showed a statistically significant decrease (at p<0.01 level) as
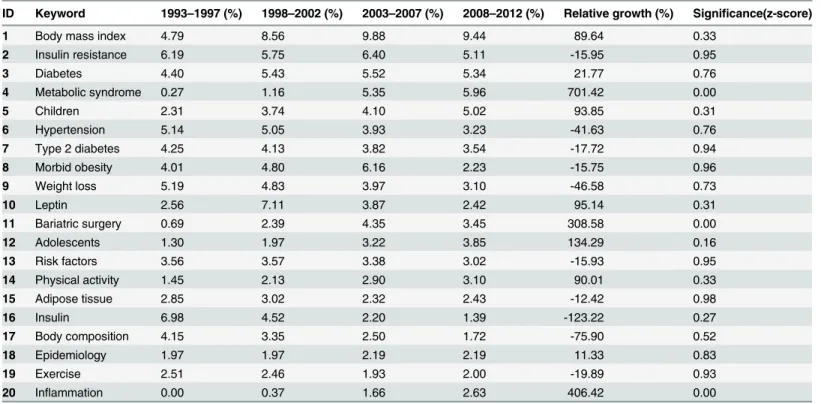
esti-mated by their z-score statistics. The growth of the top-20 keywords that appeared most fre-quently in the complete dataset is presented inTable 5. Interestingly, some of these keywords (e.g.,insulin resistance,hypertensionandtype 2 diabetes) showed negative growth. Only three of them (i.e.,metabolic syndrome,bariatric surgeryandinflammation) showed statistically sig-nificant and positive growth as revealed by their z-score statistics. Apart from that, most of top-20 keywords have shown a steady growth and relative positions of these top-ranked key-words did not change much over time indicating constant importance of these topics over time. These keywords (e.g.,diabetes,childrenandhypertension) loosely represent the broader category of different obesity domains but not a particular or specific topic. They are also from different domains and occupy considerable frequency in the overall spectrum, indicating the diversified nature of obesity research.
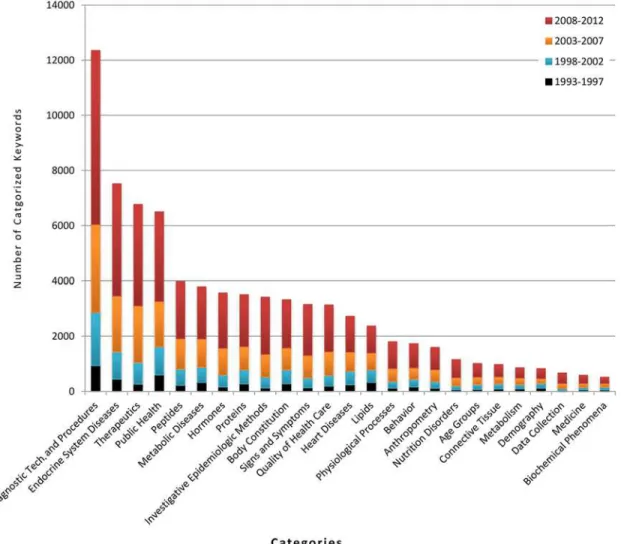
Keyword categorization. Using the MeSH database, the most frequent 650 keywords
were categorized into 40 major categories. These categorized keywords comprised about 50% of total keyword appearances for our research dataset. The relative increments of each category and subcategory are given inFig 4.
The category“Diagnostic techniques and procedures”includes keywords, such as, body mass index, blood pressure, weight and laparoscopy, and had the highest frequency (15% of overall frequency). This is followed byEndocrine System Diseases(includingdiabetes,polycystic ovary syndrome,gestational canceretc.) andTherapeutics(includingbariatric surgery,gastric bypass,
vertical banded gastroplastyetc.). Less frequently used categories cover areas such as various body compounds (e.g.,lipidsandhormones), diseases, ethnicity, health science etc. The result shows that there is an expected strong relation between obesity and endocrine system diseases (e.g., diabetes), with a substantial amount of research having been done in this field. Next to en-docrine system diseases—metabolic diseasesandheart diseaseshave also occupied significant
Table 5. Growth of frequently used keywords (second column oftable 1).
ID Keyword 1993–1997 (%) 1998–2002 (%) 2003–2007 (%) 2008–2012 (%) Relative growth (%) Significance(z-score)
1 Body mass index 4.79 8.56 9.88 9.44 89.64 0.33
2 Insulin resistance 6.19 5.75 6.40 5.11 -15.95 0.95
3 Diabetes 4.40 5.43 5.52 5.34 21.77 0.76
4 Metabolic syndrome 0.27 1.16 5.35 5.96 701.42 0.00
5 Children 2.31 3.74 4.10 5.02 93.85 0.31
6 Hypertension 5.14 5.05 3.93 3.23 -41.63 0.76
7 Type 2 diabetes 4.25 4.13 3.82 3.54 -17.72 0.94
8 Morbid obesity 4.01 4.80 6.16 2.23 -15.75 0.96
9 Weight loss 5.19 4.83 3.97 3.10 -46.58 0.73
10 Leptin 2.56 7.11 3.87 2.42 95.14 0.31
11 Bariatric surgery 0.69 2.39 4.35 3.45 308.58 0.00
12 Adolescents 1.30 1.97 3.22 3.85 134.29 0.16
13 Risk factors 3.56 3.57 3.38 3.02 -15.93 0.95
14 Physical activity 1.45 2.13 2.90 3.10 90.01 0.33
15 Adipose tissue 2.85 3.02 2.32 2.43 -12.42 0.98
16 Insulin 6.98 4.52 2.20 1.39 -123.22 0.27
17 Body composition 4.15 3.35 2.50 1.72 -75.90 0.52
18 Epidemiology 1.97 1.97 2.19 2.19 11.33 0.83
19 Exercise 2.51 2.46 1.93 2.00 -19.89 0.93
20 Inflammation 0.00 0.37 1.66 2.63 406.42 0.00
research attention. However, there has been relatively less work undertaken onnutrition disor-ders,age groupanddemographyrelated topic in conjunction with obesity. Further details of this categorization are presented inS2 Table.
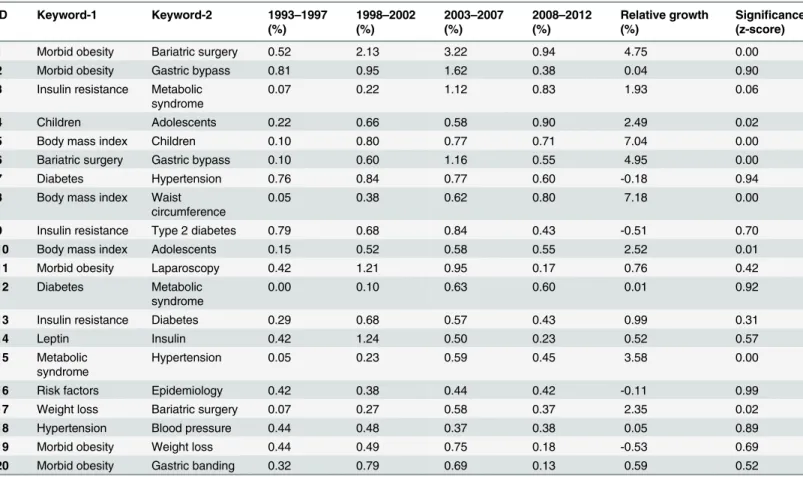
Co-occurrence and growth of keyword-pair. The top-20 keyword pairs that showed the
highest growth are presented inTable 6. All of these keyword pairs showed statistically signifi-cant growth as revealed by their corresponding z-score statistics. The growth of the most fre-quently appearing 20 keyword pairs in the complete dataset is illustrated inTable 7. According to their z-score statistics, there were 5 keyword pairs (i.e.,morbid obesityandbariatric surgery,
body mass indexandchildren,bariatric surgeryandgastric bypass,body mass indexandwaist circumference, andmetabolic syndromeandhypertension) that showed statistically significant growth at p<0.01 level.
Knowledge map of obesity research
Fig 5illustrates a two-dimensional knowledge map with major keywords as nodes for the com-plete time period (i.e., 1993–2012). It shows the frequency of keywords and their relative co-oc-currence with colors of different intensity to represent it as a heat map. Intense (red) color indicates the frequency of keywords. In the center of each intense color, there is a keyword
Fig 4. Frequency distribution of categorized and sub-categorized keywords over 4 time-slots and in overall 20 years.
which is labelled in larger font size. This indicates that these keywords appeared more frequent-ly and co-occurred with a higher number of other keywords in the literature. Keywords that have co-occurred more frequently are placed closer in the map. Similarly, we created knowl-edge maps with keywords as nodes for each of the four time slots (seeS1,S2,S3andS4figs).
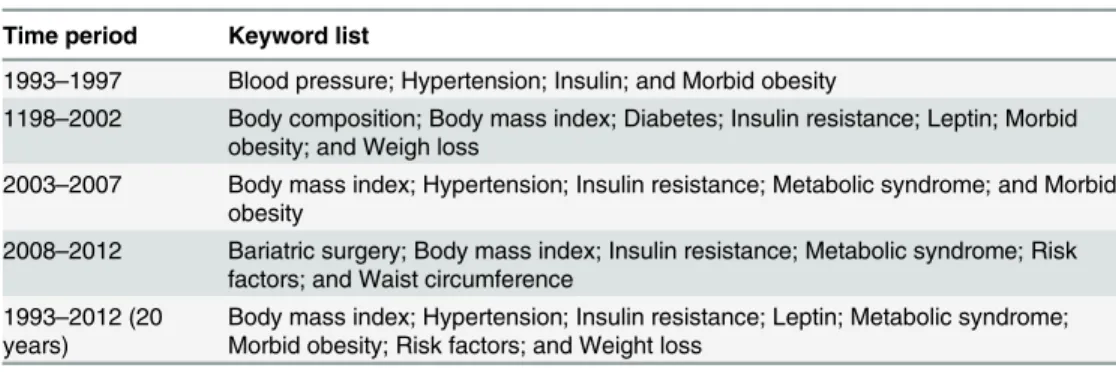
Table 8shows the keyword list that appeared with higher font size and red font color in these knowledge maps.
Gene-word analysis. We found 20 gene-words in our research dataset. Cross-reference
features and related keyword frequencies of these gene-words are reported inTable 9. Key-words that are derived from Obesity (e.g.,morbid obesity,diet-induced obesity,childhood obesi-tyetc.) had the highest average frequency (39.51). Gene-word“Insulin”also had a high
number of derived keywords that includesinsulin resistance,insulin sensitivity,insulin secretion
etc. and these derived keywords have the third highest (14.34) average frequency after diabetes (21.99). Gene-words that work as prefix (e.g., hyper and hypo as inhypertension,hypoxia) or suffix (e.g., ~tomy as ingastrectomy) also had a significantly high number of derived keywords. Also, this analysis suggests that though obesity research is a huge multifaceted field, it is still evolving from a few core or“buzz”words. Around 35% of all keyword occurrences result from derived keywords that are formed by only 20 gene-words ofTable 9.
Discussion
Research framework for exploring knowledge structure
Understanding trends and emerging topics of a research domain is indispensable for prospec-tive and current researchers, funding agencies, policy makers and other stakeholders. However,
Table 6. Top-20 keyword pairs that show highest growth over time.
ID Keyword-1 Keyword-2 1993–1997
(%)
1998–2002
(%)
2003–2007
(%)
2008–2012
(%)
Relative growth (%)
Significance (z-score)
1 Bariatric surgery Laparoscopy 0.02 0.53 0.65 0.16 20.02 0.00
2 Bariatric surgery Gastric banding 0.02 0.34 0.48 0.15 12.06 0.00
3 Childhood obesity Nutrition 0.00 0.00 0.01 0.07 10.96 0.00
4 Gastric banding Sleeve gastrectomy 0.00 0.00 0.01 0.06 10.00 0.00
5 Body mass index Adipokines 0.00 0.01 0.01 0.05 8.56 0.00
6 Metabolic syndrome
Cohort study 0.00 0.00 0.01 0.05 7.61 0.00
7 Leptin Body fat 0.02 0.22 0.03 0.02 7.50 0.00
8 Type 2 diabetes Gastric bypass 0.00 0.00 0.01 0.10 7.37 0.00
9 Leptin TNF-alpha 0.02 0.21 0.09 0.07 7.19 0.00
10 Body mass index Waist circumference 0.05 0.38 0.62 0.80 7.18 0.00
11 Complications Sleeve gastrectomy 0.00 0.00 0.01 0.05 7.13 0.00
12 Body mass index Children 0.10 0.80 0.77 0.71 7.04 0.00
13 Body mass index Leptin 0.05 0.41 0.20 0.13 6.81 0.00
14 Children Prevalence 0.02 0.16 0.05 0.10 6.74 0.00
15 Body mass index Cohort study 0.02 0.20 0.26 0.17 6.67 0.00
16 Diet Pregnancy 0.00 0.01 0.01 0.04 6.65 0.00
17 Leptin Body composition 0.02 0.20 0.06 0.04 6.61 0.00
18 Adolescents Waist circumference 0.00 0.01 0.02 0.12 5.70 0.00
19 Leptin Glucose 0.02 0.16 0.03 0.02 5.31 0.00
20 Type 2 diabetes Roux-en-Y gastric bypass
0.00 0.00 0.01 0.04 5.22 0.00
given the tremendous amount of available bibliographic information from online sites and ser-vices, it can be extremely challenging and cognitively difficult at the same time. The primary contribution of our proposed framework, as illustrated inFig 1, is that it can organize the scholarly information and reveal the underline longitudinal trend in a simple and intuitive way to a wide range of audiences. It gives user guidelines on downloading and organizing biblio-graphic data from online repositories and services. In doing so the proposed framework ad-dresses issues like data inconsistencies, ambiguity, duplication and segmentation that are
Table 7. Top-20 keyword pairs that have been found most time in 20 years and their growth.
ID Keyword-1 Keyword-2 1993–1997
(%)
1998–2002
(%)
2003–2007
(%)
2008–2012
(%)
Relative growth (%)
Significance (z-score)
1 Morbid obesity Bariatric surgery 0.52 2.13 3.22 0.94 4.75 0.00
2 Morbid obesity Gastric bypass 0.81 0.95 1.62 0.38 0.04 0.90
3 Insulin resistance Metabolic syndrome
0.07 0.22 1.12 0.83 1.93 0.06
4 Children Adolescents 0.22 0.66 0.58 0.90 2.49 0.02
5 Body mass index Children 0.10 0.80 0.77 0.71 7.04 0.00
6 Bariatric surgery Gastric bypass 0.10 0.60 1.16 0.55 4.95 0.00
7 Diabetes Hypertension 0.76 0.84 0.77 0.60 -0.18 0.94
8 Body mass index Waist circumference
0.05 0.38 0.62 0.80 7.18 0.00
9 Insulin resistance Type 2 diabetes 0.79 0.68 0.84 0.43 -0.51 0.70
10 Body mass index Adolescents 0.15 0.52 0.58 0.55 2.52 0.01
11 Morbid obesity Laparoscopy 0.42 1.21 0.95 0.17 0.76 0.42
12 Diabetes Metabolic
syndrome
0.00 0.10 0.63 0.60 0.01 0.92
13 Insulin resistance Diabetes 0.29 0.68 0.57 0.43 0.99 0.31
14 Leptin Insulin 0.42 1.24 0.50 0.23 0.52 0.57
15 Metabolic syndrome
Hypertension 0.05 0.23 0.59 0.45 3.58 0.00
16 Risk factors Epidemiology 0.42 0.38 0.44 0.42 -0.11 0.99
17 Weight loss Bariatric surgery 0.07 0.27 0.58 0.37 2.35 0.02
18 Hypertension Blood pressure 0.44 0.48 0.37 0.38 0.05 0.89
19 Morbid obesity Weight loss 0.44 0.49 0.75 0.18 -0.53 0.69
20 Morbid obesity Gastric banding 0.32 0.79 0.69 0.13 0.59 0.52
doi:10.1371/journal.pone.0123537.t007
Fig 5. Visualization of two-dimensional knowledge map of keywords for the complete dataset (i.e., 1993–2012).
commonly noticed in different bibliographic dataset. The filtering methods introduced in the framework can potentially be applied on different online datasets regardless of the context. Our proposed framework also contributes to the present literature by proposing a set of hierar-chical analysis methods that reveals generic to more specific trends of the research field. The first phase of analysis can find the research magnitude and growth which can potentially reveal the underlying factors driving the research workforce. These factors may dictate how the re-search problems are addressed by policy makers of different countries, funding and workforce distribution, and evolution of the research problem. The second phase of our analysis can be a powerful tool to observe micro level changes of different factors affecting the evolution of re-search. For instance, a particular research topic might pose a great potential to research com-munities and attract more workforce and sponsors (causing significant positive growth), or that topic might be exhausted since alternatives were found (causing significant negative
Table 8. Keywords that appeared with higher font size and red font color in different knowledge maps.
Time period Keyword list
1993–1997 Blood pressure; Hypertension; Insulin; and Morbid obesity
1198–2002 Body composition; Body mass index; Diabetes; Insulin resistance; Leptin; Morbid
obesity; and Weigh loss
2003–2007 Body mass index; Hypertension; Insulin resistance; Metabolic syndrome; and Morbid
obesity
2008–2012 Bariatric surgery; Body mass index; Insulin resistance; Metabolic syndrome; Risk
factors; and Waist circumference 1993–2012 (20
years)
Body mass index; Hypertension; Insulin resistance; Leptin; Metabolic syndrome; Morbid obesity; Risk factors; and Weight loss
doi:10.1371/journal.pone.0123537.t008
Table 9. Gene-words and their appearance statistics over time.
Gene-word Number of Derived Keywords
Frequency (1993–1997)
Frequency (1998–2002)
Frequency (2003–2007)
Frequency (2008–2012)
Frequency (20 years)
Average frequency of each keyword
Obesity 860 2164 4463 8541 18810 33978 39.51
Diabetes 324 412 971 1905 3837 7125 21.99
Insulin 567 912 1393 2297 3530 8132 14.34
Adipose 486 369 745 1627 3852 6593 13.57
Metabolism/ Metabolic
424 170 398 1486 3501 5555 13.1
Child 542 186 533 1374 3565 5658 10.44
Surgery 370 120 376 1082 2039 3617 9.78
Cardio 363 175 408 901 2000 3484 9.6
Weight 818 534 1139 2107 3939 7719 9.44
Hyper 644 562 1048 1637 2736 5983 9.29
Risk 567 252 623 1252 2474 4601 8.11
Lipid 372 174 433 771 1413 2791 7.5
Blood 290 208 383 566 1006 2163 7.47
Disease 725 230 580 1340 3153 5303 7.31
Diet 746 388 737 1316 2551 4992 6.69
Food 537 120 255 545 1395 2315 4.31
Hypo 417 132 321 471 768 1692 4.06
~tomy 343 64 116 304 909 1393 4.06
growth). In this case, over time statistics of keywords having highest or lowest growth as well as growth of frequent keywords can show how importance have been given or changed on this re-search topic. The categorization scheme introduced in this phase can be a guide to group key-words into logical categories. Applying the same set of analysis on these grouped keykey-words, macro level trends of research sub-domains can be explored. The third phase of analysis can help to understand how different research topics are interrelated and evolve (e.g., co-occur-rence test and knowledge map). It can also help to comprehend the knowledge structure of the domain through hybridization and cross-reference of few stem keywords (e.g., Gene-word analysis).
To summarize, we proposed a framework that can effectively organize online bibliographic data and perform a set of analysis to understand the knowledge structure of research evolution. Note that the analysis methods that are presented here are not unique. They are well estab-lished in statistical and computer science domain and have been implemented effectively on various contexts. However, combining them into a framework in a hierarchical fashion to sum-marize knowledge structure from online bibliographic data can arguably be considered as a unique and novel approach.
Observation from obesity research using the proposed research domain
The analysis of knowledge structure based on the last 20 years of scholarly articles on obesity can give a big picture of what has been done as well as suggest future research directions. The finding from the basic analysis shows increasing number of articles over years that indicate growing involvement of research community around the globe and funding to tackle the obesi-ty epidemic. In fact, publication numbers doubled in each of the five years periods (seeFig 2). However, this increment is not uniform across countries. The United States, for example, has outnumbered other countries in the number of research publications and has shown steady growth over time. The recent rise in obesity research publications in countries such as China, India and Turkey reflects the rising prevalence of obesity in many low and middle income countries which are undergoing economic and nutrition transition [30].The keyword set showing the highest growth (seeTable 3) normally points to specific obesi-ty research fields that have gained research interest in recent years. For example, two keywords with highest growth—adioponectinandghrelin—were discovered in 1995 [40] and 1996 [41] respectively. It then took several years to gain importance in the scientific community, resulting in a high growth. Also, some keywords (e.g.,AsthmaandAdults) had high growth or impor-tance because of changing socio-economic or epidemiological factors [31]. Finally, the keyword set showing lowest (i.e., negative) growth (seeTable 4) indicates that the research on that area is exhausted, or is not producing effective result, or some more effective keyword have replaced those topics. For example, this study found that keywordsorlistatandsibutramine (anti-obesity drug) both had a similar frequency (appeared 200 and 201 times respectively in the 20 years of publication data) but the first one had positive growth (446%) while the latter had neg-ative growth (-59%). This is analogous with the fact thatsibutramineis associated with in-creased cardiovascular events (and strokes) and has been withdrawn from most countries’
markets whileorlistatis considered a safer drug. A similar effect can be seen in the options for
bariatric surgery.
specific age groups (having keywordschildren,adolescents,elderly,adults,youthetc.) the num-ber is relatively low compared to other categories such as diagnostic procedures, metabolic dis-eases, body constitution etc. On the other hand keyword“Children”from age group category is the fifth highest occurring keyword, emphasizing the rising prevalence of childhood obesity and associated research.
The co-occurrence network of keywords shows a high clustering co-efficient (seeTable 2). In fact, the co-efficient score of 0.477 is higher than many real world networks. For example, the co-authorship network of a specific scientific domain, airline connection network and neu-ral network have clustering co-efficient score of 0.44, 0.34 and 0.15 respectively [42]. This indi-cates that the topics of obesity research are highly correlated and studied together. Also, if we look at highly co-occurred keywords (seeFig 4andTable 7) we can see several keywords (e.g.,
insulin resistance,metabolic syndrome,type 2 diabetesandhypertension) occur together more frequently in all possible pairs, between them forming a tightly knitted cluster in the co-occur-rence map. Furthermore, co-occurco-occur-rence test and the visualization show at which point different obesity sub-domains merge. For example, the keywordInsulin resistancebelongs to the diabe-tes related field andpolycystic ovary syndromeis one type of endocrine disorder of female. These two keywords from somewhat different domains co-occur significantly (seeTable 7and
Fig 4) in obesity research indicating that obesity is the common field where those two domains have merged.
Finally, we wish to discuss the quality and accuracy of results that we found by applying the proposed framework to the obesity domain. The dataset used in this research were collected from Scopus which is the most reliable and provides the largest database of peer-reviewed ma-terials. We only considered the journal articles and did not include 2013 publications as this list was still incomplete at the time of data collection. Some articles were not published in En-glish and we excluded those from our dataset as including those would incur complexity in translating foreign keywords into English. These excluded articles are very few compared to our dataset size, and their omission is unlikely to have a major impact on our results. With re-gard to the quality of keywords, we chose all the keywords that were provided by the actual au-thors of those articles and did not use any controlled vocabulary. On average, each article had around five author-provided keywords to describe itself. Furthermore, as noted in the Methods section, we filtered keywords extensively by merging synonymous keywords and correcting misspelled entities. In addition, the categorization scheme followed in this research was devel-oped by the US National Library of Medicine which is comprehensive and especially designed to index articles of medical science. Therefore, we can argue that, the dataset used in our frame-work is extensive, and relatively complete and accurate within an acceptable boundary. It is, however, possible that research articles in some of the social sciences may have been missed, due to the use of Scopus as a bibliographic database rather than, say, Google Scholar [43].
Conclusion
to effective organization of the huge amount of unfiltered data and have performed several analyses such as gene-word, co-occurrence tests on keywords and visual mapping. However, several important entities in our knowledge system still remain to be analyzed. For example, funding information in our dataset could be linked to other indicators (e.g., citation count) and keywords to find out how funding affects the overall quality of research and which sub-domains of obesity have higher proportions of different funding sources. Relating funding de-tails to affiliation can also suggest which institutions receiving major research grants. This may help aspiring researchers to select prominent institutions to pursue studies or to choose re-search topic wisely. For policy makers, it can also help them to understand the effect of funding and make effective future plans. Another approach can be to apply advanced social network and graph-theoretic approaches to the dataset, including performing cluster test, centrality tests on keywords and affiliation data. This may reveal otherwise hidden group structures of the keywords and show bridging topics between different research domains. Finally, author’s affiliation (institution, department, state, country etc.) can be analyzed and put on a geographi-cal map to give readers a visual cue as to which institutions or areas are at the forefront of par-ticular areas of obesity research and how they collaborate.
Supporting Information
S1 Fig. Visualization of two-dimensional knowledge map of keywords for 1993–1997.
(PNG)
S2 Fig. Visualization of two-dimensional knowledge map of keywords for 1998–2002.
(PNG)
S3 Fig. Visualization of two-dimensional knowledge map of keywords for 2003–2007.
(PNG)
S4 Fig. Visualization of two-dimensional knowledge map of keywords for 2008–2012.
(PNG)
S1 Table. Top-50 frequently appeared keywords in the research dataset.Keywords with grey
backgrounds appeared in all four time periods (could be in different numerical order). (DOCX)
S2 Table. Major keywords under each category.
(DOCX)
Acknowledgments
The authors like to express their sincere gratitude to Jeremy Cullis, faculty liaison librarian of University of Sydney medical science library for helping out in keyword categorization. Also the authors would like to thank Liang Wang who worked as a summer scholar with us and helped to download and filter the dataset.
Author Contributions
References
1. Speier C, Valacich JS, Vessey I. The influence of task interruption on individual decision making: An in-formation overload perspective. Decision Sciences. 1999; 30(2):337–60.
2. Jacsó P. Google Scholar: the pros and the cons. Online information review. 2005; 29(2):208–14.
3. Kulkarni AV, Aziz B, Shams I, Busse JW. Comparisons of citations in Web of Science, Scopus, and Google Scholar for articles published in general medical journals. JAMA. 2009; 302(10):1092–6. doi: 10.1001/jama.2009.1307PMID:19738094
4. Scopus [Internet]. Elsevier. 2014 [cited 11-11-2013]. Available from:http://www.scopus.com/.
5. Allen K, Lancour H, Daily J, Kent A, Lancour H, Daily J. Encyclopedia of library and information science: Taylor & Francis; 1973.
6. Mons B, van Haagen H, Chichester C, den Dunnen JT, van Ommen G, van Mulligen E, et al. The value of data. Nature genetics. 2011; 43(4):281–3. doi:10.1038/ng0411-281PMID:21445068
7. Hussain F, Lucas C, Ali M. Managing knowledge effectively. Journal of Knowledge Management Prac-tice. 2004;5(1: ).
8. Ding Y, Song M, Han J, Yu Q, Yan E, Lin L, et al. Entitymetrics: Measuring the impact of entities. PloS one. 2013; 8(8):e71416. doi:10.1371/journal.pone.0071416PMID:24009660
9. Song M, Han N-G, Kim Y-H, Ding Y, Chambers T. Discovering Implicit Entity Relation with the Gene-Citation-Gene Network. PloS one. 2013; 8(12):e84639. doi:10.1371/journal.pone.0084639PMID:
24358368
10. Abbasi A, Hossain L, Uddin S, Rasmussen KJR. Evolutionary dynamics of scientific collaboration net-works: multi-levels and cross-time analysis. Scientometrics. 2011; 89(2):687–710.
11. Uddin S, Hossain L, Rasmussen K. Network Effects on Scientific Collaborations. PloS one. 2013; 8(2): e57546. doi:10.1371/journal.pone.0057546PMID:23469021
12. Kalaitzidakis P, Mamuneas TP, Stengos T. Rankings of academic journals and institutions in econom-ics. Journal of the European Economic Association. 2003; 1(6):1346–66.
13. Snijders TA. Models for longitudinal network data. Models and methods in social network analysis. 2005; 1:215–47.
14. Uddin S, Piraveenan M, Khan A, Amiri B, editors. Conceptual quantification of the dynamicity of longitu-dinal social networks. Social Computing (SocialCom), 2013 International Conference on; 2013: IEEE. 15. Yu Q, Long C, Lv Y, Shao H, He P, Duan Z. Predicting Author Relationship in Medical
Co-Authorship Networks. PloS one. 2014; 9(7):e101214. doi:10.1371/journal.pone.0101214PMID:
24991920
16. Eom Y-H, Fortunato S. Characterizing and modeling citation dynamics. PloS one. 2011; 6(9):e24926. doi:10.1371/journal.pone.0024926PMID:21966387
17. Uddin S, Hossain L, Abbasi A, Rasmussen K. Trend and efficiency analysis of co-authorship network. Scientometrics. 2012; 90(2):687–99.
18. Kaur J, Hoang DT, Sun X, Possamai L, JafariAsbagh M, Patil S, et al. Scholarometer: A social frame-work for analyzing impact across disciplines. PloS one. 2012; 7(9):e43235. doi:10.1371/journal.pone. 0043235PMID:22984414
19. Su H-N, Lee P-C. Mapping knowledge structure by keyword co-occurrence: a first look at journal pa-pers in Technology Foresight. Scientometrics. 2010; 85(1):65–79.
20. Choi J, Yi S, Lee KC. Analysis of keyword networks in MIS research and implications for predicting knowledge evolution. Information & Management. 2011; 48(8):371–81.
21. Wu B, Xiao H, Dong X, Wang M, Xue L. Tourism knowledge domains: A keyword analysis. Asia Pacific Journal of Tourism Research. 2012; 17(4):355–80.
22. Guo H, Weingart S, Börner K. Mixed-indicators model for identifying emerging research areas. Sciento-metrics. 2011; 89(1):421–35.
23. Small H. Co-citation in the scientific literature: A new measure of the relationship between two docu-ments. Journal of the American Society for information Science. 1973; 24(4):265–9.
24. Zaïane OR, Chen J, Goebel R. Mining research communities in bibliographical data. Advances in web
mining and web usage analysis: Springer; 2009. p. 59–76.
25. Caballero B. The global epidemic of obesity: an overview. Epidemiologic reviews. 2007; 29(1):1–5.
26. WHO | Obesity and overweight: World Health Organization (WHO) Media centre; 2014 [cited 2014 04-06-2014]. World Health Organization Fact sheet N°311]. Available from:http://www.who.int/
27. Cummins S, Macintyre S. Food environments and obesity—neighbourhood or nation? International
journal of epidemiology. 2006; 35(1):100–4. PMID:16338945
28. Christakis NA, Fowler JH. The spread of obesity in a large social network over 32 years. New England journal of medicine. 2007; 357(4):370–9. PMID:17652652
29. Swinburn BA, Sacks G, Hall KD, McPherson K, Finegood DT, Moodie ML, et al. The global obesity pan-demic: shaped by global drivers and local environments. The Lancet. 2011; 378(9793):804–14. doi:10. 1016/S0140-6736(11)60813-1PMID:21872749
30. Popkin BM, Adair LS, Ng SW. Global nutrition transition and the pandemic of obesity in developing countries. Nutrition reviews. 2012; 70(1):3–21. doi:10.1111/j.1753-4887.2011.00456.xPMID: 22221213
31. Diseases TNIoDaDaK. Advances & Emerging Opportunities in Diabetes Research: A Strategic Plan-ning Report of the Diabetes Mellitus Interagency Coordinating Committee. 2011:140–65.
32. Organization WH. Population-based prevention strategies for childhood obesity: report of a WHO forum and technical meeting, Geneva, 15–17 December 2009. 2010.
33. Mölsä J, editor Effectiveness of rate-limiting in mitigating flooding DOS attacks. Communications, Inter-net, and Information Technology; 2004: Citeseer.
34. Burnett MM, Baker MJ. A classification system for visual programming languages. Journal of Visual Languages & Computing. 1994; 5(3):287–300.
35. Medicine USNLo. MeSH Browser—2014: United States National Library of Medicine; 2014 [cited 2014
16-10-2014]. doi:10.1155/2014/920985PMID:24977236
36. Iyer H, Giguere M. Towards designing an expert system to map mathematics classificatory structures. Knowledge Organization. 1995; 22(3–4):141–7.
37. Freeman LC. Centrality in social networks conceptual clarification. Social networks. 1979; 1(3):215–39.
38. Wasserman S. Social network analysis: Methods and applications: Cambridge university press; 1994. 39. Van Eck NJ, Waltman L. Software survey: VOSviewer, a computer program for bibliometric mapping.
Scientometrics. 2010; 84(2):523–38. PMID:20585380
40. Scherer PE, Williams S, Fogliano M, Baldini G, Lodish HF. A novel serum protein similar to C1q, pro-duced exclusively in adipocytes. Journal of Biological chemistry. 1995; 270(45):26746–9. PMID: 7592907
41. Howard AD, Feighner SD, Cully DF, Arena JP, Liberator PA, Rosenblum CI, et al. A receptor in pituitary and hypothalamus that functions in growth hormone release. Science. 1996; 273(5277):974–7. PMID: 8688086
42. Zhang Z, Zhang J. A big world inside small-world networks. PloS one. 2009; 4(5):e5686. doi:10.1371/ journal.pone.0005686PMID:19479083