Network Biology, 2012, 2(2):79-81
IAEES www.iaees.org Short Communication
Why excluding H
2O from metabolic networks?
DeWu Ding
Department of Mathematics and Computer Science, Chizhou College, Chizhou 247000, China E-mail: [email protected]
Received 14 February 2012; Accepted 22 March 2012; Published online 1 June 2012 IAEES
Abstract
This study provides a novel perspective on the reason for excluding H2O from metabolic networks when
complex network theory is used.
Keywords k-core; metabolic network; systems biology.
1 Introduction
With the assistance of complex network theory, cellular metabolism has been widely investigated in the last decade (Jeong et al., 2000; Ma and Zeng, 2003; Aittokallio and Schwikowski, 2006; Ma et al., 2007; Ding et
al., 2009a; Ding and Li, 2009b). Up to the present, the huge efforts afford us the ability to understand the structure and function of complex metabolism network, as well as some practical application (Aittokallio and Schwikowski, 2006; Ma et al., 2007; Ding and Li, 2009b).
Initially, in the seminal paper of Jeong et al. (2000), they considered the current metabolites (such as ATP,
ADP, or H2O which will be demonstrated) also as valid nodes. But, these metabolites do not participate in
biologically meaningful transformations generally, and they might bring some unrealistic biochemical pathways. Later, Ma and Zeng (2003) addressed the problem and reported their metabolic network models in which they exclude so-called current metabolites. After that, lots of study would exclude current metabolites
when complex network theory based methods are used in metabolic networks analysis (Zhao et al., 2006, 2007; Ma et al., 2007; Ding et al., 2009a; Ding and Li, 2009b).
However, the behavior seems to be a little arbitrary, and it clearly conflicts to the classical scale-free theory
(Barabasi and Albert, 1999), in which the high-connected hubs are critical (note: H2O is one of the top 10 hubs
for all 43 models, and is the top 1 IN/OUT hub for 35 of 43 models). Here, to address the arbitrary behavior,
we will present a study which benefit from an excellent paper in social network analysis, in which most influential nodes were identified by k-core instead of connections (Kitsak et al., 2010).
2 Method
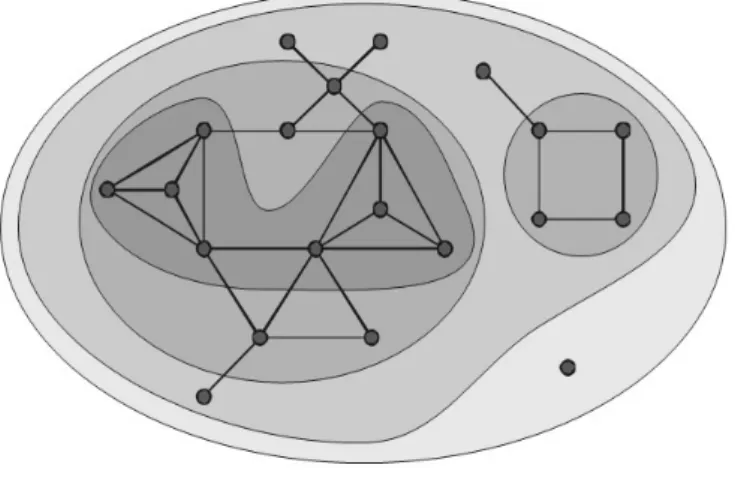
In a general way, a k-core of a graph is a maximal sub-graph of it, and every node in the sub-graph has k links,
at least (Fig. 1) (Carmi et al., 2007; Zhao et al., 2007). There are two basic properties of cores: 1) cores may be disconnected sub-graphs, and 2) cores are nested, an i-core is a subgraph of a j-core (i>j). The k-core of a
Network Biology, 2012, 2(2):79-81
IAEES www.iaees.org (http://www.nd.edu/~networks/resources/metabolic/index.html) for k-core analysis. With the strongly interest
in the top 1 hub, and to simplify the problem, only H2O will be demonstrated in the present study.
Fig. 1 0, 1, 2 and 3-core.
Our calculation showed that the maximum orders about core mainly are 4 or 5 for all of 43 metabolic
networks, and we find that H2O is absent in the core with high order in 33 metabolic network models (AA, AB,
AG, AP, BS, CA, CE, CJ, CL, CQ, CY, DR, EF, HI, HP, MB, MJ, ML, MT, NG, NM, PA, PF, PG, PH, PN, RC, RP, SC, ST, TH, TM and YP). The results, generally speaking, could support the idea that k-core analysis
is more helpful to identify the most influential nodes than connection analysis (76.7% accurate rate). And
meanwhile, it provides a novel perspective on the reason for excluding H2O (perhaps also with some other
current metabolites) from metabolic networks when complex network theory are used.
Acknowledgement
The authors would like to thank the anonymous reviewers for their valuable comments. Support for this work is provided by Natural Science Fund of China (21071024) and Natural Science Fund of Anhui Education Department (KJ2011A206).
References
Aittokallio T, Schwikowski B. 2006. Graph-based methods for analysing networks in cell biology. Brief Bioinformatics, 7: 243-255
Barabasi AL, Albert R. 1999. Emergence of scaling in random networks. Science, 286: 509-512
Batagelj V, Mrvar A. 1998. Pajek - program for large network analysis. Connections, 21: 47-57
Carmi S, Havlin S, Kirkpatrick S, et al. 2007. A model of Internet topology using k-shell decomposition.
Proceedings of the National Academy of Sciences of USA, 104: 11150-11154
Ding DW, Ding YR, Li LN, et al. 2009a. Structural and functional analysis of giant strong component of Bacillus thuringiensis metabolic network. Brazilian Journal of Microbiology, 40: 411-416
Ding DW, Li LN. 2009b. Why giant strong component is so important for metabolic networks? Rivista di Biologia / Biology Forum, 102: 12-16
Jeong H, Tombor B, Albert R, et al. 2000. The large-scale organization of metabolic networks. Nature, 407: 651-654
Network Biology, 2012, 2(2):79-81
IAEES www.iaees.org Physics, 6: 888-893
Ma HW, Zeng AP. 2003. Reconstruction of metabolic networks from genome data and analysis of their global
structure for various organisms. Bioinformatics, 19: 270-277
Ma HW, Sorokin A, Mazein A, et al. 2007. The Edinburgh human metabolic network reconstruction and its functional analysis. Molecular Systems Biology, 3: 135
Zhao J, Yu H, Luo JH, et al. 2006. Complex networks theory for analyzing metabolic networks. Chinese Science Bulletin 51: 1529-1537
Zhao J, Lin T, Yu H, et al. 2007. Bow-tie topological features of metabolic networks and the functional significance. Chinese Science Bulletin, 52: 47-54