Chimpanzee and Macaque Brains Measured by RNA-Seq
Augix Guohua Xu1,2., Liu He1,3., Zhongshan Li1,3., Ying Xu1
, Mingfeng Li1, Xing Fu1, Zheng Yan1, Yuan Yuan1, Corinna Menzel4, Na Li5, Mehmet Somel1,2, Hao Hu1,4, Wei Chen4,5*, Svante Pa¨a¨bo2, Philipp Khaitovich1,2*
1Partner Institute for Computational Biology, Shanghai, China,2Max-Planck-Institute for Evolutionary Anthropology, Leipzig, Germany,3Graduate School of the Chinese Academy of Sciences, Shanghai, China,4Max Planck Institute for Molecular Genetics, Berlin, Germany,5Max Delbru¨ck Centrum fu¨r Molekulare Medizin, Berlin Institute for Medical Systems Biology, Berlin-Buch, Germany
Abstract
Transcription is the first step connecting genetic information with an organism’s phenotype. While expression of annotated genes in the human brain has been characterized extensively, our knowledge about the scope and the conservation of transcripts located outside of the known genes’ boundaries is limited. Here, we use high-throughput transcriptome sequencing (RNA-Seq) to characterize the total non-ribosomal transcriptome of human, chimpanzee, and rhesus macaque brain. In all species, only 20–28% of non-ribosomal transcripts correspond to annotated exons and 20–23% to introns. By contrast, transcripts originating within intronic and intergenic repetitive sequences constitute 40–48% of the total brain transcriptome. Notably, some repeat families show elevated transcription. In non-repetitive intergenic regions, we identify and characterize 1,093 distinct regions highly expressed in the human brain. These regions are conserved at the RNA expression level across primates studied and at the DNA sequence level across mammals. A large proportion of these transcripts (20%) represents 39UTR extensions of known genes and may play roles in alternative microRNA-directed regulation. Finally, we show that while transcriptome divergence between species increases with evolutionary time, intergenic transcripts show more expression differences among species and exons show less. Our results show that many yet uncharacterized evolutionary conserved transcripts exist in the human brain. Some of these transcripts may play roles in transcriptional regulation and contribute to evolution of human-specific phenotypic traits.
Citation:Guohua Xu A, He L, Li Z, Xu Y, Li M, et al. (2010) Intergenic and Repeat Transcription in Human, Chimpanzee and Macaque Brains Measured by RNA-Seq. PLoS Comput Biol 6(7): e1000843. doi:10.1371/journal.pcbi.1000843
Editor:Adam Siepel, Cornell University, United States of America
ReceivedDecember 29, 2009;AcceptedMay 28, 2010;PublishedJuly 1, 2010
Copyright:ß2010 Guohua Xu et al. This is an open-access article distributed under the terms of the Creative Commons Attribution License, which permits unrestricted use, distribution, and reproduction in any medium, provided the original author and source are credited.
Funding:This study was supported by the Ministry of Science and Technology of the People’s Republic of China grant number 2007CB947004, the Chinese Academy of Sciences grant number KSCX2-YW-R-09, the Max Planck-Society, and the Bundesministerum fu¨r Bildung und Forschung. The funders had no role in study design, data collection and analysis, decision to publish, or preparation of the manuscript.
Competing Interests:The authors have declared that no competing interests exist.
* E-mail: [email protected] (WC); [email protected] (PK)
.These authors contributed equally to this work.
Introduction
Transcriptome studies conducted by various methodologies, such as conventional sequencing, tiling arrays, and, most recently, high-throughput sequencing, have consistently indicated that a large proportion of transcription takes place outside known gene boundaries (see [1,2] and references therein). Among human tissues, the brain transcriptome is one of the most complex [3,4]. Changes in expression of brain transcripts have been suggested to play an essential role in evolution of the human phenotype [5]. Indeed, expression of protein-coding genes differs greatly between humans and one of our closest relatives [6,7,8]. Furthermore, comprehensive analysis of approximately 1% of the human and chimpanzee brain transcriptomes using tiling arrays found multiple instances of differential expression outside annotated gene regions [9].
To systematically characterize the transcriptome in a particular brain region, cerebellar cortex, and identify its human-specific features, we performed high-throughput sequencing using the Illumina platform to analyze transcripts expressed in ten humans, four chimpanzees, and five rhesus macaques. All individuals are
adult males (Table S1). While most previous studies [1,2,4,10] have focused on the RNA fraction carrying poly(A) tails, we sequenced all transcripts present in the total RNA, excluding ribosomal RNA (rRNA) and depleting RNA transcripts shorter than 200 nucleotides (nt). Our experimental strategy is similar to the strategy used to characterize total transcriptome of HeLa cells [11,12], with the difference that these studies either focused on the 39-region of the transcript or sequenced mixture of polyA+ and polyA2transcripts with predominant part of polyA-enriches ones. To reduce within-species variation, we pooled the total RNA from brains of four to five individuals of the same species into one sample. To estimate technical as well as remaining within-species biological variation, we sequenced two independent human samples, each comprising total RNA from five individuals.
Results
Brain transcriptome composition
For each sample, we obtained an average of ,10,000,000
sequences. From these reads, we can map on average 51% to the corresponding reference genomes and annotated exon junctions (Table S2). Excluding the remaining sequences mapping to rRNA, we find that in humans 26% of the reads map to annotated exons and exon junctions, 2% - to mitochondrial genes, and less than 1% - to annotated non-coding RNA (ncRNA) (Figure 1A). Although these proportions are much greater than the corresponding genomic fractions (Figure 1A), they still represent less than a third of the total non-ribosomal human brain transcriptome. The remaining reads map within introns and intergenic regions (49% and 23% of the transcriptome, respectively). Such a distribution of transcriptome reads is not unique to humans, but shared among the three primate species studied (Figure S1).
Repeat transcription
Within intronic and intergenic regions, more than half of transcription originates from repetitive sequence elements, occu-pying in total,42% of the entire transcriptome (Figure 1A). This
proportion is substantially greater than that reported in the human brain using cap-selected transcript tags (,10%) [13]. For most of
the repeat families, the expression is proportional to the genome fraction occupied (Figure 1B). Still, for some, such as simple and low complexity repeats, as well as repeat families derived from functional ncRNA, such as snRNA, snpRNA and 7SK RNA, the expression level is higher than expected from the repeat family size alone in all three species studied (Figure S2).
More than 90% of repeats present in the human genome result from transposable element (TE) activity taking place over hundreds of millions of years. Estimating the transcriptional activity of different TE families, we find that the most recently expanded ones, the Alu elements, show elevated transcriptional activity per genomic fraction occupied by the family (Figure 1C). The effect is more obvious when normalizing by the genomic fraction occupied by repeat elements actually expressed in brain (Figure 1D). We find the same effect in the other two species (Figure S3), indicating that elevated expression of certain Alu elements in brain might be widespread among primates.
Intergenic transcription
Excluding repeats, intergenic regions contain 7% of all non-ribosomal human brain transcriptome sequences. These sequences are not distributed evenly, but concentrate within distinct regions (Figure 2A, 2B). Notably, the expression levels of such intergenic highly transcribed regions (igHTR) are comparable and, frequent-ly exceed the expression levels of annotated exons (Figure 2C). We used two parameters to define igHTR: the maximum spacing between two neighboring reads and the minimum number of mapped sequence reads within the genomic regions. For convenience, we set these parameters to 150 nt and 10 reads for most of the analysis. In the two human samples, we find 883 and 790 of such highly transcribed intergenic regions (igHTR) not overlapping with any annotated human transcripts (Materials and Methods, Table S3). Out of these igHTR, 580 (66% and 73% for the two human samples) overlap between the samples, with the majority of igHTR overlapping by more than 80% of their length (Figure S4), while less than 1% would be expected to overlap by chance (simulation, p,0.01). Further, for all 1,093 igHTR identified in at least one of the two human samples, the expression levels correlated well between the samples (Spearman correlation,
rho= 0.90, p,10215) (Figure S5), even when the corresponding region did not pass the igHTR definition cutoff in one of the samples. Using different igHTR definition cutoffs, we get principally the same results throughout the analysis (e.g. Figure S6). Finally, using human brain expressed sequence tag (EST) libraries, we find further support for 48% of 1,093 igHTR found in at least one of the two human samples, significantly more than expected by chance (simulation,p,0.01) (Figure 2B).
Similar to humans, we can identify igHTR in chimpanzee and rhesus macaque brain transcriptomes. Expression levels of individual igHTR show significant positive correlation between the two human samples and among the three species (Spearman correlation, rho.0.7, p,10215) (Figure S5). Thus, igHTR expression is largely conserved across the three primate species. To test whether igHTR are conserved at the DNA sequence level, we used PhastCons scores based on nucleotide conservation among 18 placental vertebrates genomes [14]. We find that igHTR show significantly greater conservation than randomly chosen intergenic regions or annotated genic regions including both exons and introns, but are less conserved than exons alone (Figure 2D). Further, DNA sequence conservation correlates positively with igHTR expression level (Figure S6). Thus, although both expression level and DNA sequence conservation do not prove functionality, it is likely that at least some of the identified igHTR represent functional transcripts.
Do igHTR represent extensions of known genes or independent coding and/or non-coding transcripts? The size distribution of transcription clusters shows two distinct peaks: a minor one at 45 nt and a major one at 500 nt (Figure 2E). Although 500 nt is longer than the average exon size in humans, the definition of igHTR boundaries by our method is not precise. When we define exons using the same criteria as igHTR, we find a similar length distribution for both exons and long igHTR (Figure 2E). More than half of all igHTR (65%) cluster within intergenic regions, with an average of four igHTR per group. Notably, the distances between igHTR within such clusters are similar to an average intron length (Figure 2F). Furthermore, within clusters, individual igHTR are expressed at similar levels, resembling expression of exons within a gene (Figure S7). Finally, 53 individual igHTR within clusters can be connected by at least one EST sequence, while less than 5, on average, are expected by chance (simulation,
p,0.01) (Figure 2G, S8). Thus, more than one half of igHTR Author Summary
appear to form long transcripts with exon-intron structure closely resembling annotated protein-coding genes.
With respect to the genomic location, igHTR tend to be situated within gene-rich regions, with 49% of human igHTR located within 10 kb of the nearest gene (simulation, p,0.01). Interestingly, 84% of these igHTR are close to the 39-end, rather than 59-end of the nearest gene (Figure 2B). Expression levels of these igHTR correlate positively with expression of the adjacent genes (Figure S9). Further, a total of 70 out of the 452 igHTR and igHTR clusters located within 10 kb from 39-end of the nearest gene in at least one human sample can be connected to the gene by 263 EST sequences (simulation p,0.01) (Figures 2G, S10). Notably, within these igHTR, we find a significant excess of conserved microRNA (miRNA) binding sites, one of the characteristic features of 39-UTRs of annotated transcripts (Figure S11). Thus, these igHTR may represent alternative or extended 39-UTR of annotated genes, potentially contributing to micro-RNA-directed expression regulation in the primate brain.
With respect to function, 251 genes that contain igHTR within 10 kb from the gene boundaries (204 of them are situated downstream for gene and may correspond to 39-UTR extensions) show significant enrichment among GO terms [15] and KEGG pathways [16] (Table S4, S5). Notably, these genes are mainly involved in neural functions, such as signal transduction, regulation of synaptic plasticity, learning, glutamate signaling pathway and long-term potentiation pathway, as well as two major pathways associated with lifespan duration: insulin signaling and mTOR signaling.
With respect to protein coding capacity, as determined by codon substitution frequencies (CSF) [17], igHTR scored lower than known protein coding genes, but still significantly higher than known non-coding RNAs (ncRNAs) (Wilcoxon test, p,2.2e-16) (Figure S12). Based on the chosen CSF cutoff, approximately 10% of all human igHTR may have protein-coding capacity. The remaining igHTR may represent as yet unannotated ncRNA. Supporting this suggestion, we find significant overlap (Figure S13,
Figure 1. Composition of human brain transcriptome and transcription of repetitive elements.(A) Outer circle: average proportions of
transcriptome sequence reads from the two human samples that map within annotated exons (green), introns (light orange), intronic repeats (orange), intergenic repeats (blue), intergenic regions (light blue), mitochondrial DNA (purple), and ncRNA (maroon). Middle circle: the proportions occupied by the corresponding regions in the human genome. Inner circle: the proportions of transcriptome sequence reads for polyadenylated human brain RNA (data adopted from [26]). (B) The transcriptional activity of repeat families located within introns (orange) or intergenic regions (blue) plotted against the total genomic length occupied by the family (see Materials and Methods for details). The labels indicate the repeat families with elevated expression levels. (C and D) The expression levels of twelve TE families normalized by the total genomic length of the corresponding family (C) and by the length corresponding to expressed repeats (D), plotted against their age rank. The expression level 95% confidence intervals are calculated by 1,000 bootstraps over sequence reads. The age rank and the corresponding confidence intervals are plotted according to [39]. Higher age rank corresponds to evolutionary younger TE families.
simulation, p,0.01) between igHTR and large intergenic non-coding RNA (lincRNA) identified in mouse and human cell lines [18,19], involving 19% of all identified human igHTR. An additional 10% of human igHTR overlap with ncRNA predictions based on secondary structure and folding potential score determined by EvoFold [20] (Figure S14, simulation, p,0.01) (Figure 2B).
Transcription divergence
To determine the extent of expression divergence between human, chimpanzee, and rhesus macaque brain transcriptomes, we first tested whether expression of known protein coding genes could separate species according to their phylogenetic relationship. Based on expression of 13,832 genes detected in at least two out of four samples in our dataset, we found that in agreement with
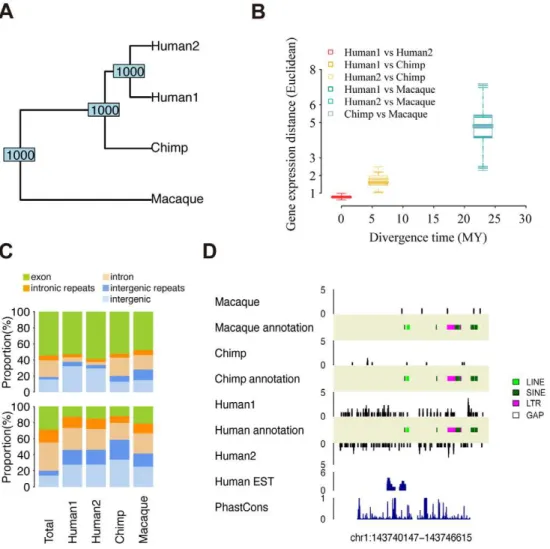
Figure 2. Characteristics of intergenic transcripts.(A) Examples of igHTR. The black track shows sequence reads density (in counts) in the four
samples studied. The blue tracks show human EST density and PhastCon scores. (B) igHTR categories. The inner circle shows the proportion of igHTR with (red) or without (blue) EST support. The outer circle shows proportions of igHTR with protein-coding potential (green), supported by lincRNA (blue) or EvoFold (light blue) ncRNA predictions, adjacent to gene’s 59-UTR (light orange) or 39-UTR (orange), and uncharacterized igHTR (grey) among EST-supported and non-supported igHTR. (C) Expression levels within intergenic regions (blue), genic regions including both exons and introns (light orange), exons (green), and igHTR (red). (D) Sequence conservation of nucleotides in human exons, genic regions, intergenic regions, and igHTR (all colors as on the panel (C)) based on phastCon scores among 18 placental vertebrates genomes. PhastCon scores close to 1 indicate high conservation. The heights of the bars show mean value and error bars show 95% confident intervals based on sampling of the same number of nucleotides as located within igHTR from the corresponding genomic regions 1,000 times. For igHTR, the values are based on all nucleotides located within them. (E) Size distributions of igHTR in the two human samples (red - Human1, blue - Human2), annotated human exons (grey), and exonic HTR (black) (F) Distributions of genomic distances between nearest pairs of igHTR (red – Human1, blue – Human2), annotated exons (black), and simulated randomly distributed igHTR (grey). The dashed line shows 10 kb distance. (G) Examples of splicing within igHTR clusters (red) and between annotated genes (blue) and downstream igHTR supported by EST (green).
previously reported results based on microarray data, gene expression differs significantly among the three species (Figure 3A, S15). Furthermore, expression divergence among species increases with the time of species divergence, independent of normalization procedures and distance measures used (Mate-rials and Methods, Figures 3B, S16).
Next, we identified genes with species-specific expression using a Bioconductor package for differential expression analysis of digital gene expression data, ‘‘edgeR’’ [21]. Following this methodology, we first used the variation between two human samples to build a null model of changes in read counts across all loci studied and then used this null model to identify expression differences between species. Further, we used Benjamini-Hochberg multiple testing correction to set the false discovery rate below 5% (Materials and Methods). Following this procedure, we identified 118 genes with human-specific expression in both human samples (Table S6). To test whether these expression differences are reproducible, we compared them with published expression
differences measured between three human and three chimpanzee cerebellar samples using microarrays [22]. For 34 genes present in both datasets (Materials and Methods), we find significant positive correlation of human-chimpanzee expression differences (Pearson correlationr= 0.68, p= 0.0001; Spearman correlation rho= 0.55,
p= 0.0008).
Functional analysis of the 118 genes with human-specific expression did not yield significant results, but showed an enrichment trend among genes involved in transcriptional regulation (Table S4). This finding is consistent with previous studies, suggesting transcriptional regulation may play an important role in human brain evolution [23,24,25]. Further, in terms of amino acid divergence between humans and chimpanzees or between humans and mice, as well as promoter sequence divergence, 118 genes showed tendency for greater conservation than all genes expressed in at least one of our four samples (Table S7). Thus, observed gene expression changes are not likely to reflect relaxation of selective constraint.
Figure 3. Transcription divergences.(A) UPGMA tree based on the expression level of 13,832 genes in 4 sample pools. The numbers at the nodes
indicate node stability in 1,000 bootstraps over genes. (B) The gene expression divergence between sample pairs plotted against the species divergence time. The box plot represents variation of the divergence estimated from 1,000 bootstraps over genes (same set of genes as (A), see Materials and Methods). (C) The upper panels show genomic annotation of nucleotides covered by at least one sequence read within all HTR identified in at least one sample (Total) and HTR with species-specific expression. Genomic locations of species-specific HTR are listed in Table S8. The lower panels show genomic annotation of nucleotides covered by at least one sequence read within all genomic windows (Total) and genomic windows with species-specific expression. Locations of species-specific genomic windows are listed in Table S10. The colors represent: exons (green), intronic repeats (orange), introns (light orange), intergenic repeats (blue), and intergenic regions (light blue). (D) An example of a genomic window with human-specific expression.
In addition to gene expression differences, we compared the extent of expression divergence among the three species for different types of transcripts: exonic, intronic, intergenic, and repeats. To compare expression divergence of these different transcript types on the same basis, we used two approaches. In the first approach, in addition to igHTR, we identified all other highly transcribed regions (HTR) present in human, chimpan-zee, and rhesus macaque brain transcriptomes and compared their expression levels across species. From a total of 16,159 HTR found among the three species, 10,654 (65.9%) corre-spond to exons, 904 (5.6%) to introns, 528 (3.3%) to intergenic regions, 3,007 (18.6%) and 1,066 (6.6%) to intronic and intergenic repeats, respectively. To identify the HTR with species-specific expression, we applied the methodology de-scribed above, based on the edgeR package. Following this approach, 24 HTR (11% in all species-specific HTR) can be classified as human-specific, 32 (15%) as chimpanzee-specific, and 159 (74%) as specific to rhesus macaque in the three species comparison (Table S8). Intriguingly, for humans, we find a slight but significant excess of HTR with species-specific expression within intergenic regions (one-sided binomial test,
p,2.2e-16) (Figures 3C, S17, Table S9).
In the second approach, we identified regions showing extreme species-specific divergence by comparing transcriptome coverage in a sliding window over the entire human-chimpanzee-macaque (HCM) genome alignment (Figure 3D). Windows were defined to contain the same total number of sequence reads (N= 50) summing over all three species. Using the described above approach to identify species-specific genomic windows (GW) (Table S10), we find a strong excess of intergenic region representation in all three species (one-sided binomial test,
p,2.2e-16) (Figure 3C lower bars, Figure S18, Table S11). We obtain the same result using both species-specific and human-based annotations (Figure S18, Table S11). Further, the result did not depend on recent duplication events or alignment problems, as determined by allowing multiple-location mapping, use of alternative reference species in alignment construction and visual inspection of all species-specific widows. Thus, in the three primate species studied, genomic regions with extreme species-specific expression patterns are more than twice as likely to originate within intergenic regions than expected by chance (Table S11).
Discussion
Our study, although based on a few samples, uncovers basic features of the brain transcriptome that are shared among the three primate species and identifies the most divergent expression patterns specific to the human brain. Among shared features, we find that exons alone contribute approximately a quarter of the total non-ribosomal transcriptome, while exons and introns together contribute three-quarters. Previously published human brain transcriptome sequencing data based on polyadenylated transcripts contains a higher proportion of exonic and a lower proportion of intronic transcription (54% and 24%, respectively, Figure 1A) [26]. Thus, many of the intronic transcripts detected in our study may represent unprocessed non-polyadenylated precur-sors of mature mRNA. Non-repetitive intergenic transcripts, however, occupy similar proportions (7%) in both poly(A)-enriched and the total human brain transcriptomes.
While 42% of the human brain transcriptome originate within repetitive elements, most of the repeat expression is directly proportional to the occupied genomic length and, therefore, might represent ‘‘transcriptional background’’. Some of the repeat
families, however, are transcribed above the background level. While some of these families, such as snRNAs, snpRNAs and 7SK RNA that derived from functional ncRNA might be actively transcribed, high expression of simple and low complexity repeats is unusual. Notably, analysis of cap-selected mouse and human transcript tags across 12 tissues shows that simple and low complexity repeats have distinct tissue-specific expression profiles and are highly expressed in brain in both species [13]. Similarly, elevated expression of Alu elements from the most recently expanded subfamilies is unusual and indicates that these elements might be transcribed actively.
Besides repeats, intergenic transcription is highly non-uniform, containing distinct highly transcribed regions conserved between species both in terms of their expression and DNA sequence. A substantial proportion of these regions (23%) may represent alternative or extended 39-UTR of known genes, enriched in conserved microRNA binding sites. In mouse brain, 39-UTR extensions containing miRNA binding sites were found in microRNA-Argonaute complexes, indicating their role in miRNA-directed expression regulation [27]. Further, changes in 39-UTR length have been shown to play a role in miRNA regulation of cell proliferation and mouse embryonic develop-ment [28,29]. Thus, identified novel 39-UTR may play an important role in microRNA-directed regulation in the primate brain.
Another substantial proportion of identified intergenic tran-scripts (29%) overlap recently identified lincRNA and ncRNA predicted by EvoFold. Since our analysis is limited to highly expressed transcripts, most of them are expressed at higher levels than protein-coding genes. This indicates that at least some of these intergenic transcripts represent novel ncRNA functioning in the primate brain. We have to note, however, that these transcripts represent a small fraction of all identified lincRNA and ncRNA predicted by EvoFold: 1.7% and 0.3%, respectively. Thus, the vast majority of lincRNA and ncRNA predicted by EvoFold are not expressed in human cerebellum, or are expressed at levels below our igHTR detection threshold.
With respect to evolutionary features, the extent of expression divergence increases with greater species’ phylogenetic divergence time. In our study, we do not observe an excess of expression divergence on the human lineage, previously reported in another brain region, cerebral cortex [6,7]. Thus, in different brain regions, the transcriptome may have evolved at different rates during human evolution. It has to be noted, however, that our study does not provide intra-species variation estimates, and cannot be directly compared with the previous studies. Further work is needed to investigate this question. Notably, we find that the most extreme human-specific expression patterns, as well as extreme expression patterns characteristic for the other two primate species, show greater than expected enrichment within intergenic regions. Thus, further characterization of intergenic transcription will be necessary for understanding regulatory evolution in primates and identification of the molecular mechanisms underlying the evolution of the human-specific phenotype.
Materials and Methods
Ethics statement
Sample preparation and sequencing
We dissected postmortem cerebellar cortex samples from ten male humans (8–54 years old), four male chimpanzees (8–40 years old), and five male rhesus macaques (4–20 years old). All human
postmortem brain tissue samples were obtained from the NICHD Brain and Tissue Bank for Developmental Disorders (NICHDBB) (Baltimore, MD, USA). Forensic pathologists at the NICHDBB defined all subjects as normal controls. No subjects with prolonged agonal state were used. Chimpanzee samples were obtained from the Yerkes Primate Center (Atlanta, GA, USA), the Anthropo-logical Institute & Museum of the University of Zu¨rich-Irchel, (Zu¨rich, Switzerland), and from the Biomedical Primate Research Centre (Rijswijk, Netherlands). The rhesus macaque samples were obtained from the SuZhou Experimental Animal Center (SuZhou, China). All samples contained RNA of comparable and high quality (Table S1).
Total RNA was extracted from dissections by Trizol reagent (Invitrogen, Carlsbad, CA) and treated for 30 min at 37uC with RNase free DNase I (Ambion, Austin, TX). RNA was purified with the RNeasy MinElute Kit according to the manufacturer’s instructions (Qiagen, Valencia, CA). This procedure depletes RNA molecules with length shorter than 200 nt. Resulting RNA samples from five human, five macaque, or four chimpanzee individuals was mixed in equal proportions within species, resulting in two human, one chimpanzee, and one rhesus macaque pooled samples (Table S1). 10ug RNA was treated with two rounds of RiboMinus kit (Invitrogen) to remove most of the Ribosome RNA. The cDNA libraries were prepared starting from 2ug of rRNA-Reduced total RNA per sample and using random hexamer primers (Invitrogen, Cat. No. 48190-011). It has to be noted that the resulting double-stranded cDNA fragments do not preserve information about the strand specificity of the original transcript. The Illumina sequencing libraries were prepared according to the single-end sample preparation protocol (http:// www.illumina.com). The libraries were sequenced using the 1G Illumina Genome Analyzer. The sequencing products were the single-end 36 nucleotides (nt) long sequence reads. All sequence data including quality scores is deposited into the NCBI’s Short Read Archive, accession number SRA011534.
Read mapping and annotation
All raw sequencing reads were mapped to the corresponding reference genomes (hg18, panTro2, and rheMac2), allowing a maximum of four mismatches, using Short Oligonucleotide Alignment Program (SOAP, version 1) [30]. Using a smaller number (two or three) of allowed maximum mismatches did not affect the analysis (data not shown). Only the reads that mapped uniquely were included in the analysis, unless indicated otherwise. For the three species, all uniquely mapped reads were annotated based on the species-specific gene annotation from Ensembl (release 50) provided by BioMart (http://www.biomart.org/) [31] or based on the human annotation (see below). Throughout the analysis, exons and intron categories are based on all exons, both coding and non-coding, of protein-coding genes according to Ensembl (release 50) annotation. Reads mapping to rRNA (both uniquely and allowing multiple mapping) were excluded from the analysis. To ensure complete and unbiased exclusion of rRNA sequences, for each species we mapped reads to all rRNA sequences annotated in the three species. In each sample, 36–39% of all mapped reads mapped to rRNA. For uniquely mapped reads, 1–2% mapped to rRNA. The repeat annotation was taken from the RepeatMasker table provided by the UCSC table browser (http://genome.ucsc.edu/) [32]. The genomes were separated into 7 categories: exons, intronic repeats, introns,
intergenic repeats, mitochondrial chromosome, non-coding RNA, and intergenic regions. This order is further used as a category hierarchy for sequence reads annotation, from the highest to the lowest level, respectively. A sequence read was assigned to a category if at least one nucleotide of the read mapped to the category’s genomic region according to the above hierarchy and independent of the strand orientation, as strand information was lost during sequence library preparation. Further, sequence reads mapped to exon junctions were assigned to exons. Although our approach biases annotation to the categories high in the hierarchy, such as repetitive elements, this effect is not large. Specifically, we find that in humans only 7% of all sequence reads we assign to repeats do not map completely within repetitive elements and, therefore, can be assigned to other categories. Further, for only 2% of all sequence reads we assign to repeats, less than half of a read sequence is contained within repetitive elements. The distribution of mapped reads shown in (Figure 1A) and (Figure S1A) is based on counting the number of sequence reads mapped to both unique and multiple (#100 locations) positions in the genome. We obtain similar results considering only sequence reads mapped to unique genomic positions (Figure S1B).
Repeat transcription
We estimated the expression levels of repeat families based on uniquely mapped sequences. Including sequence reads mapped to multiple positions increased the total number of reads mapped to repeat regions by approximately 10%, but did not affect the results qualitatively. To normalize the expression by the lengths of unique DNA in each repeat family, we calculated the numbers of potential positions in repeat elements that can be mapped uniquely, then we summed up these numbers of all the elements and that of the expressed elements separately. This length calculation was done for both the analysis of repeat expression level vs.repeat length (Figure 1B) and the analysis of repeat transcriptional activityvs.
repeat age (Figure 1C, 1D).
Three-species genome alignment
Pair-wise genome alignments of human-chimpanzee and human-macaque were downloaded from UCSC genome browser (genome versions: hg18, panTro2 and rheMac2). Based on these alignments, Human-Chimpanzee-Macaque (HCM) three-way alignment was constructed Using Multiz software package [33]. The human genome was selected as reference during the construction unless indicated otherwise. The regions in the HCM alignment were also considered as 3 species consensus regions (HCM consensus regions).
HTR definition and analysis
among the samples by random sub-sampling of 1,500,000 mapped sequences for each sample. This number was based on the read number in the sample with the lowest coverage. HTR were aligned across species based on HCM alignment. HTR genomic boundaries were defined based on the 59-most and 39-most coordinates found among the four samples.
To calculate the expression correlation of individual igHTR in the three species, we unified igHTR identified in the four samples. We mapped igHTR identified in chimpanzee and macaque onto the human genome using the LiftOver tool from UCSC genome browser (http://genome.ucsc.edu/cgi-bin/hgLiftOver).
All simulation tests were done by randomly selecting the same number of genomic regions with the same length distribution as the actual igHTR 1,000 times. The sample genomic regions differed depending on the tested variable and are described specifically in each case (see Supplementary Information for details).
Sequence conservation analysis was based on the sequence conservation measures provided for each nucleotide position by the PhastCons conservation scores for 18-way multiple alignments between the human genome and 17 other placental mammalian species [34]. Conservation was determined for nucleotides within human igHTR, as well as for the entire human intergenic regions, genic regions (including both exons intron), and exons by randomly sampling the same number of nucleotides from these regions 1,000 times.
We tested protein-coding potential of human igHTR by determining the maximum CSF (codon substitution frequency) score observed across the entire genomic locus, following [17]. Briefly, we used a scoring matrix built from human-mouse alignment and computed the CSF scores across sliding windows of 90 nucleotides. We then scanned all 6 possible reading frames in each window, since we have the strand information. After computing a score for each window, we defined the ‘‘max CSF score’’ for a cluster to the maximum observed score across the region. Then, we chose CSF cutoff that discriminates well between coding and non-coding regions based on the CSF distributions of known protein-coding and non-coding regions. We chose cutoff at CSF = 2, which gives specificity (97.9%) and sensitivity (93.2%) (Figure S12). Finally, we applied this cutoff to the CSF distributions of igHTR to estimate the proportion of potential protein-coding regions.
For overlap between lincRNA (large intergenic non-coding RNA) and igHTR, we used published lincRNA identified in mouse [18] and human [19]. We downloaded the lincRNA tables provided by these two papers and identified the human orthologs of the mouse lincRNA as described in [19]. Next, we combined the human lincRNA and the human orthologs with mouse lincRNA for the analysis.
For overlap between EvoFold predictions and igHTR, we download a total of 47,510 predicted RNA from UCSC browser [20]. As many of these predictions are short (,20 nt), we assume
that they originate from a longer precursor and extend the predicted locations by 1 kb at both ends for the analysis.
Transcription divergence
Among all annotated human protein-coding genes (Ensembl release 50), 18,391 can be matched between the three species based on HCM alignment. Out of these genes, 13,832 expressed in at least two of the four samples were used in this analysis. The gene expression levels were calculated as the number of sequence reads uniquely mapped in exons, normalized by the gene’s exonic region length. Reads mapped to exon junctions were not counted here, because some exon boundaries might not been matched accurately
between genomes based on HCM genome alignment. The expression levels were normalized across samples using quantile normalization (normalize.quantiles function in R) [35]. Diver-gence between samples was estimated based on Euclidean distance, Manhattan distance, and 1-rho (Spearman correlation coefficient) (Figures S15, S16). Further, to remove influence of expression level on divergence calculation, we Z-transformed expression levels before the expression distance calculation: the expression level of each gene was set to mean = 0 and standard deviation = 1 across the four samples (Figures S15, S16). The UPGMA trees (Figure S15) were constructed using R-package ape and phangorn.
Species-specific expression
To identify species-specific expression of genes, HTR, or GW, we used a Bioconductor package for differential expression analysis of digital gene expression data, ‘‘edgeR’’ [21]. This package models the digital expression data using a negative binomial (NB) distribution with parameters estimated from the actual data. First, we estimated the dispersion parameter in the NB model by comparing expression in two human samples (function estimateCommonDisp in edgeR package). This estimated com-mon dispersion was then used in an exact test (function exactTest) analogous to the Fisher’s exact test to detect differential expression between any two species. The resultingp-values were adjusted with Benjamini-Hochberg multiple testing correction to control the false discovery rate to be below 5%. Species-specific expression was identified separately in two groups of samples. Group one (G1) contained Human1, Chimpanzee, and Macaque samples. Group two (G2) contained Human2, Chimpanzee, and Macaque samples. Genes, HTR, or GW with significant expression difference in human-chimpanzee and human-macaque compari-sons, but not in chimpanzee-macaque comparison, in both G1 and G2 were classified to have human-specific expression. Similarly, we identified genes, HTR, or GW with chimpanzee-specific and rhesus macaque-specific expression (Tables S6, S8, and S10).
HTR were determined over the entire HCM alignment using standard parameters (maxspacing = 150 nt and minhits = 10) and assigned to the annotation categories according to the hierarchy mentioned above (Materials and Methods: Read mapping and annotation). We defined GW as HCM alignment regions containing a total of 50 sequence reads in the three species.
GO/KEGG enrichment analysis
Comparisons with published data
To compare human-chimpanzee expression differences, we used expression data measured using Affymetrix arrays in three human and three chimpanzee adult cerebellar samples [22]. Provided expression levels of 6,645 genes were quantile normal-ized and log2 transformed. Based on these data, for each gene we calculated human-chimpanzee difference as the difference be-tween mean expression levels in the two species. In our current RNA-Seq data, 14,959 genes are expressed in at least one of the three samples. For these genes, we quantile normalized the expression levels across three samples, log2-transformed, and calculated human-chimpanzee difference as the difference be-tween mean expression levels in the two species. Out of 118 genes with human-specific expression in RNA-Seq experiment, 34 were present in both data sets.
Conservation of the human-specific genes
We compare selective constrains in 118 genes with human-specific expression to that of 15,263 genes expressed in at least one out of four samples based on three measures: (1) Ka/Ks between human and mouse: the data was downloaded from Ensembl (release 50) [31] via Biomart and only considering 1:1 orthologs between human and mouse. (2) Ka/Ki between human and chimpanzee: this data was downloaded from [37]. (3) Promoter sequence divergence (Kp) between human and chimpanzee: this data was downloaded from [38]. The results are shown in Table S7.
Supporting Information
Figure S1 Composition of primate brain transcriptome Found at: doi:10.1371/journal.pcbi.1000843.s001 (0.14 MB DOC)
Figure S2 DNA length and transcriptional activity of repeat families
Found at: doi:10.1371/journal.pcbi.1000843.s002 (0.25 MB DOC)
Figure S3 Relationship between age rank and transcriptional activity of transposable element families
Found at: doi:10.1371/journal.pcbi.1000843.s003 (0.15 MB DOC)
Figure S4 The proportion of igHTR overlaps between the two human samples
Found at: doi:10.1371/journal.pcbi.1000843.s004 (0.10 MB DOC)
Figure S5 Expression correlation of igHTR
Found at: doi:10.1371/journal.pcbi.1000843.s005 (1.29 MB DOC)
Figure S6 Distribution of DNA sequence conservation scores at different igHTR expression cutoffs
Found at: doi:10.1371/journal.pcbi.1000843.s006 (0.67 MB DOC)
Figure S7 Correlation of expression levels of igHTR that cluster within the genome
Found at: doi:10.1371/journal.pcbi.1000843.s007 (0.09 MB DOC)
Figure S8 Connections between igHTR within clusters sup-ported by EST
Found at: doi:10.1371/journal.pcbi.1000843.s008 (0.04 MB DOC)
Figure S9 Expression correlation between igHTR and the nearest protein-coding gene
Found at: doi:10.1371/journal.pcbi.1000843.s009 (0.23 MB DOC)
Figure S10 Number of igHTR/gene 3 prime end connections verified by at least one EST sequence
Found at: doi:10.1371/journal.pcbi.1000843.s010 (0.15 MB DOC)
Figure S11 Number of conserved miRNA target sites in igHTR Found at: doi:10.1371/journal.pcbi.1000843.s011 (0.10 MB DOC)
Figure S12 Codon Substitution Frequency (CSF) score in different types of regions
Found at: doi:10.1371/journal.pcbi.1000843.s012 (0.08 MB DOC)
Figure S13 Overlap between igHTR and lincRNAs
Found at: doi:10.1371/journal.pcbi.1000843.s013 (0.10 MB DOC)
Figure S14 Overlap between igHTR and EvoFold predictions Found at: doi:10.1371/journal.pcbi.1000843.s014 (0.10 MB DOC)
Figure S15 Gene expression trees based on different measures of gene expression divergence
Found at: doi:10.1371/journal.pcbi.1000843.s015 (0.16 MB DOC)
Figure S16 Gene expression divergence vs. evolutionary time Found at: doi:10.1371/journal.pcbi.1000843.s016 (0.27 MB DOC)
Figure S17 Genomic annotation of expressed regions within HTR
Found at: doi:10.1371/journal.pcbi.1000843.s017 (0.21 MB DOC)
Figure S18 Genomic annotation of expressed regions within GW
Found at: doi:10.1371/journal.pcbi.1000843.s018 (0.21 MB DOC)
Table S1 Sample information
Found at: doi:10.1371/journal.pcbi.1000843.s019 (0.02 MB XLS)
Table S2 Numbers of sequence reads
Found at: doi:10.1371/journal.pcbi.1000843.s020 (0.02 MB XLS)
Table S3 Genomic coordinates, category and EST overlap of igHTR
Found at: doi:10.1371/journal.pcbi.1000843.s021 (0.18 MB XLS)
Table S4 GO term(biological process) enrichment analysis results
Found at: doi:10.1371/journal.pcbi.1000843.s022 (0.02 MB XLS)
Table S5 KEGG pathway enrichment analysis results
Found at: doi:10.1371/journal.pcbi.1000843.s023 (0.03 MB XLS)
Table S6 Species-specific Genes
Found at: doi:10.1371/journal.pcbi.1000843.s024 (0.13 MB XLS)
Table S8 Species-specific HTR
Found at: doi:10.1371/journal.pcbi.1000843.s026 (0.11 MB XLS)
Table S9 Annotation of genomic DNA expressed in HTR Found at: doi:10.1371/journal.pcbi.1000843.s027 (0.02 MB XLS)
Table S10 Species-specific GW
Found at: doi:10.1371/journal.pcbi.1000843.s028 (1.54 MB XLS)
Table S11 Annotation of genomic DNA expressed in GW Found at: doi:10.1371/journal.pcbi.1000843.s029 (0.02 MB XLS)
Acknowledgments
We thank NICHD Brain and Tissue Bank for Developmental Disorders and H. R. Zielke in particular for providing the human samples, Suzhou
Drug Safety Evaluation and Research Center and C. Lian, H. Cai and X. Zheng in particular for providing the macaque samples, E. Lizano, T. Giger and F. Xue for assistance, M. Kircher and J. Kelso for help with data analysis, H. Lockstone and J. Dent for editing the manuscript, M. Lachmann, M. Vingron, E. Green and all members of the Comparative Biology Group in Shanghai for helpful discussions. Finally, we thank three anonymous Reviewers for a very detailed and critical evaluation of our manuscript.
Author Contributions
Conceived and designed the experiments: WC SP PK. Performed the experiments: ZY CM NL HH. Analyzed the data: AGX LH ZL YX ML XF HH. Contributed reagents/materials/analysis tools: YY MS WC SP PK. Wrote the paper: LH WC SP PK.
References
1. van Bakel H, Hughes TR (2009) Establishing legitimacy and function in the new transcriptome. Brief Funct Genomic Proteomic 8: 424–436.
2. Mercer TR, Dinger ME, Mattick JS (2009) Long non-coding RNAs: insights into functions. Nat Rev Genet 10: 155–159.
3. Yeo G, Holste D, Kreiman G, Burge CB (2004) Variation in alternative splicing across human tissues. Genome Biol 5: R74.
4. Pan Q, Shai O, Lee LJ, Frey BJ, Blencowe BJ (2008) Deep surveying of alternative splicing complexity in the human transcriptome by high-throughput sequencing. Nat Genet 40: 1413–1415.
5. King MC, Wilson AC (1975) Evolution at two levels in humans and chimpanzees. Science 188: 107–116.
6. Enard W, Khaitovich P, Klose J, Zo¨llner S, Heissig F, et al. (2002) Intra- and interspecific variation in primate gene expression patterns. Science 296: 340–343.
7. Ca´ceres M, Lachuer J, Zapala MA, Redmond JC, Kudo L, et al. (2003) Elevated gene expression levels distinguish human from non-human primate brains. Proc Natl Acad Sci USA 100: 13030–13035.
8. Gu J, Gu X (2003) Induced gene expression in human brain after the split from chimpanzee. Trends Genet 19: 63–65.
9. Khaitovich P, Kelso J, Franz H, Visagie J, Giger T, et al. (2006) Functionality of intergenic transcription: an evolutionary comparison. PLoS Genet 2: e171. 10. Mortazavi A, Williams BA, McCue K, Schaeffer L, Wold B (2008) Mapping and
quantifying mammalian transcriptomes by RNA-Seq. Nat Methods 5: 621–628. 11. Morin R, Bainbridge M, Fejes A, Hirst M, Krzywinski M, et al. (2008) Profiling the HeLa S3 transcriptome using randomly primed cDNA and massively parallel short-read sequencing. Biotechniques 45: 81–94.
12. Wu Q, Kim YC, Lu J, Xuan Z, Chen J, et al. (2008) Poly A- transcripts expressed in HeLa cells. PLoS One 3: e2803.
13. Faulkner GJ, Kimura Y, Daub CO, Wani S, Plessy C, et al. (2009) The regulated retrotransposon transcriptome of mammalian cells. Nat Genet 41: 563–571.
14. Siepel A, Bejerano G, Pedersen J, Hinrichs AS, Hou M, et al. (2005) Evolutionarily conserved elements in vertebrate, insect, worm, and yeast genomes. Genome Research 15: 1034–1050.
15. Ashburner M, Ball CA, Blake JA, Botstein D, Butler H, et al. (2000) Gene ontology: tool for the unification of biology. The Gene Ontology Consortium. Nat Genet 25: 25–29.
16. Kanehisa M, Goto S (2000) KEGG: kyoto encyclopedia of genes and genomes. Nucleic Acids Res 28: 27–30.
17. Lin MF, Carlson JW, Crosby MA, Matthews BB, Yu C, et al. (2007) Revisiting the protein-coding gene catalog of Drosophila melanogaster using 12 fly genomes. Genome Research 17: 1823–1836.
18. Guttman M, Amit I, Garber M, French C, Lin MF, et al. (2009) Chromatin signature reveals over a thousand highly conserved large non-coding RNAs in mammals. Nature 458: 223–227.
19. Khalil AM, Guttman M, Huarte M, Garber M, Raj A, et al. (2009) Many human large intergenic noncoding RNAs associate with chromatin-modifying complexes and affect gene expression. Proc Natl Acad Sci U S A 106: 11667–11672.
20. Pedersen JS, Bejerano G, Siepel A, Rosenbloom K, Lindblad-Toh K, et al. (2006) Identification and classification of conserved RNA secondary structures in the human genome. PLoS Comput Biol 2: e33.
21. Robinson MD, McCarthy DJ, Smyth GK. edgeR: a Bioconductor package for differential expression analysis of digital gene expression data. Bioinformatics 26: 139–140.
22. Khaitovich P, Muetzel B, She X, Lachmann M, Hellmann I, et al. (2004) Regional patterns of gene expression in human and chimpanzee brains. Genome Research 14: 1462–1473.
23. Nowick K, Gernat T, Almaas E, Stubbs L (2009) Differences in human and chimpanzee gene expression patterns define an evolving network of transcription factors in brain. Proc Natl Acad Sci U S A 106: 22358–22363.
24. Haygood R, Fedrigo O, Hanson B, Yokoyama KD, Wray GA (2007) Promoter regions of many neural- and nutrition-related genes have experienced positive selection during human evolution. Nat Genet 39: 1140–1144.
25. Gilad Y, Oshlack A, Smyth GK, Speed TP, White KP (2006) Expression profiling in primates reveals a rapid evolution of human transcription factors. Nature 440: 242–245.
26. Mudge J, Miller NA, Khrebtukova I, Lindquist IE, May GD, et al. (2008) Genomic convergence analysis of schizophrenia: mRNA sequencing reveals altered synaptic vesicular transport in post-mortem cerebellum. PLoS One 3: e3625.
27. Chi SW, Zang JB, Mele A, Darnell RB (2009) Argonaute HITS-CLIP decodes microRNA-mRNA interaction maps. Nature 460: 479–486.
28. Sandberg R, Neilson JR, Sarma A, Sharp PA, Burge CB (2008) Proliferating cells express mRNAs with shortened 39 untranslated regions and fewer microRNA target sites. Science 320: 1643–1647.
29. Ji Z, Lee JY, Pan Z, Jiang B, Tian B (2009) Progressive lengthening of 39
untranslated regions of mRNAs by alternative polyadenylation during mouse embryonic development. Proc Natl Acad Sci USA 106: 7028–7033. 30. Li R, Li Y, Kristiansen K, Wang J (2008) SOAP: short oligonucleotide
alignment program. Bioinformatics 24: 713–714.
31. Hubbard T, Barker D, Birney E, Cameron G, Chen Y, et al. (2002) The Ensembl genome database project. Nucleic Acids Res 30: 38–41.
32. Karolchik D, Hinrichs AS, Furey TS, Roskin KM, Sugnet CW, et al. (2004) The UCSC Table Browser data retrieval tool. Nucleic Acids Res 32: D493–496. 33. Blanchette M, Kent WJ, Riemer C, Elnitski L, Smit AF, et al. (2004) Aligning
multiple genomic sequences with the threaded blockset aligner. Genome Res 14: 708–715.
34. Karolchik D, Kuhn RM, Baertsch R, Barber GP, Clawson H, et al. (2008) The UCSC Genome Browser Database: 2008 update. Nucleic Acids Res 36: D773–779.
35. Bolstad BM, Irizarry RA, Astrand M, Speed TP (2003) A comparison of normalization methods for high density oligonucleotide array data based on variance and bias. Bioinformatics 19: 185–193.
36. Prufer K, Muetzel B, Do HH, Weiss G, Khaitovich P, et al. (2007) FUNC: a package for detecting significant associations between gene sets and ontological annotations. BMC Bioinformatics 8: 41.
37. (2005) Initial sequence of the chimpanzee genome and comparison with the human genome. Nature 437: 69–87.
38. Khaitovich P, Hellmann I, Enard W, Nowick K, Leinweber M, et al. (2005) Parallel patterns of evolution in the genomes and transcriptomes of humans and chimpanzees. Science 309: 1850–1854.