Research Article
Characterization and Quantification of Compounds in the
Hydroalcoholic Extract of the Leaves from
Terminalia catappa
Linn. (Combretaceae) and Their Mutagenic Activity
Francisco José Mininel,
1Carlos Sérgio Leonardo Junior,
1Lívia Greghi Espanha,
2Flávia Aparecida Resende,
2Eliana Aparecida Varanda,
2Clarice Queico Fujimura Leite,
2Wagner Vilegas,
3and Lourdes Campaner dos Santos
11Organic Chemistry Department, Institute of Chemistry, S˜ao Paulo State University (UNESP), 14800-900 Araraquara, SP, Brazil
2Department of Biological Sciences, Faculty of Pharmaceutical Sciences, S˜ao Paulo State University (UNESP),
14801-902 Araraquara, SP, Brazil
3S˜ao Paulo State University (UNESP), Experimental Campus of S˜ao Vicente, 11350-000 S˜ao Vicente, SP, Brazil
Correspondence should be addressed to Lourdes Campaner dos Santos; loursant@gmail.com
Received 21 November 2013; Revised 10 January 2014; Accepted 17 January 2014; Published 9 March 2014
Academic Editor: Sandy van Vuuren
Copyright © 2014 Francisco Jos´e Mininel et al. his is an open access article distributed under the Creative Commons Attribution License, which permits unrestricted use, distribution, and reproduction in any medium, provided the original work is properly cited.
Terminaliais a genus of Combretaceous plants widely distributed in tropical and subtropical regions. hus, the aim of this study
was to quantify the majority compounds of the hydroalcoholic extract (7 : 3, v/v) of the leaves fromT. catappaby HPLC-PDA,
chemically characterize by hyphenated techniques (HPLC-ESI-IT-MSn) and NMR, and evaluate its mutagenic activity by the
Salmonella/microsome assay onS. typhimurium strains TA98, TA97a, TA100, and TA102. he quantiication of analytes was performed using an external calibration standard. Punicalagin is the most abundant polyphenol found in the leaves. he presence of
this compound as a mixture of anomers was conirmed using HPLC-PDA and1H and13C NMR. Mutagenic activity was observed
in strains TA100 and TA97a. As the extract is a complex mixture of punicalagin, its derivatives, and several other compounds, the observed mutagenicity may be explained in part by possible synergistic interaction between the compounds present in the
extract. hese studies show that mutagenic activity ofT. catappain the Ames test can only be observed when measured at high
concentrations. However, considering the mutagenic efects observed forT. catappa, this plant should be used cautiously for
medicinal purposes.
1. Introduction
As part of our eforts to identify the substances responsible for the pharmacological activities of plants utilized in Brazilian popular medicine (Biota-Fapesp Project number 09/52237-9), we have analyzed the hydroalcoholic extract of the leaves from Terminalia catappa L., which belongs to the family Combretaceae. he trivial names of these plants in Brazil include “amendoeira-da-praia,” “cuca,” and “chap´eu de sol.”
In several Asian countries, physicians have used the
leaves, bark, and fruit ofT. catappato treat dermatitis and
pyresis [1–4]. Moreover, the antimicrobial and antifungal [5–
8], antioxidative [9–11], anti-inlammatory [12, 13],
hepato-protective [3,4], antidiabetic [14], carcinogenesis-preventing
efects [15–17], antimalaric [18], and antinociceptive [19] ofT.
catappacould potentially provide beneits to human health. Natural products have also been isolated from the plant
T. catappawhich contains triterpenoids (ursolic acid, asiatic acid), squalene but no cafeine, lavonoids (isovitexin, vitexin, and rutin), gallic acid, hydrolysed tannins such as punicalagin anomers as a major component, punicalin, terlavins A and B, tergallagin, tercatain, chebulagic acid, geranin, granato B, and
corilagin [13,20,21].
Tannins have been reported to be responsible for decreases in food intake, growth rate, feeding eiciency, net metabolizable energy, and protein digestibility in
exper-imental animals [21]. Incidences of certain cancers, such
as esophageal cancer, have been reported to be related to consumption of tannin-rich foods such as betel nuts and herbal teas, suggesting that tannins might be carcinogenic
[22]. However, other reports have indicated that the
carcino-genic activity of tannins might be related to components that are associated with tannins, rather than the tannins
themselves [23,24]. Tannins have also been reported to exert
other physiological efects, such as the acceleration of blood clotting, a reduction in blood pressure, a decrease in serum lipid levels, liver necrosis, and modulation of the immune
response [21,25].
Ellagitannins have been isolated along with gallotannins from various other plant families and show little chemotaxo-nomic signiicance. he tannins punicalagin and punicalin, both of which contain a gallagyl unit and were irst
iso-lated from the pericarps of pomegranate (Punica granatum,
Punicaceae) [26], were a characteristic component in some
Terminaliaspecies. his supports the hypothesis that Puni-caceae is chemotaxonomically proximate to Combretaceae as
classiied by Cronquist [27].
Despite its biological properties, the chemical
compo-sition may vary according to geographiclocation [28, 29],
a fact impairing the standardization of raw material and
commercial products for medicinal purposes [30].
Considering that there are no data in the literature on quantiication of the majority secondary metabolites of the
hydroalcoholic extract of theT. catappaby HPLC-PDA and
the popular use of this plant, in this study the punicalagin anomers and ellagic acid were isolated and quantiied.
Moreover, the mutagenic efects were evaluated using aSalmonella/microsome assay (Ames test) in the presence
and in the absence ofin vitrometabolizing systems in the
concentrations 22.24, 16.68, 11.12, 5.56, and 2.78 mg/plate.
2. Experimental
2.1. Chemical and Reagents. HPLC-grade methanol (MeOH) and acetonitrile were purchased from J.T. Baker (Baker-Mallinckrodt, Phillipsburg, NJ, USA). Standards of ellagic acid were purchased from Sigma Chemical Co. (St. Louis, MO, USA) and had a purity of 95%. he anomers mixture
of punicalagin�and�isolated of the hydroalcoholic extract
fromT. catappa(with 98% purity) were used as external
stan-dards. HPLC-grade water (18 MΩ⋅cm) was obtained using a
direct Milli-Q puriication system (Millipore Co., Bedford, MA, USA). Sep-Pak RP18 cartridges (500 mg/mL) for solid-phase extraction (SPE) were purchased from Phenomenex Co. (Torrance, CA, USA).
2.2. Apparatus. he HPLC system used was a JASCO 2010 HPLC (Jasco, Tokyo, Japan) equipped with PU-2089S Plus pump, a MD-2018 Plus Photodiode Array Detector (PDA), an AS-2055 Plus auto sampler, and column oven (CO-2065 plus). he sotware ChromNav (Workstation JASCO-ChromNav 1.18.03) was used to control the analytical system and data collection and processing. To purify the substances, a semipreparative JASCO HPLC equipped with two PU-2086 pumps, a high pressure mixer (Model MX-2080-32), a PDA
detector (model MD-2018 Plus), and a Rheodyne 500�L
manual injector loop was used. he sotware used to operate the equipment and data processing was ChromNAV version 1 : 18 : 03.
he mass spectrometry experiments were performed on LCQ Fleet equipment (hermo Scientiic) equipped with a dispositive of direct insertion of the sample via low injection analysis (FIA). he studied matrix was analyzed by electrospray ionization (ESI), and fragmentation in multiple
stages (MS2, MS3, and MSn) was performed at an ion trap (IT)
interface. he negative mode was selected for the generation and analysis of the mass spectra for the irst order (MS) and for the remaining multistage experiments under the
following conditions: capillary voltage,−25 V; voltage spray,
−5 kV; and capillary temperature, 275∘C. A carrier gas (N2)
with a low of 8 arbitrary units (A.U.) was used, and the collision gas was helium (He). he track acquisition was 100– 2000�/�.Xcaliburversion 1.3 sotware (hermo Finnigan) was used to acquire and process the data.
he 1H- and 13C-NMR experiments were performed
using a 300 MHz (11.7 T) nuclear magnetic resonance
spec-trometer (Varian Inova). CD3OD was used as the solvent
(Sigma Aldrich).
2.3. Plant Material. he leaves ofT. catappawere collected from the beach-front city of Santos,SP, with the permission of the municipality, in April 2010 and were identiied by botanist Paulo Salles Penteado of University Santa Cecilia and registered (M Tomaz 01) in the Herbarium of the University of Santa Cecilia (HUSC). Authorization was obtained from IBAMA (Instituto Brasileiro do Meio Ambiente e dos Recur-sos Naturais Renov´aveis) to the number 33152.
2.4. Extraction. he infusion and hydroalcoholic extract were prepared according to the experimental protocol estab-lished in Biota-Fapesp Project, which this work is linked (process number 09/52237-9).
2.4.1. Preparation of the Infusion of the Leaves from T. catappa.
he leaves (1 g) ofT. catappa, ater drying, were prepared by
infusion as their use in folk medicine [31].
2.4.2. Preparation of the Hydroalcoholic Extract of the Leaves from T. catappa. he dried and powdered leaves (524.6 g) of
T. catappawere extracted by percolation at room temperature
with a mixture of EtOH : H2O (7 : 3, v/v). he solvents were
evaporated to dryness at low pressure to give 33.1 g of the crude hydroalcoholic extract (8.7%). he extract was
analyzed by FIA-ESI-IT-MSnand HPLC-PDA.
2.4.3. Isolation of the Fraction Containing the Punicalagin Anomers by Semipreparative HPLC. A total of 14 g of
hydroal-coholic extract (7 : 3, v/v) was dissolved in H2O : MeOH (8 : 2,
200 400 600 800 1000 1200 1400 1600 1800 2000 0
10 20 30 40 50 60 70 80 90 100
Re
la
ti
ve
a
b
un
da
n
ce
1083.19
781.46 541.65
311.75
635.32 325.77
932.79
692.03 1114.80 301.30 339.71
113.22 1144.03
1283.48 1439.30
467.76 1571.17 1724.471853.95
m/z
Figure 1: First-order mass spectrum of the hydroalcoholic extract from the leaves ofT. catappain the negative mode. Range of ions with�/�
100–2000 Da.
Table 1: Identiication of substances inT. catappaby
FIA-ESI-IT-MSn.
[M–H]− MSnions Identiication
1083 781 [M-152-152-H]−
601 [M-152-152-180-H]− Punicalagin(1)
781 601 [M-180-H]− Punicalin(2)
601 409 [M-191-H]− Gallagic acid(3)
301 257 [M-44-H]−
229 [M-44-28-H]− Ellagic acid(4)
2.5. Identiication of the Punicalagin Anomers and Ellagic Acid in the Hydroalcoholic Extract. Identiication of the
punicalagin anomers was performed using FIA-ESI-IT-MSn
and compared with the literature data [32],1H and13C NMR
[33] and HPLC-PDA.
For the FIA-ESI-IT-MSn assay, 10 mg of the crude
hydroalcoholic extract was dissolved in 1 mL of MeOH : H2O
(1 : 1, v/v) ater using an ultrasonic bath for 5 minutes. he
samples were then iltered through a 0.22�m PTFE ilter, and
aliquots of 20�L were directly injected into the
FIA-ESI-IT-MSnsystem.
For the HPLC-PDA a clean-up step was performed to
remove any contaminants; the solution was puriied by
solid phase extraction (SPE) using Phenomenex Strata C18
cartridges (500 mg of stationary phase) that were previously activated with 5 mL of MeOH and equilibrated with 5 mL of
MeOH : H2O (1 : 1, v/v). he compounds were eluted from
cartridges using 1 mL of MeOH : H2O (1 : 1, v/v) with a inal
volume of 5 mL. he samples were then iltered through a
0.22�m PTFE ilter and dried. he dry extract was diluted to
10 mg/mL in HPLC solvent. Aliquots of 20�L were injected
directly into the HPLC-PDA with detection at 270 nm. he
identiication of the diferent compounds in the chromato-graphic proile of the hydroalcoholic extract was done by
comparing their retention times (��) and UV spectra with
those obtained for the pure standards (ellagic acid, Sigma) and the compounds isolated from the hydroalcoholic extract ofT. catappa(punicalagin anomers).
For the conirmation of the presence of ellagic acid experiments were done by coinjection. he hydroalcoholic
extract (15 mg) was dissolved in 1 mL of MeOH : H2O (1 : 1,
v/v) and subjected to a clean-up procedure using SPE car-tridge RP18 (50 mg). he sample was then iltered through
a PTFE ilter (0.22�m) and dried at room temperature.
he resulting solid was redissolved in MeOH : H2O to a
concentration of 10 mg/mL. Two milligrams of ellagic acid standard (Sigma) was then added to this solution, and the solution was centrifuged for 2 min and iltered through a
0.22�m ilter. A hydro column with a low rate of 1 mL/min
was used with a gradient of 5–60% MeOH for 60 minutes, and the absorbance at 270 nm was detected. he chromatograms of the hydroalcoholic extract were compared before and ater the addition of the ellagic acid standard. From the coinjection of ellagic acid and the hydroalcoholic extract, we conirmed the presence of ellagic acid from the signiicant increase in
the peak eluting at��47.30 min (peak 3).
2.6. Conditions for Quantiication of Punicalagin (Anomers) and Ellagic Acid. he quantiication of analytes was
per-formed using an external calibration standard [34,35]. he
curves were constructed using standards of the commercial ellagic acid (Sigma) and the isolated punicalagin anomers. We evaluated the content of each punicalagin anomer and
the total content of punicalagins in leaves ofT. catappa. A
HO OH OH OH HO O O O O OH OH O O OH OH O O O O OH O O HO O O HO HO HO O O O O OH OH HO OH O O OH O HO HO OH HO HO OH OH HO OH OH OH HO O O O O OH OH O HO HO OH O O R O HO
HO OH HO OH
O O O O OH O H H CH2 CH2
Punicalagin (1) (m/z 1083)
Punicalin (2) (m/z 781)
Ellagic acid (4) (m/z 301)
Gallagic acid (3) (m/z 601)
17 16 15 13 19 14 18 12 8 9 11 10 7
3 2 1
5 4 6 20 48 47 45 44 43 42 46 39 38 37 36 35 40 41 32 31
30 2928
33 34 27 22 23 24 25 26 21 R�
Adapted from Seeram et al. [32]
Adapted from Seeram et al. [32]
Adapted from Seeram et al. [32]
Adapted from Seeram et al. [32]
Figure 2: Punicalagin (1), punicalin (2), gallagic acid (3), and ellagic acid (4). Adapted from Seeram et al. [32].
Table 2: Chemical shits (1H and13C) of the�- and�-punicalagins in CD3OD isolated fromT. catappa.
Position �-punicalagin �-punicalagin
�(1H) Multiplicity (Hz) �(13C) �(1H) Multiplicity (Hz) �(13C)
1 5.08 d(3.5) 89.87 4.66 d(8.0) 93.77
2 4.87 dd(3.0, 8.0) 73.53 4.62 dd(3.0, 8.1) 75.48
3 5.20 t(9.3) 76.08 4.92 t(10.0) 78.78
4 4.78 t(9.0) 70.23 4.85 t(10.0) 74.88
5 3.23 t(9.0) 66.33 2.57 dd(9.9, 11.0) 71.58
6a 2.10 d(9.9) 63.63 4.05 d(9.9) 63.03
6b 4.09 dd(7.0, 7.0) 63.63 4.10 d(7.8) 63.03
9 6.52 s 105.46 6.54 s 106.21
18 6.66 s 107.41 6.68 s 106.21
23 6.73 s 108.76 6.77 s 109.51
Table 3: Parameters for quantiication of the isolated compounds.
Linear coeicient (�) Slope (�) Correlation coeicient LOD
�g/mL
LOQ
�g/mL
Ellagic acid 21753 71514 0.998 1.00 3.04
�-punicalagin 37326 11861 0.997 10.38 31.46
�-punicalagin 44760 16830 0.999 8.77 26.59
Total punicalagins 82086 28691 0.998 9.44 28.61
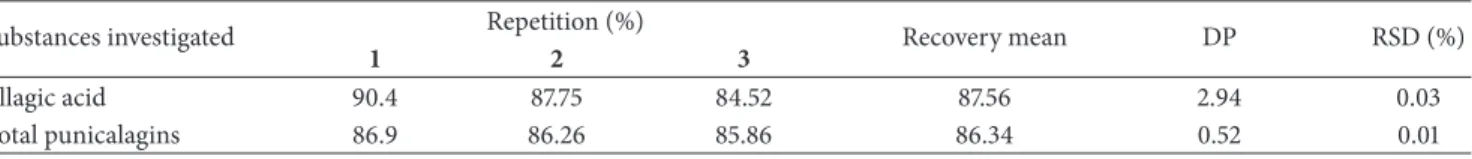
Table 4: Determining the accuracy of the method for the determination of each of the substances quantiied.
Substances investigated Repetition (%) Recovery mean DP RSD (%)
1 2 3
Ellagic acid 90.4 87.75 84.52 87.56 2.94 0.03
Total punicalagins 86.9 86.26 85.86 86.34 0.52 0.01
RSD (%) = RSD: relative standard deviation (100×SD/mean).
dilutions to 500, 250, 125, 62.5, 15.6, 7.8, and 3.9�g/mL were
made. For punicalagin, a stock solution at concentrations
of 4000�g/mL of the �-anomer (peak 1) and 4000�g/mL
of the �-anomer (peak 2) was prepared. From the stock
solution, serial dilutions were made to reduce the concen-tration in 2 : 1 increments (2000, 1000, 500, 250, 125, 62.50,
and 31.25�g/mL) for both the �- and �-anomers. Each
concentration level was analyzed in triplicate. he mean areas of the chromatographic peaks obtained were interpolated as a function of concentration using linear regression and were used to generate the calibration curves. he linear coeicients (a) and angle (b) were obtained from the calibration curves.
he correlation coeicient(�2)and limits of detection (LOD)
and quantitation (LOQ) for peaks 1 and 2 corresponding to
the �- and �-anomers of punicalagin [36] were obtained.
he accuracy of the HPLC method was estimated from the recovery tests. he recovery tests were performed by adding known concentrations (low, medium, and high) of the
reference ellagic acid (15, 60, and 250�g/mL) and isolated
punicalagin anomer (250, 500, and 2000�g/mL) standards.
he average recovery value was calculated using the following
formula: recovery % = [(�f/�nf + �pd)] × 100, where �f
corresponds to fortiied concentration,�nf corresponds to
the unfortiied concentration and �pd corresponds to the
concentration of the added standard.
Repeatability of intra- and interday was done to deter-mine the accuracy of the developed method. he relative standard deviation (RSD) was taken as a measure of accuracy. Repeatability of intra- and interday was determined in six replicates within the range found in the extract in a day and on three consecutive days, respectively.
2.7. Salmonella/Microsome Assay. Mutagenic activity was
evaluated using the Salmonella/microsome assay with the
Salmonella typhimuriumtester strains TA98, TA100, TA97a, and TA102, which were kindly provided by Dr. B. N. Ames
(Berkeley, CA, USA), with (+S9) and without (−S9)
metab-olization using the preincubation method [37]. he strains
were grown overnight from frozen cultures for 12–14 h in Oxoid Nutrient Broth number 2. he metabolic activation
mixture (S9 fraction), prepared from the livers of Sprague-Dawley rats treated with the polychlorinated biphenyl mix-ture Aroclor 1254 (500 mg/kg), was purchased from Molecu-lar Toxicology Inc. (Boone, NC, USA) and freshly prepared before each test. he metabolic activation system consisted
of 4% S9 fraction, 1% 0.4 M MgCl2, 1% 1.65 M KCl, 0.5%
1 M D-glucose-6-phosphate disodium, 4% 0.1 M NADP, 50% 0.2 M phosphate bufer, and 39.5% sterile distilled water. For the determination of the mutagenic activity, ive diferent concentrations of extract (1.56 to 22.24 mg/plate), diluted in DMSO, were assayed. he concentrations of the sample were selected on the basis of a preliminary toxicity test. In all subsequent assays, the upper limit of the dose range tested was either the highest nontoxic dose or the lowest toxic dose determined in the preliminary assay. Toxicity was detected either as a reduction in the number of histidine revertants (His+) or as a thinning of the auxotrophic background (i.e., background lawn).
he various concentrations of extract to be tested were added to either 0.5 mL of 0.2 M phosphate bufer or 0.5 mL of 4% S9 mixture with 0.1 mL of bacterial culture and then
incubated at 37∘C for 20–30 min. Next, 2 mL of top agar was
added, and the mixture was poured onto a plate containing minimal agar.
he plates were incubated at 37∘C for 48 h, and the His+
revertant colonies were counted manually. All experiments were analyzed in triplicate. he results were analyzed with the statistical sotware package Salanal 1.0 (U.S. Environ-mental Protection Agency, Monitoring Systems Laboratory, Las Vegas, NV, from the Research Triangle Institute, RTP,
NC, USA), adopting the Bernstein et al. [38] model. he
data (revertants/plate) were assessed by analysis of variance (ANOVA) followed by linear regression. he mutagenic index (MI), which is the average number of revertants per plate with the test compound divided by the average number of revertants per plate with the negative (solvent) control, was also calculated for each concentration tested. A sample was considered mutagenic when a dose-response relationship was detected and a twofold increase in the
0.0 10.0 20.0 30.0 40.0 50.0 60.0 Retention time (min)
0 1000000 2000000
200 220 240 260 280 300 320 340 360 380 400 Wavelength (nm) 0
20 40 60 80 100
In
ten
si
ty (%)
200 220 240 260 280 300 320 340 360 380 400 Wavelength (nm) 0
20 40 60 80 100
In
ten
si
ty (%)
200 220 240 260 280 300 320 340 360 380 400 Wavelength (nm) 0
20 40 60 80 100
In
ten
si
ty (%)
1 2
3
In
ten
si
ty (
𝜇
V)
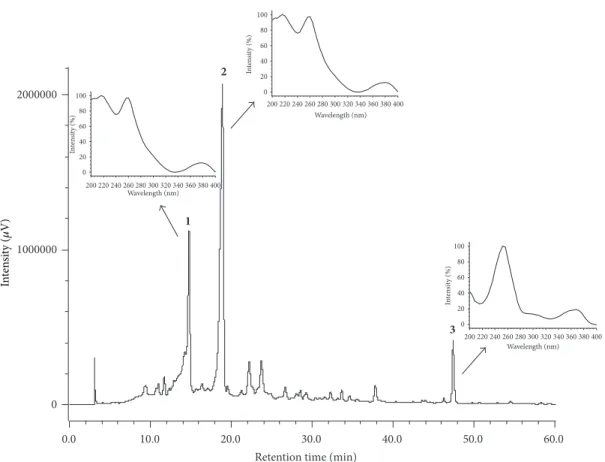
Figure 3: Chromatogram of hydroalcoholic extract of the leaves ofT. catappadissolved in MeOH : H2O (1 : 1 v/v), at 10 mg/mL. he method
utilized a hydro column at a low rate of 1 mL/min with a gradient of 5–60% MeOH for 60 min HPLC-PDA (Jasco), 270 nm. he UV spectra
from��14.75 (peak 1) min and at��18.86 min (peak 2), characteristic of the�- and�-anomers of punicalagin (1,2) and ellagic acid (3).
one concentration [39]. he standard mutagens used as
positive controls in experiments without the S9 mix were
4-nitro-o-phenylenediamine (10.0�g/plate, TA98), sodium
azide (1.25�g/plate, TA100), mitomycin (0.5�g/plate, TA102)
and 2-anthramine (1.25�g/plate, TA98, TA100), and
2-aminoluorene (10.0�g/plate, TA102) in the presence of S9.
DMSO served as the negative (solvent) control.
3. Results and Discussion
he analysis of mass spectra of the hydroalcoholic extract (Figure 1) showed the precursor ions [M-H]− �/� 1083
(punicalagin),�/�781 (punicalin),�/�601 (gallagic acid),
and�/�301 (ellagic acid) [32]. Second-order fragmentation
(MS2) conirmed the presence of the metabolites shown in
the scheme ofFigure 2for substances1–4(Table 1). Seeram
et al. [32] studying the commercial juice industry of the
pomegranate husk identiied the same fragmentation of these same compounds.
he chromatographic proile by HPLC-PDA of the hydroalcoholic extract and the infusion are shown in Figures
3and4. In the chromatogram, three major peaks (1–3) eluting
at�� 14.75 min,�� 18.80 min, and�� 47.30 min are observed.
Figures 3 and 4 show the UV region of the spectrum
obtained using a PDA detector for the peaks eluting at
�� 14.75 min (peak 1) and �� 18.80 min (peak 2). he data
conirm the presence of both punicalagin anomers with
absorption maxima at�max 218, 260, and 379 nm. he
com-pound eluting at��47.30 min (peak 3) corresponds to ellagic
acid with�maxvalues of 250, 306, and 368 nm, as conirmed
by coinjection experiments with a standard analyte (Figures
3and4). he data obtained for UV anomers punicalagin and
ellagic acid are consistent with those found in the literature
[40] and are characteristic of gallagyl chromophore [41].
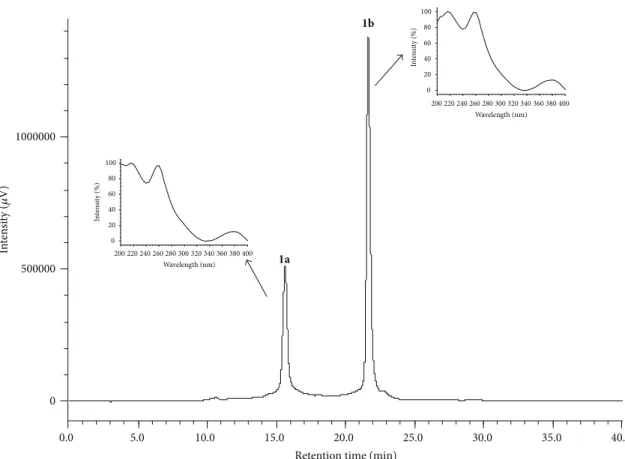
Peaks 1and 2 (Figure 3) were partitioned (item 2.4.3),
collected separately, and analyzed by HPLC-PDA (Figure 5).
he analysis of the peaks by HPLC-PDA with�� 14.75 min
and 18.80 min, respectively, display an interesting behavior, as they resolve into two peaks with distinct retention times when analyzed under the same conditions to obtain peaks at similar retention times with the same UV spectra. his indicates that the compounds are the mixture of anomers
(�- and�-punicalagin). hese compounds have absorption
maxim at�max 218, 260, and 379 nm and are characteristic
of the chromophore gallagyl [41]. For peak 1, the
HPLC-PDA analysis shows the presence of two peaks (1a and1b)
with retention times of 15.29 min and 21.07 min, respectively (Figure 5).
In solution, punicalagin rapidly interconverts between
the�- and�-anomers (Figure 2, compound1). he13C NMR
1 2
3
200 220 240 260 280 300 320 340 360 380 400 Wavelength (nm) 0
20 40 60 80 100
In
ten
si
ty (%)
200 220 240 260 280 300 320 340 360 380 400 Wavelength (nm) 0
20 40 60 80 100
In
ten
si
ty (%)
200 220 240 260 280 300 320 340 360 380 400 Wavelength (nm) 0
20 40 60 80 100
In
ten
si
ty (%)
0.0 10.0 20.0 30.0 40.0 50.0 60.0 Retention time (min)
0 1000000 2000000
In
ten
si
ty (
𝜇
V)
Figure 4: Chromatogram of infusion of the leaves ofT. catappa. Gradient 5–60% MeOH, 60 min, 270 nm. Peaks1and2= punicalagins,3=
ellagic Acid. he UV spectra of peak 1, eluting at��14.70 min and peak 2 at��18.70 min, characteristic of the�- and�-punicalagin anomers.
Peak 3, at��47.30 min.
carbons at�89.87 and�93.77, corresponding to punicalagins
� (present in lesser proportion in peak 1) and � (present
in a greater proportion in peak 2), respectively. he stereo-chemistry at the anomeric position can be easily determined by measuring the coupling constant between the anomeric
proton H-1 and the adjacent proton H-2 in the 1H NMR
spectrum. A large coupling constant (�H-1,H-2 >5 Hz)
gen-erally indicates a�-glycosidic coniguration (substituent in
the equatorial orientation), whereas a small coupling constant
(�H-1,H-2 = 0–5, Hz) indicates an�-glycosidic coniguration
(substituent in the axial orientation). he chemical shit and
the coupling constant corresponding to the�-anomer is�
5.08 (� = 3.5Hz) and for the�-anomer is�4.66 (� = 8.0Hz).
NMR data of the isolated anomers (�- and�-punicalagin) are
shown in theTable 2(enumeration of carbons and hydrogens
inFigure 2) compared with data found in the literature [33]. he deprotonated molecule generated in the
FIA-ESI-IT-MS [M-H]− at�/�1083 (1084 MW) (Table 1) and the UV
spectra exhibited by �- and �-punicalagin conirmed this
identiication (Figure 5).
he linear regression analysis of the peak area for �
-and �-punicalagin, the total punicalagins, and ellagic acid
are showed in theTable 3. hus, it becomes necessary to use
suicient number of standard solutions to adequately deine
the relationship between concentration and response [42].
hese results demonstrate the linearity of the method over the analyzed concentration range.
he recovery percentages for ellagic acid and total punicalagins were found to be 87% and 86%, respectively (Table 4). he results were presented as mean and standard deviation of the percentages recovered. he results showed that the accuracy of the method is very good for all analytes
(RSD<2%). he relative standard deviations also showed that
the process of sample preparation is reproducible [43].
he relative standard deviations (RSDs) for repeatability
testing intra- and interday analyses are shown inTable 5. he
result is presented as relative standard deviation from the average. he method showed excellent repeatability, with all
RSD values lower than 1% [44].
Table 6shows the mean number of revertants/plate (M), the standard deviation (SD), and the mutagenic index (MI)
ater the treatments with the T. catappa hydroalcoholic
extract, observed in S. typhimurium strains TA98, TA100,
TA102, and TA97a, in the presence (+S9) and absence (−S9)
of metabolic activation.
In the TA98 strain, theT. catappahydroalcoholic extract
did not induce any increase in the number of revertant colonies under the conditions used in this study. he other strains were more sensitive to the toxic efects of extract, and it was thus necessary to decrease the doses.
Only in the absence of the external metabolizing system,
S9 mix, in the S. typhimurium strains TA100 and TA97a,
0.0 5.0 10.0 15.0 20.0 25.0 30.0 35.0 40.0 0
500000 1000000
1a
1b
200 220 240 260 280 300 320 340 360 380 400 Wavelength (nm)
Wavelength (nm)
0 20 40 60 80 100
In
ten
si
ty (%)
In
ten
si
ty (%)
200 220 240 260 280 300 320 340 360 380 400 0
20 40 60 80 100
In
ten
si
ty (
𝜇
V)
Retention time (min)
Figure 5: Chromatogram peak1a(�-punicalagin) and peak1b(�-punicalagin) collected from H2O : MeOH (8 : 2 v/v) at 10 mg/mL of the
leaves ofT. catappa, eluting at��15.29 min (1a) and��21.07 min (1b). he low rate was 1 mL/min with a gradient 5–30% MeOH for 30 minutes
using a hydro column. HPLC-PDA (Jasco), 270 nm. he UV spectra of peak 1, eluting at��15.29 min (1a) and at��21.07 (1b) min, characteristic
of the�- and�-punicalagin anomers.
Table 5: Repeatability test results for each substance quantiied.
Substances investigated Intraday (� = 6) Interday (� = 6)
Mean (%) DP RSD (%) Mean (%) DP RSD (%)
Ellagic acid 87.44 0.12 0.001 87.53 0.19 0.002
Total Punicalagins 86.34 0.19 0.002 86.19 0.17 0.002
RSD (%) = RSD: relative standard deviation (100×SD/mean).
control, with a MI higher than 2.0 at the concentration of 3.12 mg/plate in strain TA100 and 9.38 mg/plate in strain TA97a, indicating the direct mutagenic activity for these strains.
In the TA102 strain (+S9 and –S9), the T. catappa
hydroalcoholic extract shows signs of mutagenicity, with MI values approximately 2.
heS. typhimuriumtest strain TA97a detects frameshit mutations in C-C-C-C-C-C; +1 cytosine and TA98 frameshit
in DNA target-C-G-C-G-C-G-C-G, the S. typhimurium
tester strain TA100 is capable of revealing base-pair
substi-tution point mutations and theS. typhimuriumtester strain
TA102 is normally used to detect cross-linking agents and
base-pair substitution mutations [39]. hus, according to the
strains involved, theT. catappahydroalcoholic extract mainly
induces substitution of base pairs (TA100) and frameshit mutations (TA97a).
Ko et al. [17] evaluated the toxicity and mutagenicity of
supercritical carbon dioxide (SC-CO2) extracts ofT. catappa
leaves at a dose of 0.5 mg/plate in the strain TA100 (detect base-pair substitution) and observed absence of mutagenic efect. he absence of mutagenic efect was also observed for TA102 and TA98 when the ethanolic extract was evaluated.
hese studies show that mutagenic activity ofT. catappa
as
ed
C
o
m
p
lemen
ta
ry
and
Al
te
rn
at
iv
e
M
edicine
9
Table 6: Mutagenic activity expressed as the mean and standard deviation of the number of revertants/plate and mutagenic index (in parenthesis) inSalmonella typhimuriumTA98, TA100,
TA97a, and TA102 strains treated with hydroalcoholic extract ofT. catappaat various doses, with (+S9) or without (−S9) metabolic activation.
Treatments Number of revertants (M±SD)/ plate and MI
TA98 TA100 TA102 TA97a
mg/plate −S9 +S9 mg/plate −S9 +S9 −S9 +S9 −S9 +S9
Terminalia catappa
0.0a 16 ± 3 68 ± 1 0.0a 93 ± 6 87 ± 4 352 ± 30 435 ± 43 172 ± 2 99 ± 1
2.78 17 ± 6(1.1) 75 ± 7(1.1) 1.56 91 ± 2(1.0) 88 ± 9(1.0) 461 ± 11∗(1.3) 481 ± 23(1.1) 223 ± 3∗(1.3) 127 ± 3(1.3) 5.56 21 ± 3(1.3) 75 ± 7(1.1) 3.12 188 ± 19∗∗(2.0) 90 ± 6(1.0) 514 ± 16∗(1.5) 668 ± 75∗(1.5) 252 ± 12∗(1.5) 102 ± 7(1.0)
11.12 18 ± 5(1.1) 57 ± 1(0.8) 6.25 210 ± 24∗∗(2.3) 91 ± 6(1.0) 653 ± 22∗(1.9) 689 ± 57∗(1.6) 287 ± 14∗(1.7) 95 ± 12(1.0)
16.68 14 ± 3(0.9) 75 ± 4(1.1) 9.38 40 ± 4(0.4) 95 ± 1(1.1) 563 ± 32∗(1.6) 728 ± 28∗(1.7) 337 ± 19∗∗(2.0) 93 ± 10(0.9)
22.24 2 ± 1(0.1) 68 ± 10(1.0) 12.5 Nd 88 ± 4(1.0) 648 ± 32∗(1.8) 621 ± 23∗(1.4) 397 ± 19∗∗(2.3) 83 ± 2(0.8)
Ctrol+ 720 ± 63 500 ± 57 Ctrol+ 1225 ± 75 700 ± 80 1143 ± 53 1309 ± 38 1426 ± 67 700 ± 45
∗� < 0.05(ANOVA);∗∗� < 0.01(ANOVA), 0a: Negative control: dimethyl sulfoxide (DMSO—75�L/plate); Positive Control: 4-nitro-o-phenylenediamine (10.0�g/plate—TA98 and TA97a); sodium azide
data corroborate the observations of Gupta et al. [45], which indicated that all tannins result in polyphenol toxicity at high
concentrations [46].
4. Conclusions
In the hydroalcoholic extract ofT. catappa, tannins were the
most abundant compounds observed, and the anomers�
-and �-punicalagin were the major compounds. Moreover,
considering that the extract is a complex mixture of several unknown organic compounds, the mutagenicity observed may be explained in part by a synergy between compounds present in the extract.
he dosage and type of tannin involved are critical for these efects. hus, the results obtained in this study are use-ful for better understanding the pharmacological activities of T. catappa. However, considering the mutagenic efects
observed in this study,this plant should be used cautiously
for medicinal purposes.
Based on the obtained results, it can be concluded that the developed method (HPLC-PDA) is suitable for its purpose, namely, the determination of anomers punicalagin
and ellagic acid in extract ofT. catappa.
Conflict of Interests
he authors declare that they have no conlict of interests.
Acknowledgments
he authors are grateful for Grant 09/52237-9, S˜ao Paulo Research Foundation (FAPESP) for providing inancial aid to W. Vilegas and L. C. Santos. he authors also thank Con-selho Nacional de Desenvolvimento Cient´ıico e Tecnol´ogico (CNPq) for grants to L. C. Santos, E. A. Varanda and W. Vilegas.
References
[1] C. B. Yeh, M. J. Hsieh, M. H. Chien, P. Y. Lin, H. L. Chiou,
and S. F. Yang, “Terminalia catappaexerts antimetastatic efects
on hepatocellular carcinoma through transcriptional inhibition
of matrix metalloproteinase-9 by modulating NF-�B and
AP-1 activity,” Evidence Based and Complementary Alternative
Medicine, vol. 2012, Article ID 595292, 11 pages, 2012.
[2] T. Morioka, M. Suzui, V. Nabandith et al., “Modifying efects ofTerminalia catappa on azoxymethane-induced colon
car-cinogenesis in male F344 rats,”European Journal of Cancer
Prevention, vol. 14, no. 2, pp. 101–105, 2005.
[3] X. Tang, J. Gao, Y. Wang et al., “Efective protection of
Ter-minalia catappa L. leaves from damage induced by carbon
tetrachloride in liver mitochondria,” Journal of Nutritional
Biochemistry, vol. 17, no. 3, pp. 177–182, 2006.
[4] X.-H. Tang, L. Gao, J. Gao et al., “Mechanisms of
hepatopro-tection ofTerminalia catappaL. extract on
D-galactosamine-induced liver damage,”American Journal of Chinese Medicine,
vol. 32, no. 4, pp. 509–519, 2004.
[5] P. Fyhrquist, L. Mwasumbi, C.-A. Hæggstr¨om, H. Vuorela, R. Hiltunen, and P. Vuorela, “Ethnobotanical and antimicrobial
investigation on some species ofTerminaliaandCombretum
(Combretaceae) growing in Tanzania,”Journal of
Ethnopharma-cology, vol. 79, no. 2, pp. 169–177, 2002.
[6] R. Nair and S. Chanda, “Antimicrobial activity ofTerminalia
catappa,Manilkara zapotaandPiper betelleaf extract,”Indian Journal of Pharmaceutical Sciences, vol. 70, no. 3, pp. 390–393, 2008.
[7] A. Manzur, A. Raju, and S. Rahman, “Antimicrobial activity of
Terminalia catappaextracts against some pathogenic microbial
strains,”Pharmacology & Pharmacy, vol. 2, pp. 299–305, 2011.
[8] S. Chanda, K. Rakholiya, and R. Nair, “Antimicrobial activity ofTerminalia catappaL. leaf extracts against some clinically
important pathogenic microbial strains,”Chinese Medicine, vol.
2, pp. 171–177, 2011.
[9] P.-S. Chen and J.-H. Li, “Chemopreventive efect of punicalagin,
a novel tannin component isolated fromTerminalia catappa, on
H-ras-transformed NIH3T3 cells,”Toxicology Letters, vol. 163,
no. 1, pp. 44–53, 2006.
[10] C.-C. Chyau, P.-T. Ko, and J.-L. Mau, “Antioxidant properties of
aqueous extracts fromTerminalia catappaleaves,”LWT, vol. 39,
no. 10, pp. 1099–1108, 2006.
[11] T. Masuda, S. Yonemori, Y. Oyama et al., “Evaluation of the antioxidant activity of environmental plants: activity of the leaf
extracts from seashore plants,”Journal of Agricultural and Food
Chemistry, vol. 47, no. 4, pp. 1749–1754, 1999.
[12] C.-C. Lin, Y.-F. Hsu, and T.-C. Lin, “Efects of punicalagin and punicalin on carrageenan-induced inlammation in rats,”
American Journal of Chinese Medicine, vol. 27, no. 3-4, pp. 371– 376, 1999.
[13] Y. M. Fan, L. Z. Xu, J. Gao et al., “Phytochemical and
antiinlam-matory studies onTerminalia catappa,”Fitoterapia, vol. 75, no.
3-4, pp. 253–260, 2004.
[14] A. N. Nagappa, P. A. hakurdesai, N. V. Rao, and J. Singh,
“Antidiabetic activity ofTerminalia catappaLinn fruits,”Journal
of Ethnopharmacology, vol. 88, no. 1, pp. 45–50, 2003.
[15] S.-C. Chu, S.-F. Yang, S.-J. Liu, W.-H. Kuo, Y.-Z. Chang, and Y.-S. Hsieh, “In vitro and in vivo antimetastatic efects of
Terminalia catappaL. leaves on lung cancer cells,” Food and Chemical Toxicology, vol. 45, no. 7, pp. 1194–1201, 2007. [16] N. B. Pandya, P. Tigari, K. Dupadahalli, H. Kamurthy, and R.
R. Nadendla, “Antitumor and antioxidant status ofTerminalia
catappaagainst Ehrlich ascites carcinoma in Swiss albino mice,”
Indian Journal of Pharmacology, vol. 45, no. 5, pp. 464–469. [17] T.-F. Ko, Y.-M. Weng, S.-B. Lin, and R. Y.-Y. Chiou,
“Antimu-tagenicity of supercritical CO2extracts ofTerminalia catappa
leaves and cytotoxicity of the extracts to human hepatoma cells,”
Journal of Agricultural and Food Chemistry, vol. 51, no. 12, pp. 3564–3567, 2003.
[18] S. Y. Mudi and A. Muhammad, “Antimalaria activity of
ethano-lic extracts of leaves ofTerminalia catappaL. Combretaceae
[indian almond],”Bayero Journal of Pure and Applied Sciences,
vol. 2, pp. 14–18, 2010.
[19] W. D. Ratnasooriya, M. G. Dharmasiri, R. A. S. Rajapakse et
al., “Tender leaf extract ofTerminalia catappaantinociceptive
activity in rats,”Pharmaceutical Biology, vol. 40, no. 1, pp. 60–
66, 2002.
[20] Y.-L. Lin, Y.-H. Kuo, M.-S. Shiao, C.-C. Chen, and J.-C. Ou,
“Flavonoid glycosides fromTerminalia catappaL,”Journal of the
Chinese Chemical Society, vol. 47, no. 1, pp. 253–256, 2000. [21] K.-T. Chung, T. Y. Wong, C.-I. Wei, Y.-W. Huang, and Y. Lin,
“Tannins and human health: a review,”Critical Reviews in Food
[22] I. Orr, “Oral cancer in betel nut chewersin travancore, its
etiology, pathology and treatment,”he Lancet, vol. 222, no.
5741, pp. 575–580, 1933.
[23] K. J. Ranadive, S. N. Ranadive, N. M. Shivapurkar, and S. V. Gothoskar, “Betel quid chewing and oral cancer: experimental
studies on hamsters,”International Journal of Cancer, vol. 24, no.
6, pp. 835–843, 1979.
[24] L. G. Butler and J. C. Rogler, “Biochemicalmechanisms of the
antinutritional efectsof tannins,” in Phenolic Compounds in
Food and heir Efects on Health. I, C.-T. Ho, C. Y. Lee, and
M.-T. Huang, Eds., vol. 506 ofACS Symposium Series, chapter 23, p.
298, American Chemical Society, Washington, DC, USA, 1992. [25] F. Marzo, A. Tosar, and S. Santidrian, “Efect of tannic acid on
the immune response of growing chickens,”Journal of Animal
Science, vol. 68, no. 10, pp. 3306–3312, 1990.
[26] T. Tanaka, G.-I. Nonaka, and I. Nishioka, “Tannins and related compounds. XL. Revision of the structures of punicalin and punicalagin, and isolation and characterization of
2-O-galloylpunicalin from the bark ofPunica granatumL,”Chemical
and Pharmaceutical Bulletin, vol. 34, no. 2, pp. 650–655, 1986.
[27] A. Cronquist,An Integrated System of Classiication of Flowering
Plants, Columbia University Press, New York, NY, USA, 1988. [28] F. A. Resende, J. M. Alves, C. C. Munari et al., “Inhibition of
doxorubicin-induced mutagenicity byBaccharis
dracunculifo-lia,”Mutation Research, vol. 634, no. 1-2, pp. 112–118, 2007. [29] J. M. Sforcin, R. O. Orsi, and V. Bankova, “Efect of propolis,
some isolated compounds and its source plant on antibody
production,”Journal of Ethnopharmacology, vol. 98, no. 3, pp.
301–305, 2005.
[30] D. P. D. S. Leit˜ao, A. A. Da Silva Filho, A. C. M. Polizello, J. K. Bastos, and A. C. C. Spadaro, “Comparative evaluation
of in-vitro efects of Brazilian green propolis andBaccharis
dracunculifoliaextracts on cariogenic factors ofStreptococcus mutans,”Biological & Pharmaceutical Bulletin, vol. 27, no. 11, pp. 1834–1839, 2004.
[31] P.-S. Chen, J.-H. Li, T.-Y. Liu, and T.-C. Lin, “Folk medicine
Ter-minalia catappaand its major tannin component, punicalagin, are efective against bleomycin-induced genotoxicity in Chinese
hamster ovary cells,”Cancer Letters, vol. 152, no. 2, pp. 115–122,
2000.
[32] N. Seeram, R. Lee, M. Hardy, and D. Heber, “Rapid large scale puriication of ellagitannins from pomegranate husk, a
by-product of the commercial juice industry,”Separation and
Puriication Technology, vol. 41, no. 1, pp. 49–55, 2005. [33] M. Kraszni, A. Marosi, and C. K. Larive, “NMR assignments and
the acid-base characterization of the pomegranate ellagitannin
punicalagin in the acidic pH-range,”Analytical and
Bioanalyti-cal Chemistry, vol. 405, no. 17, pp. 5807–5816, 2013.
[34] K. Robards, “Strategies for the determination of bioactive
phe-nols in plants, fruit and vegetables,”Journal of Chromatography
A, vol. 1000, no. 1-2, pp. 657–691, 2003.
[35] M. Ribani, C. B. G. Bottoli, C. H. Collins, I. C. S. Jardim, and L. C. F. Melo, “Validac¸˜ao em m´etodos cromatogr´aicos e
eletrofor´eticos,”Qu´ımica Nova, vol. 27, no. 5, pp. 771–780, 2004.
[36] W. Qu, A. P. Breksa III, Z. Pan, and H. Ma, “Quantitative deter-mination of major polyphenol constituents in pomegranate
products,”Food Chemistry, vol. 132, no. 3, pp. 1585–1591, 2012.
[37] D. M. Maron and B. N. Ames, “Revised methods for the
Salmonellamutagenicity test,”Mutation Research, vol. 113, no. 3-4, pp. 173–215, 1983.
[38] L. Bernstein, J. Kaldor, J. McCann, and M. C. Pike, “An empirical approach to the statistical analysis of mutagenesis data from the
Salmonellatest,”Mutation Research, vol. 97, no. 4, pp. 267–281, 1982.
[39] K. Mortelmans and E. Zeiger, “he AmesSalmonella
/micro-some mutagenicity assay,”Mutation Research, vol. 455, no. 1-2,
pp. 29–60, 2000.
[40] T. D. B. Machado, I. C. R. Leal, A. C. F. Amaral, K. R. N. Dos Santos, M. G. Da Silva, and R. M. Kuster, “Antimicrobial
ellagitannin ofPunica granatumfruits,”Journal of the Brazilian
Chemical Society, vol. 13, no. 5, pp. 606–610, 2002.
[41] A. J. Doig, D. H. Williams, P. B. Oelrichs, and L. Baczynskyj, “Isolation and structure elucidation of punicalagin, a toxic
hydrolysable tannin, fromTerminalia oblongata,”Journal of the
Chemical Society, Perkin Transactions 1, no. 8, pp. 2317–2321, 1990.
[42] F. Bressolle, M. Bromet-Petit, and M. Audran, “Validation of liquid chromatographic and gas chromatographic methods.
Applications to pharmacokinetics,”Journal of Chromatography
B, vol. 686, no. 1, pp. 3–10, 1996.
[43] R. E. Ardrey,Liquid Chromatography-Mass Spectrometry: An
Introduction, John Wiley & Sons, San Francisco, Calif, USA, 2003.
[44] L. R. Snyder, J. J. Kirkland, and J. L. Glajch,Practical HPLC
Method Development, John Wiley & Sons, New York, NY, USA, 2nd edition, 1997.
[45] S. Gupta, B. Saha, and A. K. Giri, “Comparative antimutagenic and anticlastogenic efects of green tea and black tea: a review,”
Mutation Research, vol. 512, no. 1, pp. 37–65, 2002.
[46] M. Labieniec and T. Gabryelak, “Response of DNA, proteins and membrane bilayer in the digestive gland cells of freshwater
mussel Unio tumidus to tannins exposure,”Toxicology in Vitro,
Submit your manuscripts at
http://www.hindawi.com
Stem Cells
International
Hindawi Publishing Corporation
http://www.hindawi.com Volume 2014
Hindawi Publishing Corporation
http://www.hindawi.com Volume 2014
INFLAMMATION
Hindawi Publishing Corporation
http://www.hindawi.com Volume 2014
Behavioural
Neurology
Endocrinology
International Journal of Hindawi Publishing Corporationhttp://www.hindawi.com Volume 2014 Hindawi Publishing Corporation
http://www.hindawi.com Volume 2014
Disease Markers
Hindawi Publishing Corporation
http://www.hindawi.com Volume 2014
BioMed
Research International
Oncology
Journal ofHindawi Publishing Corporation
http://www.hindawi.com Volume 2014
Hindawi Publishing Corporation
http://www.hindawi.com Volume 2014
Oxidative Medicine and Cellular Longevity
Hindawi Publishing Corporation
http://www.hindawi.com Volume 2014
PPAR Research
The Scientiic
World Journal
Hindawi Publishing Corporation
http://www.hindawi.com Volume 2014
Immunology Research
Hindawi Publishing Corporation
http://www.hindawi.com Volume 2014
Journal of
Obesity
Journal ofHindawi Publishing Corporation
http://www.hindawi.com Volume 2014
Hindawi Publishing Corporation
http://www.hindawi.com Volume 2014
Computational and Mathematical Methods in Medicine
Ophthalmology
Journal of Hindawi Publishing Corporationhttp://www.hindawi.com Volume 2014
Diabetes Research
Journal ofHindawi Publishing Corporation
http://www.hindawi.com Volume 2014
Hindawi Publishing Corporation
http://www.hindawi.com Volume 2014
Research and Treatment
AIDS
Hindawi Publishing Corporation
http://www.hindawi.com Volume 2014
Gastroenterology Research and Practice
Hindawi Publishing Corporation
http://www.hindawi.com Volume 2014
Parkinson’s
Disease
Evidence-Based Complementary and Alternative Medicine
Volume 2014