Vol-7, Special Issue-Number2-April, 2016, pp17-28 http://www.bipublication.com
Research Article
Changes in gene expression MEDIA- 4 in ovarian tissue of rats with
polycystic ovary experimental
Shahrzad Moradi1, Mohammad Reza Tabandeh2 and Kahin Shahani pour3 1
Postgraduate Student (MSc) Islamic Azad University of Falavarjan – IRAN.
2
Assistant professor Chamran University of Ahwaz – IRAN.
3
Assistant professor Islamic Azad University of Falavarjan – IRAN.
ABSTRACT
MEDIA-4 is a new hormonethat has recently been identifiedby microarray technique in rat and human fat tissue. The highest expression of this hormone is in fat tissue and then respectively in the tissues of the pancreas, heart muscle and the brain. MEDA-4 hormone expressions in these tissues in females are more than males.
The aim of this study suggests polycystic ovary induction effect on the fluctuation of MEDA-4 gene expression and its relation to metabolic factors changing. Due to identify new genes involved in the development of polycystic syndrome,new treatment programs have been proposed based on changes in expression of these genes or their receptors that have helped to treat this metabolic disorder. Therefore, newly discovered gene expression changes of MEDA-4 can be effective in designing treatment protocols based on variations of this gene in ovarian tissue.
The evaluation results of the correlation between gene expression of overian MEDA-4 and measured factors in the group with PCOS shows there is a positive relation between changes in gene expression MEDA-4 and factors of glucose, insulin and BMI at the level of p≤0.05 and has a significant positive relation with the amount of plasma progesterone at the level of p. 0.01. ≥
Moreover, MEDA-4 expression changes in patients with PCOS compared with healthy people are more and PCOS-induced lead to more gene expression of MEDA-4 and significantly increased the blood glucose.
In comparing the fasting insulin between groups, the insulin in PCOS group was higher than the healthy group with a significant difference (p <0.05). Insulin resistance to HOMA-IR, the insulin resistance in PCOS group was significantly higher compared with the healthy group (p <0.05). Unlike total testosterone, Plasma progesterone level of PCOS group has not a significant difference compared with the healthy group (p <0.05.(
Key words: polycystic, Meda-4 gene, adiponectins and are Adipocytokines
1-INTRODUCTION
Polycystic ovary syndrome (PCOS) is the most common endocrine disorders in females and is the most common cause of anovulation (Ehrmann, 2005). Patients are at risk for serious complications such as increased risk of endometrial and breast cancer, dyslipidemia, hypertension and cardiovascular disease and diabetes (Azziz, 2009). The prevalence of obesity and dyslipidemia in patients with PCOS is more than in healthy individuals. 40% of people with PCOS are obese and 75 percent of the mare infertile. (Ehrmann, 1999).
PCOS is seen with symptoms such as lack of menstruation (amenorrhea), hirsutism, and in 75 percent of women who are infertile due to a lack of ovulation and following a complex interaction between the disorder in gonadotropin, androgens and estrogen, it will be caused (Birgitte et al., 2005; Laven et al., 2002) . Polycystic ovary syndrome is observed in 10% of women at reproductive age and it is associated with metabolic disorders and insulin resistance, and may underlie hormone-sensitive cancers (Cristello and Associates 2005 ). Due to identify new genes that are effective in the development of polycystic syndrome, based on changes in expression of these genes or their receptors, new treatment programs have been suggested that have been helped to treat the metabolic disorder. Therefore, identifying changes in newfound gene expression of MEDA-4 could be effectivein designing treatment protocols based on variations of this gene in ovarian tissue.
In recent years the discovery of fat hormones known as adipocytokines and changes in protein and gene expression of these hormones in reproductive tissues such as the ovary (Tabandeh et al., 2012) and high relation of these changes in the development of insulin resistance, obesity and polycystic ovary syndrome have created a new vision in recognizing the outbreak mechanism of PCOS and new treatments. Among these hormones, we can refer to leptin, adiponectin and Visfatin that their changes in the plasma and adipose tissue have been reported without breaking of diabetes type 2, insulin resistance and the development of PCOS. Inobese humans and animals’ adipocytes,high secretion of inflammatoryAdipocytokine such as TNFα, IL -6, resistine and decreasing factors of insulin sensitivity such as leptin, adiponectin and Visfatin havebeen reported. (Tabandeh et al., 2012 and 2010).
2-Research Background
Diamanti Kandarakis and crystal, in 2005, concluded that in patients with PCOS, insulin resistance and hyperinsulinemia are commonly seen. Insulin resistance and hyperinsulinemia
have a role in ovarian dysfunction ofsteroidogenic in PCOS. The most common cause of insulin resistance and compensatory hyperinsulinemia is obesity. However, despite the high prevalence of obesity in PCOS, obesity alone is not justifying this important association.
The MEDA-4 gene was first isolated and cloned in the study of Zhang et al., (2011) from adipose tissue. The amino acid sequence of this protein in humans and rat, there are more than 90% similarity. Overexpression induced of MEDA-4 in adipocytes category 3T3-L1 lead to an increase in the movement of glucose transporter 4 and insulin-dependent glucose uptake and increased uptake of free fatty acids due to increased transport expression of CD36. The results confirmed that the expression of MEDA-4 in FOKO (five months) ratshas increased; however, no significant change as blank has happened thatis the indication ofinherent optional lipoma gene regulation. MEDA-4 expression also was found by Q-PCR among several rats tissues, mRNA MEDA-4 in both sexes in white lipoma storage tissue had more expression.
Amanitin 1 is a visceral lipoma dedicated secreted protein that was identified byYang and his colleagues in 2006from a set of human Amntal fat CDNA that is synthesized by visceral fat tissue in humans and monkeys.
compared to control group. Amanitin 1 at mRNA and protein levels in amntal adipose tissue in non-obese women with PCOS is reduced compared with controls . Mahd et al. in 2009 showed that 93.33 and 98.30 percent of PCOS patients gave abnormal amanitin1 to insulin and amanitin 1 to Resistin ratios, respectively.
3-MATERIALS AND METHODS
In this study, 20 adult female Sprague-Dawley rats that had not done mating before; with an average weight of 20 ± 150 g were purchased fromlaboratory animals’ Breeding Centre of Ahwaz University Medical Sciences and were used. Animals were transported to animals’ House in Veterinary Medicine of Biochemistry department and were kept under conditions of 12 hours light and 12 hours of darkness. All rats in the study period, had access to food and water freely. During the study period the animals kept at 2 ± 23 ° C. Animals’ food was prepared from Pars Livestock and poultry feed factory. At least five rats were kept in standard cages and animals’ floors were replaced at least every other day. All animals were kept for a week, to comply with new environmental conditions, and then the research process was begun.
In PCOS rat’s group, with single dose mg / kg 4 injections of estradiol benzoate drug, dissolved in 0.2 ml sesame oil with intramuscular injection, the polycystic ovary were induced. To verify cysts, 25 days after the injection of estradiol benzoate, daily between 9:30 to 10:30 am, vaginal smears were taken
from the rats. To do this 10
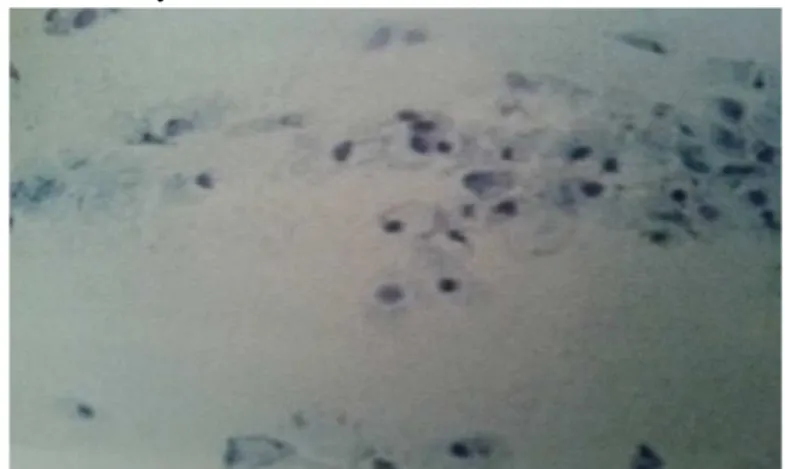
microliterphysiological saline was injected into the vagina, and then was collectedthe cells that were peeled off from the vaginal opening by a thin glass rod and were spread on thelam and were examined by a lens of 40 and at least in three microscopyfields to determine the stage of estrus Cycling. Most horny cells without nuclei in the samples, which are in estrus time and sustainability of this state for at least 10 days showed cysts in them, also the external appearance of vaginal opening with a pale pink color and low humidity in the final days, was
confirming their intended position. Also in this period, healthy rats showed regular estrus cycle. After these steps, three rats were killed and thepresence of polycystic ovary was confirmed in them (Victor et al., 2004).
The animals were divided randomly into two groups as follows:
1. The healthy group; received normal rat’s food and 0.2 ml of normal saline is injected with sesame oil in them. (10 = n)
2. Group with cysts: were received normal foods of rats. Induced PCO was performed according to the method described in the text. (10 = n). At the beginning and the end of the study, rats were weighed and at least 4 weeks after induction of PCOS in rats with ovarian cysts and healthy rats, the animals were euthanized with high doses of anesthetic. Ovaries were removed and kept at -70 degrees in the freezer immediately after blood collection. Blood Serum in each sample was also separated and kept for measuring the serum parameters.
- For the measurement of glucose (mg / dl) based on providing a method by Pars company, free hydrogen peroxide from the glucose test in the presence of glucose oxidase enzyme with phenol and 4 Aminoanti Perrin, in the presence of peroxidase enzyme will form Quinone-imine. The created quinoneimine has a direct relation with glucose of the solution. - Insulin hormone, according to the instructions of an ELISA kit (Mercodia, Sweden), was measured in 96-well plate. Considering an ELISA kit respectively, had 0 to 7 (µg / L) standard.
- Testosterone hormone, according to the instructions of ELISA kit (DRG, Germany) and it was measured in 96-well plate. Considering an ELISA kit respectively, had 0 to 6 (ng / mL) standard.
which weight is in grams and height is in cm, animals’ BMI were calculated.
BMI =
Body length was measured from the tip of the snout to the base of the tail. - To calculate the HOMA index, the fasting insulin and glucose were measured in animals and was calculated by using the following formula.- RNA extraction was done by using the guanidinium acid-isothiocyanate-phenol-chloroform method (Sacchi and Chomeznski, 2006). Before beginning the extracting, the ovarian tissue was ground by using liquid nitrogen.
- in order to Eliminate the extracted DNA with RNA, all RNA samples before using them in the synthesis of cDNA with DNase (Fermentas, Germany) were treated.- After RNA extraction and treatment with DNase enzyme, its concentration was calculated by using sample absorbance reading at 260 nm with spectrophotometer Biophotometer (Eppendorf, Hamburg, Germany). If the absorption ratio 280/260 was above 1.8, the samples were used for cDNA synthesis.
- CDNA synthesis by using a commercial kit
(Amplisense, Russia) was done in reaction with volume of µl20. The considering kit contained 4 storage solutions including RT-mix (125 µl), Revetase, Buffer DNA and RT-G-mix.
Table 1: The amount of solutions used in the research
Combination Volume (µl)
Treated DNA with
DNAse
10 microliter
Ready solution
6 microliter
All samples were placed at 37 ° C for 60 minutes.
Distilled water
4 microliter
-
List ofprimers used inthisstudy, the sequence, thelength ofa segmentthatisamplifiedbythemand the connectiontemperature ofeachisshown in Table5-3. PCR reaction volume was considered 25microliter. In order todetermine theappropriatetemperatureof primer connection as well asthe bestconcentrationofMagnesium chloride(MgCl2)forChemerin gene, 1, 2and3mMmagnesium chloride concentrations andtemperatures of62-54° Cwas tested. Forconducting the PCR reactionin a0.2mlmicro tube, the followingcompoundswere added subsequently.
Table 2: quantities of chemical compounds used in the research
Table 3: list, the sequence and properties of the primers used in this study
- In
order to data Statistical analysis the SPSS16.0 software was used. All data are based on averages.- The Standard deviationwas shown. A Significance level of Statistical tests for all tests was consideredp<0.05. In order to compare the different averages of oneway analysis of variance test (ANOVA) and Newman post-test was used.
4. RESULTS
To verify cysts, 25 days after the injection of estradiol benzoate, vaginal smears were taken daily from the rats and the presence of
Product size (bp) Accession numbe Tm (°C) Sequence Gene 13 NM02519,3 58 F: ACAAGTACGAACCCAGAAAAGAAAG MEDA-4 58 R: ATTGAACCTCTAGATGTGACGCTAA 101 001034055 58 F: CTCATCTACCTCTCCATCGTCTG GAPDH 62.8 R: CCTGCTCTTGTCTGCCGGTGCTTG
chemical compound Volume
(µl)
PCR x10 buffer 2.5
Mixture mM, dNTP 10 0.5
Magnesium chloride mM50 0.5
Front Primer µM 10 0.5
Back Primer µM 10 0.5
Cdna 3
Enzyme Taq DNA polymerase U5 0.25
dominant horny cells without nuclei in the samples taken for at least 10 days showed the
creation of cysts in them.
Figure 1 Horny cells (keratin) vaginal smears stained with Giemsa
Ovarian cysts in ratsafter 42 days injection of estradiol benzoate to them, then killed and autopsy, was observed and confirmed. (Figure 4-2 and 4-3).
Figure 2 - polycystic ovarian, cyct is clearly visible
Figure 3- comparative display of polycystic and healthy ovarian
Figure 4 - electrophoresis band of polycystic ovary
4-1-MEDIA-4 gene expression changes in ovarian tissue of different groups
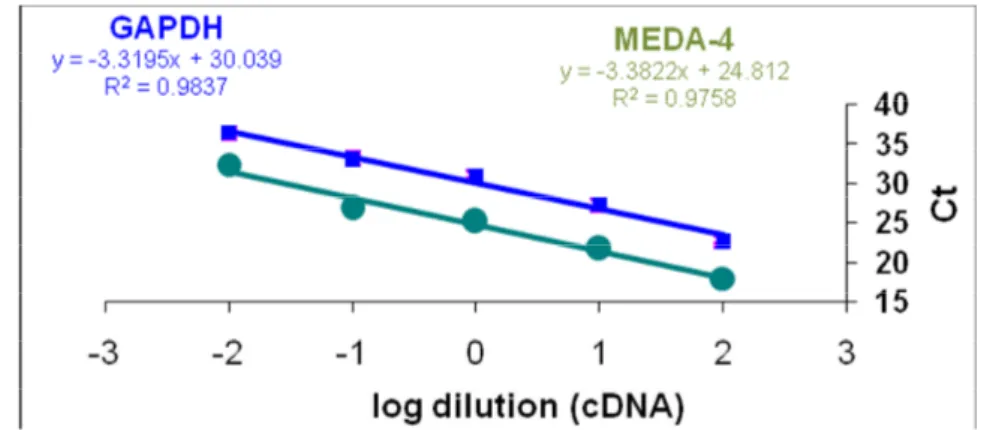
According to the selecting comparative method of Ct gene expression in this study, GAPDH gene
amplification efficiency and MEDA-4 gene should be approximately equal. For this purpose, a standard log curve, diluted standrad values for each gene (log input) (MEDA-4 gene and GAPDH gene as a calibrator) against Ct values for each gene, was drawn. In the case of eachgene, Ct average values of different concentration in two repetitions were calculated and the CT values of the MEDA-4 gene and GAPDH gene were calculated separately. Then by putting inputlog values on the x-axis and Ct values of each gene on the y-axis , XYscatter graph was drawn and line formula was derived according to the y = ax + b formula. Figure 1-4 shows Ct value changes of MEDA-4 and GAPDH gene at different dilutions of cDNA. Performance of target and calibrator gene amplification was approximately equal to about 1.9
.
Figure 1. Ct values changes against different dilutions of cDNA (100, 10, 1, 0.1 and 0.01) MEDA-4 and GAPDH gene when amplified by PCR in the real time.
The results of the melting point curve related to the MEDA-4 gene amplification by using real-time PCR reaction and fluorescent dye SYBR GreenI are in Figure 2. Tm samples was obtained 83.58
.
Chart 2 - MEDA-4gene amplification melting point curve
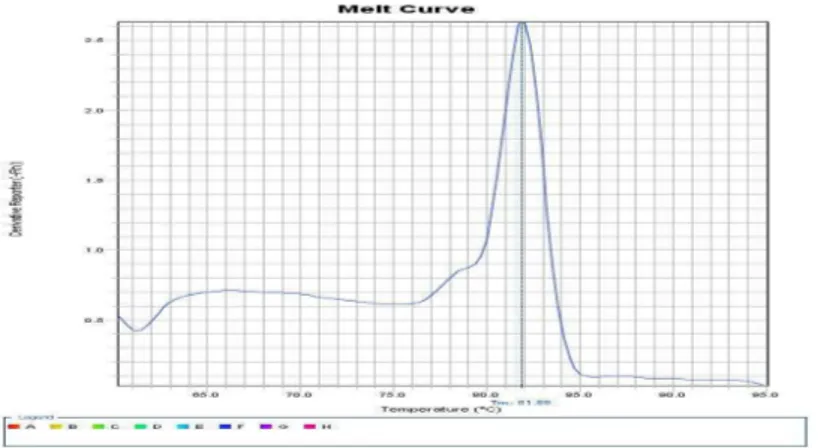
The results of the meltingpoint curve related to GAPDH gene amplification by using real-time PCR reaction and fluorescent dye SYBR GreenI is shown in Figure 3. Tm samples wereobtained 81.88
.
Figure 3 GAPDH gene amplification melting point curve
As shown in Figure 4.4, the MEDA-4 gene expression in the PCOS group, was higher than the healthy group (P <0.05) and induction of PCOS leads to increased expression of the MEDA-4gene.
Figure 4: comparison of the average and standard deviation (SD ±) of relative MEDA-4 gene expression in ovarian tissue in controls and patient group with PCOS.
4-2-Comparison of fasting blood glucose amount between groups
As shown in Figure 5, the induction of PCOS leads to a significant increase in blood glucose levels compared to the control group (p <0.05).
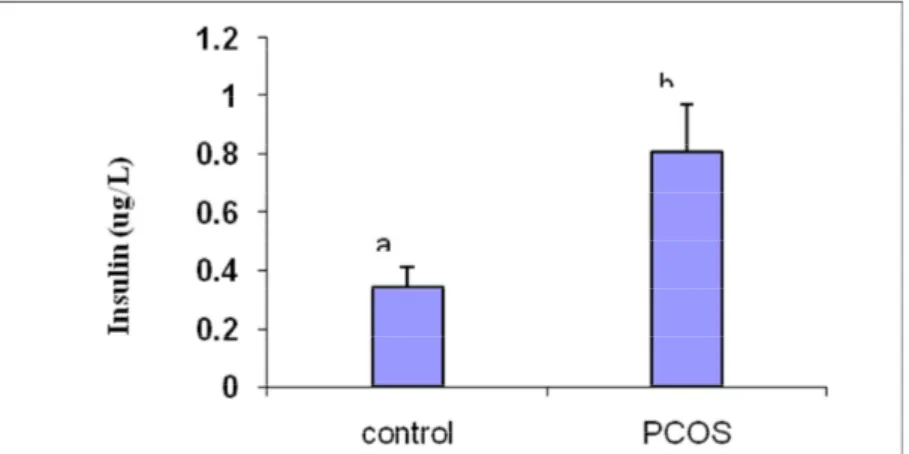
4-3-Comparison of fasting insulin among groups-As shown in Figure 4-6, the insulin in PCOS group was higher than the healthy group with a significant difference (p <0.05).
Chart 6- an average and standard deviation (SD ±), fasting insulin levels (g / L) blood serum in control and patient groups with PCOS. Dissimilar letters above each column indicate significant differences at P <0.05. 4-4-comparing insulin resistance index HOMA-IR
As shown in Figure 7, the insulin resistance in PCOS group had higher significant differencesthan in the healthy group (p <0.05).
Figure 7- comparing the average and standard deviation (SD ±), insulin resistance index (HOMA Index) in the control and patient group with PCOS. Dissimilar letters above each column represents a significant difference in the level of p <0.05.
4-5-The results of the testosterone amount between groups
As shown in Figure 8, the serum total testosterone levels in PCOS group were higher than the control group with a significant difference (p <0.05).
4-6- comparing results of progesterone levels between groups
As shown in Figure 4-9, the plasma progesterone level of PCOS group had no significant difference compared with the healthy group (p <0.05).
Figure 9. Comparing the average and standard deviation (SD ±), progesterone levels (ng / ml) of the blood serum in control and patient groups with PCOS. Dissimilar letters above each column represents a significant difference in the level of p <0.05
.
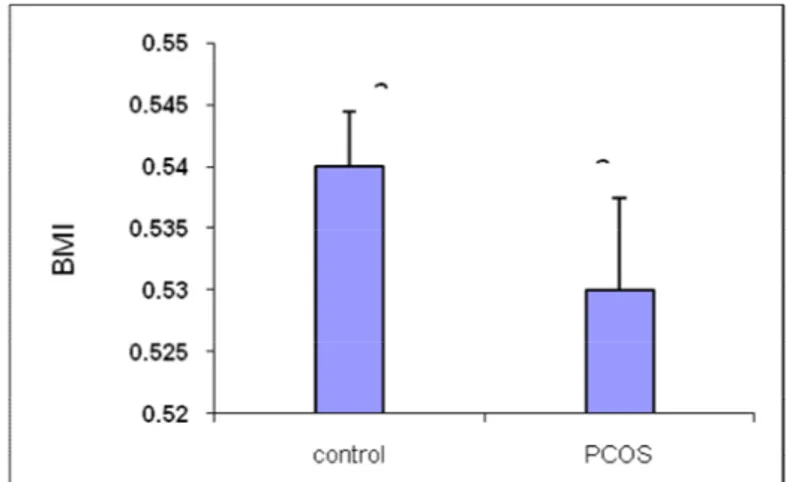
4.7 BMI comparison results between groups
As shown in Figure 4-10, the BMI level in PCOS group was significantly higher than in the healthy group (p <0.05).
Figure 10. BMI level in PCOS group was significantly higher than the healthy group (p <0.05). 4-8-The correlation results between
MEDIA-4 gene expression and metabolic factors According to Table 4, there is a positive relation between MEEA-4 gene expression changes and glucose, insulin and BMI factors at the level of p≤0.05 and a significant positive relation was seen with plasma progesterone at the level of p≤0.01.There is a positive relation between MEDA-4 gene expression changes in adipose tissue and serum testosterone levels, but this was not significant
.
Table 4 - various parameters relation based on the Pearson correlation tes
Variable
gene expression MEDA-4
R P
Glucose **0.812 0.0087
Insulin **0.741 0.0092
(HOMA-IR) *0.652 0.0227
Testosterone 0.337 0.069
Progesterone *0.674 0.0197
BMI **0.723 0.0097
ovarian tissue. This hormone was first identified in the study that conducted on rats with receiver genetic defect FSH (FORKO) and from adipose tissue. The highest expression of this hormone is in adipose tissue and then respectively in the tissues of the pancreas, heart muscle and the brain (Zhang et al., 2011). Gene expressions in more differentiated adipose cells aremore than pre-adipocytes. Gene expression in visceral adipose tissue of obese women has been reported more than subcutaneous adipose tissue. MEDA-4 gene expression in the mentioned tissues of the male sex is more than female (Zhang et al., 2011). The results of the study also showed that with PCOS-induced, theMEDA-4 gene expression will increase compared to rats with normal ovarian function. That is indicating the regulatory role of this hormone in thePCOS pathogenesis.
Recent findings have shown that insulin resistance and Hyperinsulinemia in PCOS has a close relation with the presence of inflammatory cells in the ovarian tissue, in particular fromthe population of macrophage, which causes chronic inflammation and release of various cytokines (Ventord et al. , 2010). A study on the role ofMEDA-4 hormones in the development of inflammatory reactions is not available.
Recently a hormone has been identifiedand isolated with a similar function in FORKO rats known as MEDA-7 andits increasing expression in adipose tissue is associated with the development of inflammatory reactions. According to new findings regarding the MEDA-7 gene localized in a group of pro-inflammatory macrophages, pre-pro-inflammatory role of this hormone in the development of chronic inflammation and help to increase insulin resistance has been proposed (Zhang et al., 2011). According to the similar pattern observed, increased expression of MEDA-4 in ovarian tissue that was at the same time with gaining weight in rats with PCOS in this study, this possibility can be raised that MEDA-4 mayhave a role in creatingthe inflammatory process of patients’ ovarian tissue with PCOS
that is essential to be examined in a separate study.
In this study, increasing BMI was observed 45 days after induction of PCOS at the same time with insulin resistance in PCOS rats. The results of a recent study that was conducted by Tabandeh and colleagues show that,MEDA-4 gene expression in adipose tissue of rats that were fed with high-energy diet suffering from diabetes type 2 will increase with coincides of the insulin resistance and obesity development. Based on theresearch results it can be concluded that probably inrats with high BMI in Hyperandrogenism model, overexpression of MEDA-4 has a role in ovarian with development of insulin resistance in ovarian tissue and the development of PCOS.
In this study, an increase in insulin resistance index HOMA-IR in rats with PCOS had a significant increase compared to the control group. Similar to this research result, in the study of Zhang et al., The highest average of insulin was reported in hyperandrogenism group and polycystic ovary (Zhang et al., 2008). The results of the study that was conducted in 2011, showed that the insulin level in polycystic ovary syndrome (PCOS) is increased (Traub, 2011).
Induced PCOS has led to a significant increase in blood glucose, group insulin, insulin resistance, BMI, serum testosterone compared to control group, but the plasma progesterone levelPCOS had no significant difference compared to thehealthy group.
samples that may be caused from hyperinsulinemia, it can be concluded that the increased MEDA-4 expression is due to the lowering effect of estrogen on the expression of this gene ininduced PCOS
In laboratory studies with Theca cell cultures of polycystic ovaries, it has been shown that insulin clearly will increase the progesterone and andrestandion productioncompared to larger normal theca cells. In particular, it has been proven that insulin increases its receptors and androgen production in bigger theca cells inpolycystic ovaries.
Andrestandion will produce by insulin alone, and more importantly, it can have an important role with LHsynergistically to increase androgen biosynthesis (Diamanti and Papavasylio, 2006). In this study, the high amount of testosterone in rats with PCOS was observed that simultaneouslyby increasing insulin resistance and MEDA-4 gene expression; we canrefer to the possible role of testosteron in increasingMEDA-4 gene expression that needs more researches in the cell culture environment.
The evaluation results of the correlation betweenovarianMEDA-4 gene expression and measured factors in the group with PCOS showed that a positive relation was observed between changes in MEEA-4 gene expression and factors of insulin resistance index (glucose, insulin and BMI) and serum testosterone levels. However, Progesterone changes in this study, was not so obvious. . In the analysis of progesterone level, we should also bear in mind the fact that the lifetime of the corpus luteum in female rats is only two days and the sexual cycle stage has a great impact on blood progesterone levels.
In this study due to the lack of MEDA-4serum measuring kit, levels of this hormone were not measured in plasma. However,about other adipocytokine changes in serum and the incidence of PCOS, several studies are available that show changes in serum levels of these hormones in conjunction withits expression local changes in tissues such as the ovaries.
Visfatin is the diabetogenic and an immune system regulator factor (Toy- Mazakio et al., 2009). In PCOS condition, the concentration of plasma omentin in non-obese women will decrease with normal glucose tolerance and PCOS in insulin-resistant obese women will decrease with PCOS compared to the control group. (Tan, 2007; Choi, 2011).
By measuring, the liver level of RBP4 that transform retinol from the liver to the target tissues, it was found that women with PCOS compared with healthy individuals have higher levels of RBP4 (Vikenheysar et al., 2005). PCOS have no effect on LCN2 levels, insteadthe obesity will be with increased serum ofLCN2 (Panidis et al., 2003; Koiou et al 2012.). In patients with PCOS, Tan and his colleagues in 2009 have identified a significant increase in serum Chemerin, Amntal adipose tissue chemerin mRNA level and subcutaneous and protein expression.
In total, the results of this study show that the newadipocytokine MEDA-4 gene expression in ovarian tissue of rats with PCOS caused by Hyperandrogenism will increase. These changes are associated with increased factors related to insulin resistance such as glucose and insulin, indicating a possible role of thisadipocytokinein the pathogenesis of PCOS disease that should be evaluated at the molecular level in its future mechanism study. The results of this study, show high levels of MEDA-4 gene expression in adipose tissue of the group that has polycystic ovary.
1- Is the induction of polycystic syndrome causing changes in MEDA-4gene expression in ovarian tissue?
2-Is changes in MEDA-4 gene expression in ovarian tissue of PCO associated with insulin resistance index changes?
3- Is changes in MEDA-4 gene expression in ovarian tissue of PCO associated with plasma metabolic factors changes?
REFERENCE
syndrome: The complete task force report. Fertility and Sterility, 2009;91:456.
2. Birgitte B, kamille S, Per O, et al. (2005). Is
metformin therapy for PCOS safe during pregnancy and Cilinical Pharmacology and Toxicology, 96:410-412.
3. Laven JS, Imani B(2002).New apparoach to polycystic ovary syndrome and other forms of anovulatoryinfertility. Obstetrical & gynecological survey,57(11):755-67.
4. Cristello F, Cela V, Artini PG, et al. (2005).
Therapeutic sterategics for ovulation
induction in patients with polycystic
ovary syndrome. Gynecological
Endocrinology, 21(6):340-52.
5. Choi KM, Kim JH, Cho GJ, Baik SH, Park HS & Kim SM 2007 Effect of exercise training on plasmavisfatin and eotaxin levels. European Journal of Endocrinology 157 437–442.
6. Diamanti-Kandarakis E & Dunaif A 2012 Insulin resistance and the polycystic ovary syndrome revisited: an update on mechanisms and implications. Endocrine Reviews 33 981–1030.
7. Erickson GF, Magoffin DA, Cragun J.R, et
al. (1990). The effect of insulin-like growth
factor-І and п on esteradiol production by
granulose cells of polycystic ovaries. Journal of Clinical Endocrinology and Metabolism, 70:894-902.
8. Evanthia Diamanti K, Papavasiliou AG.
(2006). Molecular mechanism of insulin resistance in poly - cystic ovary syndrome.
Trends in Molecular Medicine, 12:324--
333.
9. -Mahde A, Shaker M & Al-Mashhadani Z 2009 Study of omentin1 and other adipokines and hormonesin PCOS patients. Oman Medical Journal 24 108–118.
(doi:10.5001/omj.2009.25)
10. OConnor A, Phelan N, Tun TK, et al.
(2010). High-molecular-weight
adiponection is selectivelyreduced in women with polycystic ovary syndrome dependen of body mass index and severity ofinsulin resistance. Journal of Clinical
Endocrinology and Metabolism,
95(3):1378-85.
11. Park MC, Chang SJ, Park YB, et al. (2009). Proinflammatory effect of on periphernal blood ononuclearcells of patients with ankylosing spondylitis. Joint Bone Spine, 76:170-5.
12. Tabandeh MR, Hosseini A, Saeb M, et al. (2010). Changes in the gene expression of adiponectin andadiponectin receptors (AdipoR1 and AdipoR2) in ovarian follicular cells of dairy cow at differentstages of development. Theriogenology, 73:659-669.
13. Tabandeh MR, Kafi M, Hosseini A, et al. (2012). Novel gene expression pattern of adiponectin andadiponectin receptors in dominant and nondominant follicles and oocytes screened for their develop - mental competence based on brilliant cresyl blue staining in cattle. Animal Reproduction Science,44:304-305.
14. Tan S, Hahn S, Benson S, et al. (2007). Metformin improves polycystic ovary syndrome symptomsirrespective of pre-treatment insulin resistance. European Journal of Endocrinology, 157(5):669-76. 15. Zhang J, Wu Y, Zhang Y, Leroith D,
Bernlohr DA & Chen X 2008 The role of lipocalin 2 in theregulation of inflammation in adipocytes and macrophages. Molecular Endocrinology 221416–1426. (doi:10.1210/
me.2007-0420)
16. Zhang J, Zhou L, Tang L & Xu L 2011 The plasma level and gene expression of resistin
in polycysticovary syndrome.
Gynecological Endocrinology 27 982–987.
(doi:10.3109/09513590.2011.569794)