Submitted20 September 2016 Accepted 6 December 2016 Published18 January 2017
Corresponding author
Zehua Wang, [email protected]
Academic editor Maria Patrizia Stoppelli
Additional Information and Declarations can be found on page 12
DOI10.7717/peerj.2873
Copyright 2017 Xiao et al.
Distributed under
Creative Commons CC-BY 4.0
OPEN ACCESS
Comparison of different sample
preparation methods for platinum
determination in cultured cells by
graphite furnace atomic absorption
spectrometry
Man Xiao1,*, Zaiju Huang1,*, Jing Cai1, Jinghui Jia2, Yuzeng Zhang3,
Weihong Dong1and Zehua Wang1
1Department of Obstetrics and Gynecology, Union Hospital, Tongji Medical College, Huazhong University of Science and Technology, Wuhan, China
2Department of Obstetrics and Gynecology, Air Force General Hospital, PLA, Beijing, China
3Department of Occupational and Environmental Health, School of Public Health, Tongji Medical College, Huazhong University of Science and Technology, Wuhan, China
*These authors contributed equally to this work.
ABSTRACT
Background. Platinum-based agents are widely used in chemotherapy against solid tumors and insufficient intracellular drug accumulation is one of the leading causes of platinum resistance which is associated with poor survival of tumor patients. Thus, the detection of intracellular platinum is pivotal for studies aiming to overcome platinum resistance. In the present study, we aimed to establish a reliable graphite furnace atomic absorption spectrometry (GFAAS)-based assay to quantify the intracellular platinum content for cultured cells.
Methods. Several most commonly applied cell preparation methods, including 0.2% HNO3, 0.2% Triton X-100, concentrated nitric acid, RIPA combined with concentrated
nitric acid and hydroxide, followed by GFAAS for platinum detection were compared in ovarian, cervical and liver cancer cell lines to obtain the optimal one, and parameters regarding linearity, accuracy, precision and sensitivity were evaluated. Influence of other metals on platinum detection and the storage conditions of samples were also determined.
Results. The treatment of cells with 0.2% HNO3was superior to other approaches with
fewer platinum loss and better repeatability. The recovery rate and precision of this method were 97.3%–103.0% and 1.4%–3.8%, respectively. The average recoveries in the presence of other metals were 95.1%–103.1%. The detection limit was 13.23 ug/L. The recovery rate of platinum remained acceptable even in cell samples stored in−20◦C or−80◦C for two months.
Discussion. After comparison, we found that 0.2% HNO3was optimal for intracellular
SubjectsCell Biology, Drugs and Devices, Oncology
Keywords Platinum, Method, Cells, GFAAS
INTRODUCTION
Platinum complexes are first-line chemotherapy agents for treatment of numerous solid malignancies, including tumors from ovary, testes, bladder, head and neck, cervix and lung (Lebwohl & Canetta, 1998;Rosenberg, 1985). Nevertheless, the therapeutic outcome of platinum complexes is largely impaired by drug resistance. The mechanisms of platinum-resistance mainly include reduced drug accumulation, elevated levels of glutathione and metallothionein, enhanced DNA repair capacity, and inhibition of apoptosis (Holohan et al., 2013;Zisowsky et al., 2007). It is therefore of great interest to identify a reliable assay offering accurate assessment of intracellular platinum in tumor cells.
With regard to the techniques for metals determination in a variety of sample types, atomic absorption spectrometry (AAS), high performance liquid chromatography (HPLC) and inductively coupled plasma-mass spectrometry (ICP-MS) are frequently employed in most research teams. AAS encompasses the technique of flame atomic absorption spectrometry (FAAS) and flameless atomic absorption spectrometry; the latter mainly includes graphite furnace atomic absorption spectrometry (GFAAS). With higher tolerance to inorganic and organic matrices and higher sensitivity compared with FAAS, GFAAS has been enjoying a high reputation as a mature and sensitive technique used in routine determination of metal contents (Chappuy et al., 2010;Dessuy et al., 2011;Lewen, 2011). With spectrophotometric, fluorescence, electrochemical and quenched phosphorescence detection methods, HPLC is characterized with high specificity and selectivity (Boiteau et al., 2013;Khuhawar & Arain, 2005;Santa, 2013). ICP-MS has captured increasing attention in recent years with substantially lower detection limits and advantages for multi-element analyses over GFAAS (Fukui et al., 2011;Ikeda et al., 2011;Lewen, 2011). Nevertheless, the time consuming operation (e.g., liquid-liquid back extractions) of HPLC is a disadvantage especially when a large number of samples need to be analyzed simultaneously as in toxic kinetic studies (De Baere et al., 2012). Additionally, the equipment and consumables (e.g., immunoaffinity columns and nebulizer) for HPLC and ICP-MS are more expensive than those for GFAAS (De Baere et al., 2012;Lewen, 2011). Hence, with respect to time-consumption, cost and complexity, GFAAS might represent an alternative to HPLC and ICP-MS for the determination of single element such as platinum.
byYe et al. (2014). Nevertheless, most of the existing methodological researches on the usage of GFAAS are restricted to biological and industrial materials. The literature regarding the determination of platinum in cultured cell lines by GFAAS is quite limited, though the tumor cells culturedin vitroare widely employed in studies investigating drug resistance mechanisms. To address this issue, we aimed to identify a reliable GFAAS-based assay to determine the intracellular platinum content especially for cultured cells.
Sample preparation, for both tissues and cultured cells, counts a lot for an accurate measurement of platinum concentration. Without connective fibers, the time-consuming, hazardous lyophilization and wet ashing for tissue digestion are unnecessary. Several sample preparation procedures for cultured cells such as 0.2% and 0.6% nitric acid (HNO3) (Burger
et al., 2010;Davis et al., 2012), 0.2% and 1% Triton X-100 (Burger et al., 1997;Yunos et al., 2011), concentrated nitric acid (Buss et al., 2011;Kalayda, Wagner & Jaehde, 2012;Rotte et al., 2010;Zisowsky et al., 2007) and hydroxide (Noordhuis et al., 2008) have been used for platinum analysis using flameless AAS (graphite tube were used) and GFAAS. In addition, another cell processing procedure (a lysis buffer +concentrated nitric acid) followed by HPLC on line with ICP-MS was also used for platinum determination (Federici et al., 2014). Nevertheless, the lack of a systematic methodological quality assessment of these assays made it blind for researchers to select an appropriate method to measure platinum concentration in cells. We therefore compared the most widely used sample processing procedures to obtain an optimal GFAAS-based assay with simplicity, veracity, and sensitivity for determination of platinum concentration in cultured cells.
MATERIALS & METHODS
Reagents
Analytical grade reagents were used exclusively. Cisplatin and Triton X-100 were respectively purchased from Qilu pharmaceutical company (China) and Amresco (America). Concentrated nitric acid (10014518), standard solutions of Ca (40272064), Mg (53203671), Zn (53205273), Cu (53205181), K (40243861), Na (40262163), Mn (53204676) and Fe (40940260) were obtained from Sinopharm Chemical Reagent Co., Ltd, Shanghai, China. Different concentrations of nitric acid and Triton X-100 and a standard solution of 300 ug/L platinum were prepared with deionized water, which was obtained from the SNW ultra-pure water system with a resistivity of 18.2 M (Heal Force, Shanghai, China).
Cell lines and cell culture
Human epithelial ovarian cancer A2780 (ECACC) and CAOV3(ATCC) cells, cervical cancer
HeLa (ATCC) cells and liver carcinoma Hep G2(ATCC) cells were cultured in RPMI-1640
medium (Gibco, USA) supplemented with 10% fetal bovine serum (Gibco, Billings, MT, USA) in a humidified atmosphere containing 5% CO2at 37◦C. Cisplatin-resistant
were discarded. One of the aliquots was removed for protein content measurement via Bradford method (Beyotime Biotechnology, Haimen, Jiangsu, China), the others for platinum determination. The intracellular platinum levels were expressed as ng of Pt per aliquot or ng of Pt per mg of protein. The present study was approved by the ethical committee of Union Hospital, Tongji Medical College, Huazhong University of Science and Technology, China (Approval number: 2014073).
Sample preparation and operating condition of instrument
All cell aliquots were kept frozen (−20◦C) until the day for GFAAS analysis. Immediately after thawing, cell pellets were respectively processed according to following procedures:① 0.2% HNO3at room temperature (Burger et al., 2010),②0.2% Triton X-100 on ice (Burger
et al., 1997),③concentrated nitric acid at 60◦
C for 20 min (Rotte et al., 2010;Zisowsky et al., 2007),④concentrated nitric acid at 80◦C for 1 h (Buss et al., 2011;Kalayda, Wagner &
Jaehde, 2012),⑤RIPA (Beyotime Biotechnology, Haimen, Jiangsu, China) complemented with concentrated nitric acid at 60◦
C for 2 h (Federici et al., 2014) and⑥2 M NaOH at 55◦
C overnight subsequently neutralization with 1 M HCl (Noordhuis et al., 2008). The platinum lamp used in this work was operated at a current of 10 mA. Analysis was performed using an atomic absorption spectrometer (SpectrAA-240 FS; Varian, Palo Alto, CA, USA) to monitor the platinum absorbance at 265.9 nm corrected by deuterium background signals, with a slit width of 0.2 nm. Argon was used as the inert gas in all analyses. Standard solutions and samples were injected in duplicate on the platform inside the graphite tube by the auto-sampler needle. The furnace was programmed to execute a 75-s drying phase at 85–120 ◦
C, followed by 8-s of ashing at 1,000◦
C, then a 4.9-s atomization at 2,700◦C.
With 300 ug/L platinum solution as standard mother liquor, the blank and preparation solutions were the corresponding cell processing liquid mentioned above. The platinum standard addition solutions (60 ug/L, 120 ug/L, and 240 ug/L) used in this study were automatically generated by the instrument based on the mother liquor. Matrix effect was corrected on the pattern of standard addition. Calibration curves of different sample preparation methods were drawn according to the absorbance of standard addition solutions and correlation coefficients of all curves were calculated.
Accuracy and precision
Accuracy is defined as the agreement between the observed value and the true value and expressed as recovery rate in a percentage form. For the assessment of accuracy, high (125 ug/L), medium (85 ug/L) and low (45 ug/L) concentration standard solutions were added to corresponding high (110.9 ug/L, Hep G2), medium (96.5 ug/L, A2780) and low (48.6 ug/L, A2780) concentration samples (Shah et al., 1991;Westgard, 1981). Then, the three mixtures of standard solutions and samples were analyzed for six times. The average recovery rate was calculated as following: (average value of sextuple tests—sample concentration)/ concentration of standard solution. Generally, 90 to 100% recovery was considered acceptable (Westgard, 1981).
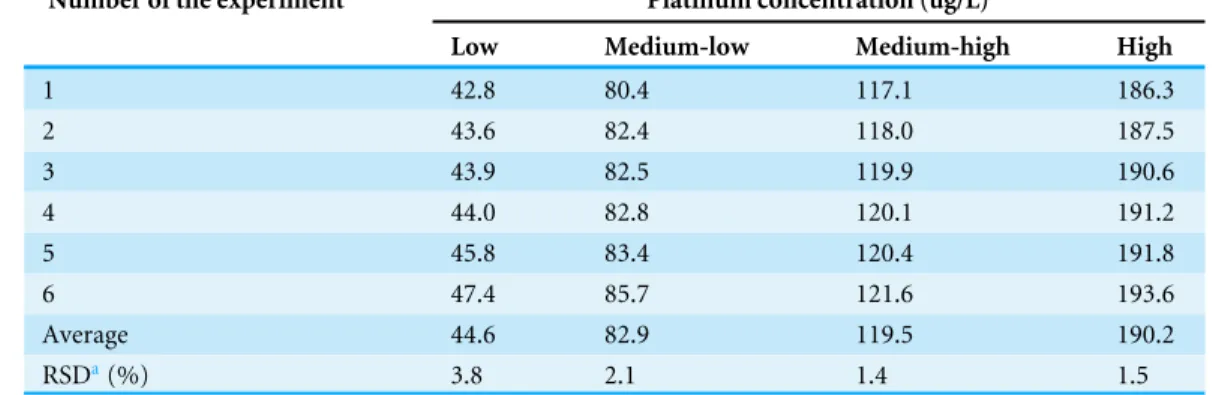
Vouillamoz-Lorenz et al., 2001), was evaluated by performing six replicate injections at four different concentration levels of A2780 cells (the average concentration of Low level: 44.6 ug/L, Medium-low: 82.9 ug/L, Medium-high: 119.5 ug/L, High: 190.2 ug/L) (Tiwari & Tiwari, 2010). An analytical method was considered precise when the RSD was less than 15% except at the detection limit where 20% RSD was accepted (Shah et al., 1991;Tiwari & Tiwari, 2010).
Sensitivity
The sensitivity of an assay was evaluated by its detection limit, which is numerically equal to 3 times the standard deviation of at least 10 distinct measurements of blank samples (Vouillamoz-Lorenz et al., 2001).
Interference
Interference is defined as the effect of a component on the accuracy of the measurement of another component, which may result in high values (enhancement) or low values (inhibition) (Westgard, 1981). In this study, the interference from the metals coexisting in cells to platinum measurement was evaluated. Based on the content of metals contained in cells, a final concentration of 90.9 mg/L Ca2+
and Mg2+
were added to 95.3 ug/L Hep G2 cell samples, 12.2 mg/L Zn2+, K+, Na+and 1.2 mg/L Cu2+and Mn2+to 102.2 ug/L Hep G2 cell samples and 1.1 mg/L Fe2+
to a 75 ug/L Hep G2 cell sample. The platinum concentration in each mixture was measured for six times and the average value was used for calculation of the recovery rate, which was determined by the ratio of the platinum concentration in the sample with metal addition to that in the corresponding parent samples. In general, an average recovery rate of 90% to 110% was considered to be acceptable.
Stability
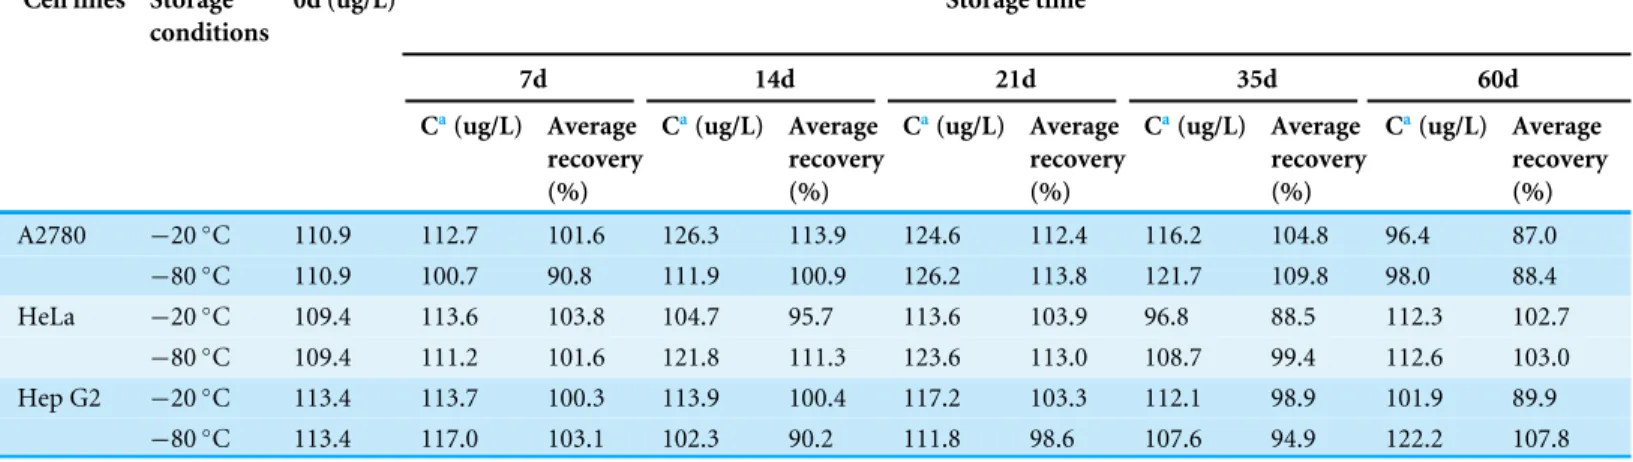
To evaluate the long-term storage stability, A2780, HeLa, and Hep G2 cells were stored at −20◦C and−80◦C for 7, 14, 21, 35 and 60 days before treatment with 0.2% HNO3and
GFAAS assays, and the platinum contents in these samples were compared with freshly harvested cell.
To assess the stability of platinum concentration during sample processing, the processed cell samples were stored in room temperature without sealing for three hours followed by GFAAS analysis. In addition, the platinum contents of samples prepared and stored in sealed tubes were detected over the next 24 h and 48 h. Stability was calculated by comparing the platinum concentrations assessed at each time point to the corresponding freshly prepared samples. The results within 85%–115% was considered to be acceptable (Kloft et al., 1999).
Method application
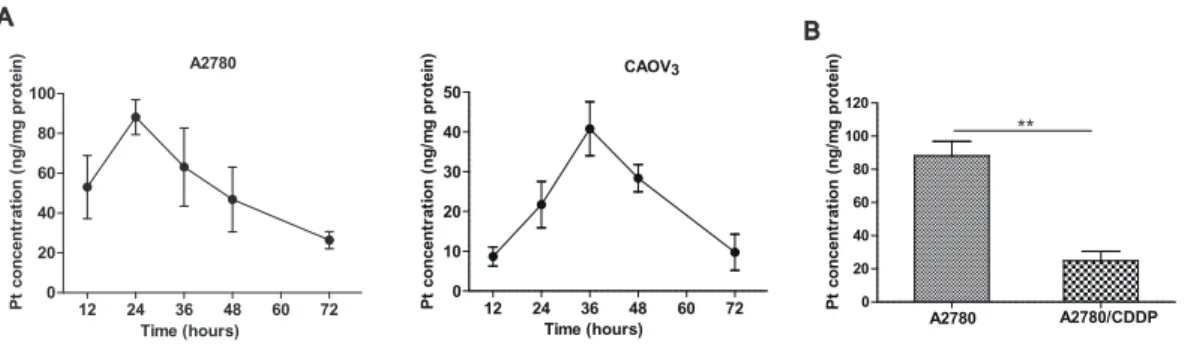
A2780 and CAOV3cells were treated with 20 uM cisplatin for 12, 24, 36, 48, and 72 h. The
Statistical analysis
Data were expressed as mean ±standard deviation. Differences between groups were analyzed using student’s t-test. All tests were two-tailed and P-values of <0.05 were considered statistically significant.
RESULTS
Comparison of different sample preparation methods
To determine the intracellular platinum concentration, cell pellets were processed with 0.2% HNO3, 0.2% Triton X-100, concentrated nitric acid and RIPA combined with
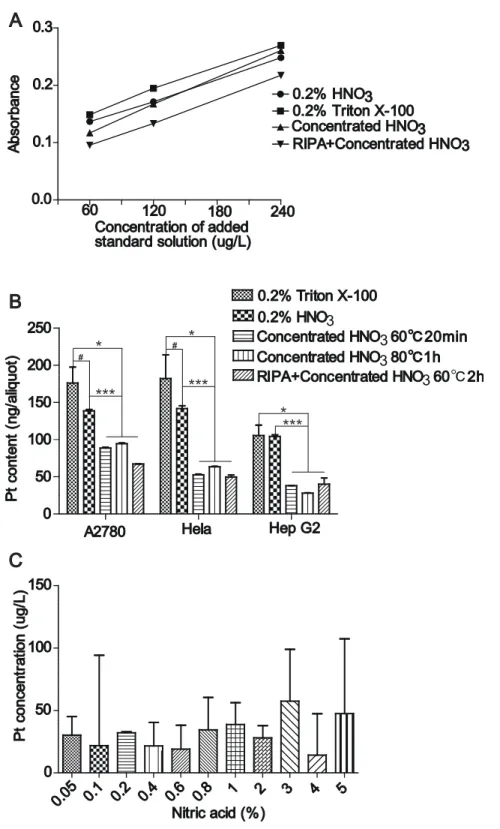
concentrated nitric acid respectively. Generally, the linearity of the calibration curves was satisfactory with a correlation coefficient higher than 0.99 in all cases (Fig. 1A). The platinum concentrations in samples treated with 0.2% HNO3or 0.2% Triton X-100 were
significantly higher than that in samples treated with concentrated nitric acid alone or in combination with RIPA (Fig. 1B), suggesting a significant loss of platinum caused by the processing with concentrated nitric acid. The spectrogram of samples processed using NaOH combined with HCl was undulate and lacked a wave crest at 265.9 nm. Hence, this method was excluded.
As shown inFig. 1B, the difference of platinum contents between samples processed with 0.2% HNO3and 0.2% Triton X-100 was not statistically significant. Nevertheless, the
treatment with 0.2% HNO3was superior to 0.2% Triton X-100 in light of repeatability
indicated by a RSD of 3.6% versus 24.7%. In addition, the impact of nitric acid concentrations ranging from 0.05% to 5% on the platinum determination was investigated. As shown inFig. 1C, there was no significant difference in the platinum concentrations between groups. However, samples prepared with 0.2% HNO3gave the littlest RSD among
the different concentrations of nitric acid, suggesting a better ability of 0.2% HNO3 to
eliminate matrix interference. Thus, the 0.2% HNO3treatment was used to prepare cell
samples for subsequent experiments.
Accuracy, precision and sensitivity
Given that the sample preparation method using 0.2% HNO3was characterized with fewer
platinum loss and lower RSD in the subsequent GFAAS assays, we thought to further evaluate its accuracy and precision. As shown inTable 1, the average recovery rates of samples at different platinum concentration levels ranged from 97.3% to 103.0%. The results summarized inTable 2presented that the RSD were less than 5% (1.4%–3.8%) in all cases and tended to decrease with the increase of platinum content in samples. The detection limit of the assay analyzed was 13.23 ug/L.
Interference
A27 80 Hel a Hep G2 0 50 100 150 200 250
0.2% Triton X-100 0.2% HNO3
Concentrated HNO3 60℃20min Concentrated HNO3 80℃1h RIPA+Concentrated HNO3 60℃2h
A2780 Hela Hep G2
P t c o n te n t (n g /a liq u o t)
B
0.05 0.1 0.2 0.4 0.6 0.8 1 2 3 4 5
0 50 100 150
Nitric acid (%)
P t c o n c e n tr a ti o n ( u g /L )
C
A
30 60 90 120 150 180 210 240 0.0
0.1 0.2 0.3
Concentration of added standard solution (ug/L)
60 120 180 240
A b s o rb a n c e 0.2% HNO3 0.2% Triton X-100 Concentrated HNO3 RIPA+Concentrated HNO3 * *** * *** # * *** #
Figure 1 Comparison of different sample preparation methods.(A) Calibration curves of different sample preparation methods according to the absorbance of a series of platinum standard addition solu-tions ranging from 60µg/L to 240µg/L. (B) Platinum contents of A2780, HeLa, Hep G2cells processed
using different methods. Student’st-test, *P<0.05, ***P<0.001, #P>0.05. (C) Platinum
Table 1 Evaluation of accuracy in terms of recovery rate at different concentration levels.
Cell lines Concentration of sample (ug/L)
Added standard solution (ug/L)
Number of the experiment Mean (ug/L) Average recovery (%)
1 (ug/L) 2 (ug/L) 3 (ug/L) 4 (ug/L) 5 (ug/L) 6 (ug/L)
A2780 48.6 45.0 95.5 85.9 92.5 92.2 93.3 95.0 92.4 97.3
A2780 96.5 85.0 180.2 182.2 183.7 184.2 183.4 188.0 183.6 102.5
Hep G2 110.9 125.0 232.9 235.7 237.0 241.8 242.8 247.5 239.6 103.0
Table 2 Precision of the method evaluated as relative standard deviation at different concentration levels of A2780 cells.
Number of the experiment Platinum concentration (ug/L)
Low Medium-low Medium-high High
1 42.8 80.4 117.1 186.3
2 43.6 82.4 118.0 187.5
3 43.9 82.5 119.9 190.6
4 44.0 82.8 120.1 191.2
5 45.8 83.4 120.4 191.8
6 47.4 85.7 121.6 193.6
Average 44.6 82.9 119.5 190.2
RSDa(%) 3.8 2.1 1.4 1.5
Notes.
aRelative standard deviation.
Table 3 Influence of coexistent metals on platinum determination in Hep G2 cell samples.
Metals Added concentration (ug/L)
Sample Pta concentration (ug/L)
Number of the experiment Mean Average recovery (%)
1 (ug/L) 2 (ug/L) 3 (ug/L) 4 (ug/L) 5 (ug/L) 6 (ug/L)
Ca 90.9 95.3 85.5 93.3 94.5 96.9 101.2 99.4 95.1 99.8
Mg 90.9 95.3 104.0 96.5 100.8 94.0 93.5 99.3 98.0 102.9
Fe 1.1 75.0 74.8 74.1 67.1 71.1 73.5 67.2 71.3 95.1
Zn 12.2 102.2 111.5 95.4 92.6 103.2 95.3 98.1 99.4 97.2
Cu 1.2 102.2 102.6 111.1 106.1 106.6 104.2 101.9 105.4 103.1
Mn 1.2 102.2 96.0 95.8 108.9 107.5 107.6 107.6 103.9 101.7
K 12.2 102.2 101.6 103.3 97.0 110.8 101.6 106.3 103.4 101.2
Na 12.2 102.2 107.0 104.9 100.2 101.7 100.4 95.6 101.6 99.4
Notes.
Table 4 Long-term storage stability of platinum concentration in cell samples.
Cell lines Storage conditions
0d (ug/L) Storage time
7d 14d 21d 35d 60d
Ca(ug/L) Average recovery (%)
Ca(ug/L) Average recovery (%)
Ca(ug/L) Average recovery (%)
Ca(ug/L) Average recovery (%)
Ca(ug/L) Average recovery (%)
A2780 −20◦C 110.9 112.7 101.6 126.3 113.9 124.6 112.4 116.2 104.8 96.4 87.0
−80◦C 110.9 100.7 90.8 111.9 100.9 126.2 113.8 121.7 109.8 98.0 88.4 HeLa −20◦
C 109.4 113.6 103.8 104.7 95.7 113.6 103.9 96.8 88.5 112.3 102.7
−80◦C 109.4 111.2 101.6 121.8 111.3 123.6 113.0 108.7 99.4 112.6 103.0 Hep G2 −20◦C 113.4 113.7 100.3 113.9 100.4 117.2 103.3 112.1 98.9 101.9 89.9
−80◦
C 113.4 117.0 103.1 102.3 90.2 111.8 98.6 107.6 94.9 122.2 107.8
Notes.
aConcentration.
Table 5 Stability of platinum concentration during cell sample processing.
Cell lines Starting point Unsealed Sealed
Ca(ug/L) 3 h 24 h 48 h
Ca(ug/L) Average recovery (%)
Ca(ug/L) Average recovery (%)
Ca(ug/L) Average recovery (%)
Hep G2 117.0 110.8 94.7 108.6 92.8 111.1 95.0
A2780 98.0 91.6 93.5 104.4 106.5 102.4 104.5
A2780 40.0 44.5 111.2 43.3 108.2 42.2 105.5
Notes.
aConcentration.
Stability
As shown in Table 4, there was no significant decrease in intracellular platinum concentration during the 7–60 days storage at−20◦C and−80◦C, which was indicated by the recovery rates between 87.0% and 113.9% (Table 4).
Compared with freshly processed samples, the results inTable 5revealed no significant alteration in platinum content of samples processed and stored without sealing for three hour, excluding the effects of solvent evaporation during measurement on the test results, which can lead to an increase in platinum concentration. Moreover, the platinum concentrations in processed samples that were stored in sealed tubes over a period of 48 h were also found to be acceptable, with recovery rates between 92.8% and 111.2% (Table 5).
Method application
The proposed method was applied to determine the dynamic change of platinum accumulation in ovarian cancer cells. After incubation with cisplatin, the intracellular platinum concentrations in A2780 and CAOV3cells increased in a time-dependent manner
A27 80 AC P 0 20 40 60 80 100 120 P t c o n c e n tr a ti o n ( n g /m g p ro te in ) A2780 A2780/CDDP
12 24 36 48 60 72
0 10 20 30 40 50 P t c o n c e n tr a ti o n ( n g /m g p ro te in ) Time (hours) CAOV3 A B **
Figure 2 Practical application of the method.(A) The platinum concentration-time curves of A2780 and CAOV3cells. (B) Comparison of platinum accumulation in A2780 and its resistant variant
A2780/CDDP after incubation with 20 uM cisplatin for 24 h. Student’st-test, **P<0.01.
measured. Consistent with the literature reported (Zisowsky et al., 2007), the intracellular platinum accumulation was significantly decreased in the A2780/CDDP cells compared with the A2780 (P<0.01,Fig. 2B).
DISCUSSION
The determination of platinum concentration in cultured cells is useful in studying the mechanisms of platinum-resistance in tumor. Here, we identified a GFAAS-based assay for quantitative platinum detection with high accuracy and precision. We compared different cell treatment procedures and found 0.2% HNO3treatment was optimal for subsequent
GFAAS platinum analysis with less platinum loss and high repeatability, which might be partially attributed to its simplicity.
High stability of platinum concentrations in samples is a prerequisite for reliable quantification. Burger (Burger et al., 2010),Buss (Buss et al., 2011) and Zisowsky (Zisowsky et al., 2007) stored samples at−20◦C, while Takahashi (Takahashi et al., 1993) and Neill (O’Neill, Hunakova & Kelland, 1999) suggested to store samples at−80◦C or in liquid nitrogen. In the present study, for the GFAAS-based platinum detection, we found that cell samples were allowed to be stored at−20◦C or−80◦C for at least two months. In addition, we found the platinum concentrations in processed samples could remain stable at room temperature for at least three hours that ensures the comparability of samples with different waiting time before GFAAS analysis.
al., 2002), which mainly applies in the situation that the matrices of samples are close to that of the standard solutions. Obviously, standard curve method is not appropriate for platinum detection in cultured cells because of their complicated components. The standard addition method, whereby specific quantities of test samples are spiked with standard solutions, which can tremendously reduce the errors stemming from the physical and chemical differences between the matrices of samples and that of the standard addition solutions (Honorato et al., 2002). Thus, considering the ability to reduce the interference from proteins, nucleic acids and other components contained in cells, the standard addition method was used in the present work. Consistent with this effect, interference experiments revealed that metals at macro (K, Na, Ca, Mg) and trace levels (Fe, Cu, Mn, Zn) had no significant influence on the quantification of platinum.
Wills et al. reported the measurement of cadmium (Cd) levels in cultured retinal pigment epithelium cells using GFAAS and the results were compared with that detected by ICP-MS. They found that the two methods gave essentially identical results with ±5% standard deviation (Wills et al., 2008). Additionally, a study on the compatibility between ICP-MS and GFAAS for Cd detection based on 1,159 blood samples showed a close correlation between the results by the two methods and suggested both methods could be used inter-convertibly when Cd was >2 ug/L (Fukui et al., 2011). Although the determination limit of ICP-MS is substantially lower than that of GFAAS, both are sufficient for detection of metals such as Cd in human blood (Fukui et al., 2011). All together, these findings confirmed the accuracy of GFAAS.
CONCLUSIONS
A GFAAS-based assay following sample preparation using 0.2% nitric acid for determination of platinum accumulation in cultured cells was validated in this work, which was proved to be accurate, sensitive, simple and cost-effective and might improve the research of platinum-based antitumor therapy.
ADDITIONAL INFORMATION AND DECLARATIONS
Funding
This study was financially supported by the National Natural Science Foundation of China (No. 81302265, 81272860, and 81472443). The funders had no role in study design, data collection and analysis, decision to publish, or preparation of the manuscript.
Grant Disclosures
The following grant information was disclosed by the authors:
National Natural Science Foundation of China: 81302265, 81272860, 81472443.
Competing Interests
The authors declare there are no competing interests.
Author Contributions
• Man Xiao conceived and designed the experiments, performed the experiments, analyzed
the data, wrote the paper, prepared figures and/or tables.
• Zaiju Huang performed the experiments, contributed reagents/materials/analysis tools.
• Jing Cai conceived and designed the experiments, analyzed the data, wrote the paper,
reviewed drafts of the paper.
• Jinghui Jia performed the experiments, analyzed the data, prepared figures and/or tables.
• Yuzeng Zhang performed the experiments, analyzed the data, contributed
reagents/materials/analysis tools.
• Weihong Dong contributed reagents/materials/analysis tools, prepared figures and/or
tables.
• Zehua Wang conceived and designed the experiments, reviewed drafts of the paper.
Human Ethics
The following information was supplied relating to ethical approvals (i.e., approving body and any reference numbers):
The present study was approved by the ethical committee of Union Hospital, Tongji Medical College, Huazhong University of Science and Technology, China (Approval number: 2014073).
Data Availability
Supplemental Information
Supplemental information for this article can be found online athttp://dx.doi.org/10.7717/ peerj.2873#supplemental-information.
REFERENCES
Boiteau RM, Fitzsimmons JN, Repeta DJ, Boyle EA. 2013.Detection of iron lig-ands in seawater and marine cyanobacteria cultures by high-performance liquid chromatography-inductively coupled plasma-mass spectrometry.Analytical Chemistry85(9):4357–4362DOI 10.1021/ac3034568.
Burger H, Nooter K, Boersma AW, Kortland CJ, Stoter G. 1997.Lack of correlation between cisplatin-induced apoptosis, p53 status and expression of Bcl-2 family proteins in testicular germ cell tumour cell lines.International Journal of Cancer 73(4):592–599
DOI 10.1002/(SICI)1097-0215(19971114)73:4<592::AID-IJC22>3.0.CO;2-A. Burger H, Zoumaro-Djayoon A, Boersma AW, Helleman J, Berns EM, Mathijssen
RH, Loos WJ, Wiemer EA. 2010.Differential transport of platinum compounds by the human organic cation transporter hOCT2 (hSLC22A2).British Journal of Pharmacology159(4):898–908DOI 10.1111/j.1476-5381.2009.00569.x.
Buss I, Garmann D, Galanski M, Weber G, Kalayda GV, Keppler BK, Jaehde U. 2011. Enhancing lipophilicity as a strategy to overcome resistance against platinum complexes?Journal of Inorganic Biochemistry105(5):709–717
DOI 10.1016/j.jinorgbio.2011.02.005.
Cabrera-Vique C, Teissedre PL, Cabanis MT, Cabanis JC. 1997.Determination of platinum in wine by graphite furnace atomic absorption spectrometry.Journal of AOAC INTERNATIONAL80:57–62.
Cetraz M, Sen V, Schoch S, Streule K, Golubev V, Hartwig A, Koberle B. 2016. Platinum(IV)-nitroxyl complexes as possible candidates to circumvent cisplatin resistance in RT112 bladder cancer cells.Archives of ToxicologyEpub ahead of print June 15 2016DOI 10.1007/s00204-016-1754-3.
Chappuy M, Caudron E, Bellanger A, Pradeau D. 2010.Determination of platinum traces contamination by graphite furnace atomic absorption spectrometry after preconcentration by cloud point extraction.Journal of Hazardous Materials 176:207–212DOI 10.1016/j.jhazmat.2009.11.014.
Davis KJ, Carrall JA, Lai B, Aldrich-Wright JR, Ralph SF, Dillon CT. 2012.Does cytotoxicity of metallointercalators correlate with cellular uptake or DNA affinity?
Dalton Transactions41:9417–9426DOI 10.1039/c2dt30217a.
Dessuy MB, Vale MG, Welz B, Borges AR, Silva MM, Martelli PB. 2011. Deter-mination of cadmium and lead in beverages after leaching from pewter cups using graphite furnace atomic absorption spectrometry.Talanta85(1):681–686
DOI 10.1016/j.talanta.2011.04.050.
Federici C, Petrucci F, Caimi S, Cesolini A, Logozzi M, Borghi M, D’Ilio S, Lugini L, Violante N, Azzarito T, Majorani C, Brambilla D, Fais S. 2014.Exosome release and low pH belong to a framework of resistance of human melanoma cells to cisplatin.
PLOS ONE9:e88193DOI 10.1371/journal.pone.0088193.
Fukui Y, Ohashi F, Sakuragi S, Moriguchi J, Ikeda M. 2011.Comparative evaluation of GFAAS and ICP-MS for analyses of cadmium in blood.Industrial Health 49(3):338–343DOI 10.2486/indhealth.MS1194.
Garmann D, Warnecke A, Kalayda GV, Kratz F, Jaehde U. 2008.Cellular accumulation and cytotoxicity of macromolecular platinum complexes in cisplatin-resistant tumor cells.Journal of Controlled Release131(2):100–106DOI 10.1016/j.jconrel.2008.07.017. Holohan C, Van Schaeybroeck S, Longley DB, Johnston PG. 2013.Cancer drug
resistance: an evolving paradigm.Nature Reviews Cancer13:714–726
DOI 10.1038/nrc3599.
Honorato FA, Honorato RS, Pimentel MF, Araujo MC. 2002.Analytical curve or standard addition method: how to elect and design—a strategy applied to copper determination in sugarcane spirits using AAS.Analyst127:1520–1525
DOI 10.1039/B202519A.
Ikeda M, Ohashi F, Fukui Y, Sakuragi S, Moriguchi J. 2011.Cadmium, chromium, lead, manganese and nickel concentrations in blood of women in non-polluted areas in Japan, as determined by inductively coupled plasma-sector field-mass spectrometry.
International Archives of Occupational and Environmental Health84:139–150
DOI 10.1007/s00420-010-0542-2.
Kalayda GV, Wagner CH, Jaehde U. 2012.Relevance of copper transporter 1 for cisplatin resistance in human ovarian carcinoma cells.Journal of Inorganic Biochemistry 116:1–10DOI 10.1016/j.jinorgbio.2012.07.010.
Khuhawar MY, Arain GM. 2005.Liquid chromatographic determination of cis-platin as platinum(II) in pharmaceutical preparation, serum and urine samples of cancer patients.Talanta66(1):34–39DOI 10.1016/j.talanta.2004.09.015.
Kloft C, Appelius H, Siegert W, Schunack W, Jaehde U. 1999.Determination of platinum complexes in clinical samples by a rapid flameless atomic absorption spectrometry assay.Therapeutic Drug Monitoring 21:631–637
DOI 10.1097/00007691-199912000-00009.
Lebwohl D, Canetta R. 1998.Clinical development of platinum complexes in cancer therapy: an historical perspective and an update.European Journal of Cancer 34(10):1522–1534DOI 10.1016/S0959-8049(98)00224-X.
Noordhuis P, Laan AC, Van de Born K, Losekoot N, Kathmann I, Peters GJ. 2008. Oxaliplatin activity in selected and unselected human ovarian and colorectal cancer cell lines.Biochemical Pharmacology76(1):53–61DOI 10.1016/j.bcp.2008.04.007. O’Neill CF, Hunakova L, Kelland LR. 1999.Cellular pharmacology of cis and
trans pairs of platinum complexes in cisplatin-sensitive and -resistant hu-man ovarian carcinoma cells.Chemico-Biological Interactions123(1):11–29
DOI 10.1016/S0009-2797(99)00115-5.
Rosenberg B. 1985.Fundamental studies with cisplatin.Cancer55(10):2303–2306
DOI 10.1002/1097-0142(19850515)55:10<2303::AID-CNCR2820551002>3.0.CO;2-L. Rotte A, Garmann D, Buss I, Jaehde U. 2010.Effect of extracellular ATP on
cisplatin-induced cytotoxicity in human ovarian carcinoma cells.Chemotherapy56(1):1–8
DOI 10.1159/000287351.
Santa T. 2013.Recent advances in analysis of glutathione in biological samples by high-performance liquid chromatography: a brief overview.Drug Discoveries & Therapeutics7(5):172–177DOI 10.5582/ddt.2013.v7.5.172.
Shah VP, Midha KK, Dighe S, McGilveray IJ, Skelly JP, Yacobi A, Layloff T,
Viswanathan CT, Cook CE, McDowall RD, Pittman KA, Spector S. 1991.Analytical methods validation: bioavailability, bioequivalence and pharmacokinetic studies. Conference report.European Journal of Drug Metabolism and Pharmokinetics 16:249–255DOI 10.1007/BF03189968.
Smeyers-Verbeke J, Detaevernier MR, Denis L, Massart DL. 1981.The determination of platinum in biological fluid by means of graphite furnace atomic absorption spec-trometry.Clinica Chimica Acta113:329–333DOI 10.1016/0009-8981(81)90287-4. Takahashi I, Maehara Y, Kusumoto H, Kohnoe S, Sugimachi K. 1993.Heat enhances
the cytotoxicity of cis-diamminedichloroplatinum(II) and its analogues cis-1,1-cyclobutane-dicarboxylato(2R)-2-methyl-1,4-butanediammineplatinum(II) and cis-diammine(glycolato)platinumin vitro.Cancer Chemotherapy and Pharmacology 33(1):31–35DOI 10.1007/BF00686019.
Thiabaud G, Arambula JF, Siddik ZH, Sessler JL. 2014.Photoinduced reduction of Pt(IV) within an anti-proliferative Pt(IV)-texaphyrin conjugate.Chemistry 20(29):8942–8947DOI 10.1002/chem.201403094.
Tiwari G, Tiwari R. 2010.Bioanalytical method validation: an updated review. Pharma-ceutical Methods1:25–38DOI 10.4103/2229-4708.72226.
Vouillamoz-Lorenz S, Bauer J, Lejeune F, Decosterd LA. 2001.Validation of an AAS method for the determination of platinum in biological fluids from patients receiv-ing the oral platinum derivative JM216.Journal of Pharmaceutical and Biomedical Analysis25(3–4):465–475DOI 10.1016/S0731-7085(00)00508-2.
Westgard JO. 1981.Precision and accuracy: concepts and assessment by method evaluation testing.Critical Reviews in Clinical Laboratory Sciences13(4):283–330
DOI 10.3109/10408368109106450.
Ye J, Liu S, Tian M, Li W, Hu B, Zhou W, Jia Q. 2014.Preparation and characterization of magnetic nanoparticles for the on-line determination of gold, palladium, and platinum in mine samples based on flow injection micro-column preconcen-tration coupled with graphite furnace atomic absorption spectrometry.Talanta 118(15):231–237DOI 10.1016/j.talanta.2013.10.018.
Yunos NM, Beale P, Yu JQ, Huq F. 2011.Synergism from sequenced combinations of curcumin and epigallocatechin-3-gallate with cisplatin in the killing of human ovarian cancer cells.Anticancer Research31:1131–1140.
Zheng YJ, Kang Y, Feng YZ, Zhang R, Zhang WB. 2001.Addition internal standard method in chromatographic quantitative analysis.Se pu19:464–466.
Zisowsky J, Koegel S, Leyers S, Devarakonda K, Kassack MU, Osmak M, Jaehde U. 2007.Relevance of drug uptake and efflux for cisplatin sensitivity of tumor cells.