Short Report
S
J. Braz. Chem. Soc., Vol. 26, No. 11, 2384-2388, 2015. Printed in Brazil - ©2015 Sociedade Brasileira de Química 0103 - 5053 $6.00+0.00*e-mail: [email protected]
Spectrophotometric Determination of Aluminium in Hemodialysis Water
Eder J. Santos,*,a Eduardo B. Fantin,a Ronei E. Paixão,a Amanda B. Herrmanna and
Ralph E. Sturgeonb
aInstituto de Tecnologia do Paraná (TECPAR), 81350-010 Curitiba-PR, Brazil
bMeasurement Science and Standards, National Research Council Canada, ON K1A 0R9 Ottawa, Canada
A spectrophotometric method for the determination of AlIII in hemodialysis water employing alizarin red S complexing agent in the presence of polyvinylpyrrolidone 40 surfactant is described. The complex, formed in pH 4.5 buffered media, is detected at 510 nm. Optimal concentrations of all reagents were investigated as well as the appropriate detection wavelength. A linear analytical curve in the range of 5.0-320 µg L−1 was obtained, providing a limit of detection (3s, n = 7) of 2 µg L−1 and quantification limit of 5 µg L−1. Results were compared with those generated using inductively coupled plasma mass spectrometry (ICP-MS) as an independent technique and method validation was also demonstrated by analysis of AccuStandard certified reference material QCS-02-R1-5, appropriately diluted to 10 µg L−1. Equivalent results (t-test at a 95% confidence level) with a relative standard deviation of 4% were obtained. Real samples, spiked at a level of 10 µg L−1 to conforme to Brazilian legislated limits,showed recoveries between 90-110%. The procedure is simple and fit-for-purpose with sufficient detection power to screen for Al at trace levels in hemodialysis water without pre-concentration of the samples.
Keywords: aluminium, alizarin red S, polyvinylpyrrolidone (PVP40), hemodyalisis water,
spectrophotometry
Introduction
Patients undergoing hemodialysis treatment are exposed to water volumes ranging from 18,000 to 36,000 liters per year. If not properly pre-treated, the presence of various chemical, bacteriological and toxic species may contaminate patients, leading to adverse effects and even death.1 A classic example of this situation is presented by aluminum, typically present at a concentration ca. 7 µg L−1 in blood.2 Having no known biochemical function, toxicity is manifested especially in people with chronic renal failure. Once administered directly into the bloodstream, it can accumulate in the bones and brain, causing diseases such as renal osteodystrophy and dialysis encephalopathy.1-4 For this reason, water quality standards required for the preparation of dialysis solutions are different from those applied to water intended for human consumption. In the case of Al, Brazilian legislation specifies the tolerable limit to be 10 µg L−1 in water for hemodialysis (according to RDC No. 11/2014), and 200 µg L−1 in drinking water (Portaria 2914/2011).5,6 Considering the low concentration set by regulatory organizations, it is necessary
to increase sensitivity and selectivity. Shokrollahi et al.18 and more recently Khanhuathon et al.19 used the cationic surfactant N,N-dodecyltrimethylammonium bromide (DTAB) with eriochrome cyanine R ligand for the successful determination of Al3+ in wastewater and tapwater to yield a limit of detection of 0.14 µg L−1 and in bottled drinking water and beverages with a limit of detection (LOD) of 2.0 µg L−1, respectively.18,19 Studies of the influence of polyvinylpyrrolidone (PVP) on the formation of a sensitive aluminium-alizarin red S chromophore were first reported by Parker et al.20 and Hernández-Méndez et al.21 Cetyltrimethylammonium bromide (CTAB) and alkylbenzyldimethyl choride (ABDAC) were also investigated, but with inferior results.21 However, CTAB was successfully utilized by Rodrigues et al.22 in a flow injection spectrophotometric system for the determination of Al in hemodialysis solutions. Hernández-Méndez et al.21 reported a detection limit of 810 µg L−1 Al3+. Based on their initial studies,21 this work was undertaken to develop and validate a fit-for-purpose spectrophotometric method for the direct determination of aluminum in hemodialysis water that would be suitable for routine application as a consequence of detection power, simplicity and low cost. To the best of our knowledge, this methodology has not been earlier applied for the analysis of hemodialysis water.
Experimental
Instrumentation
All spectrophotometric measurements were made using a Thermo Spectronic model Aquamate (New York, USA) spectrophotometer fitted with a standard 10 mm path length quartz cell. A Varian (Melborurne, Australia) model 820-MS inductively coupled plasma mass spectrometer (ICP-MS) was used for comparison of results. Experimental conditions are summarized in Table 1; Ar of 99.99995% purity (White Martins, São Paulo, Brazil) was used for plasma operation. A Thermo Orion 710A potentiometer was used for pH measurements of sample solutions. A model USC 1800A (40 kHz) ultrasonic bath (Unique, São Paulo, Brazil) was used to aid in the dissolution of PVPs.
Reagents and materials
All chemicals were of analytical grade, unless otherwise specified. High purity water (resistivity of 18.2 MΩ cm) was deionized in a Milli-Q system (Bedford, MA, USA). The following reagents were prepared or used: solutions of 0.01 mol L−1 H
2SO4 and NaOH (Merck regents,
Darmstadt, Germany, No. 1.00731.1000 and 1.06498.1000, respectively); a buffer solution (pH 4.5) comprising a mixture of CH3COONa (Sigma-Aldrich Co., St Louis, USA) and CH3COOH (Panreac, Barcelona, Spain); a standard solution containing 1000 µg mL−1 Al3+ (AccuStandard, New Haven, USA); a 0.15% m/v (4.383 mmol L−1) solution of alizarin red S (Sharlau, Barcelona, Spain, No. RO0070); sodium dodecylbenzenesulfonate (Sigma-Aldrich Co., No. 289957), polyvinylpyrrolidone (PVP40 and PVP360, Sigma-Aldrich Co.); L-ascorbic acid (Sigma-Aldrich Co., A92902) and L-histidine, HCl (Sigma-Aldrich Co., H8125). A quality control reference material containing 100 µg mL−1 Al3+ (QCS-02-R1-5) was obtained from AccuStandard. A suite of real hemodialysis water samples, obtained from a medical center in Curitiba, Paraná State, were subjected to analysis using the optimized methodology.
Procedure
From a solution of 10% m/v of PVP40 (previously dissolved with the aid of sonication in high purity water), 2.5 mL were transferred to a 25 mL volumetric flask, followed by the addition of 10 mL CH3COONa/CH3COOH buffer, 2 mL alizarin red S 0.15% m/v solution (350 µmol L−1 at final concentration in 25 mL) and 10 mL of the sample. The volume was made up with high purity water and the flask was capped. After a 15 min color development time at room temperature, the determination of aluminium was performed against calibration solutions covering the range 5-320 µg L−1. These were prepared from the 1000 µg mL−1 stock solutions of Al3+ by dilution with water and subjected to a treatment identical to that described for the sample.
Results and Discussion
Selection of absorption wavelength and surfactant
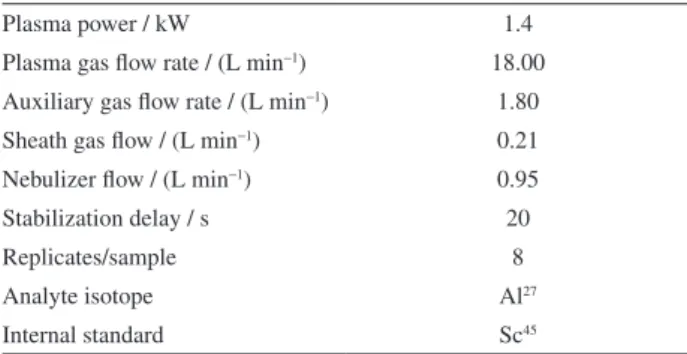
Based on the initial conditions reported by Hernandez-Mendez et al.,21 dodecylbenzenesulfonate, PVP40 and Table 1. ICP-MS operating parameters
Plasma power / kW 1.4
Plasma gas flow rate / (L min−1) 18.00
Auxiliary gas flow rate / (L min−1) 1.80 Sheath gas flow / (L min−1) 0.21 Nebulizer flow / (L min−1) 0.95
Stabilization delay / s 20
Replicates/sample 8
Analyte isotope Al27
PVP360 surfactants were added at final concentrations of 0.8% m/v to investigate their effects on the development of absorption in the range 400-700 nm by the Al-alizarin red S complex (350 µmol L−1). As a CH
3COONa/CH3COOH buffer at pH ca. 4.5 was found optimal in their procedure, no further study of the influence of pH was undertaken in this work as the system was observed to be stable and sensitive under such conditions.21 As evident from Figure 1, the Al-alizarin red S complex displays maximum sensitivity at 485 nm but, as reported earlier,21 a bathochromic shift occurs in the presence of PVP40 and 360 to yield maximum absorbance at 510 nm as well as enhanced sensitivity. As results were similar for both PVP surfactants, PVP40 was selected for further experiments as it was easier to solubilize than PVP360. The Al-alizarin red S-dodecylbenzenesulfonate system did not show any significant change, having characteristics similar to the simple Al-alizarin red S complex.
Effect of PVP40 concentration on response
Figure 2 shows the effect of PVP40 concentration in the range 0.05 to 10% m/v on absorbance by the Al-alizarin red S-PVP40 complex at 510 nm. Although differences were not significant beyond 1% m/v, and despite the optimal being 5%, a concentration of 1% m/v was defined as the most appropriate for practical purposes based on the difficulty of solubilization of the PVP and considering the impact of increased reagent consumption.
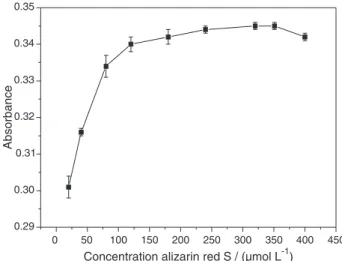
Effect of concentration of alizarin red S
Figure 3 shows the impact of concentration of alizarin red S over the range 25-400 µmoL L−1 on absorbance by
the Al-alizarin red S-PVP40 system (100 µg L−1 Al3+). A concentration of ca. 350 µmol L−1 was adopted as optimal.
Effect of time on the development of the Al-alizarin red S-PVP 40 system
Figure 4 shows the impact of time, at laboratory temperature (ca. 25 °C), on the development of the Al-chromophore both with and without the addition of PVP40 surfactant. Although a steady-state response is achieved after about 3 min in the absence of the surfactant, a minimum of 8 min is required when PVP40 is present, suggesting an added time for assembly of the surface active species incorporating the metal-ligand system, permitting a concurrent enhancement in sensitivity. A color development time of 15 min was adopted to ensure sufficient time stability.
400 450 500 550 600 650 700
-0.6 -0.4 -0.2 0.0 0.2 0.4
Wavelength / nm
Absorbance
Polyvinylpyrrolidone 40 Polyvinylpyrrolidone 360 Al - Alizarin red S
Figure 1. Absorption spectra of the Al-alizarin red S complex (100 µg L−1 Al3+) and the effect of added PVP40 and PVP360 surfactants at a final concentration of 0.8% m/v. Bars represent standard deviation of three replicate measurements.
0 2 4 6 8 10
0.30 0.35 0.40 0.45 0.50 0.55 0.60
Al-Alizarin red S-PVP40 system / %
Absorbance
Figure 2. Effect of PVP40 concentration on absorbance from an aqueous standard solution containing 100 µg L-1 Al3+. Bars represent standard deviation of three replicate measurements.
0 50 100 150 200 250 300 350 400 450
0.29 0.30 0.31 0.32 0.33 0.34 0.35
Concentration alizarin red S / (µmol L )-1
Absorbance
Figure 3. Effect of concentration of alizarin red S on absorbance from an aqueous standard solution containing 100 µg L−1 of Al3+ and 1% m/v PVP40. Bars represent standard deviation of three replicate measurements. 400 450 500 550 600 650 700
-0.6 -0.4 -0.2 0.0 0.2 0.4
Wavelength / nm
Absorbance
Effect of potential interferences
The effect of typical concomitant ions present in hemodialysis water, such as Ca2+, Cu2+, Fe3+, Mg2+, Mn2+, K+, and Zn+, was investigated under optimum analytical conditions. Test samples containing 100 µg L−1 of Al3+ were spiked at concentrations up to 1000 µg L−1 with individual interfering elements. No interference from Ca2+, Mg2+, Mn2+, K+ or Zn+ was evident, but Cu2+ and Fe3+ present at levels of 200 µg L−1 and 80 µg L−1, respectively, generated positive bias errors greater than 5% relative to the absorbance of the unadulterated clean Al3+ solutions. Although the presence of these elements at such levels in hemodyalisis water is rare, their effects can be successfully eliminated by the addition of 0.05 mol L−1 ascorbic acid for Fe3+ and 0.01 mol L−1 L-histidine for Cu2+.18 Such observations are illustrated in Figure 5, which visually
shows the effect of the presence of these interferences and the impact of added ascorbic acid and L-histidine on the elimination of their influence.
Figures of merit
Analytical curves prepared from Al3+ standard solutions spanning the concentration range 5.0-320 µg L−1 were generated using the selected conditions. The linear correlation coefficient was 0.9994 with an estimated limit of detection (LOD, 3s, n = 7) of 2 µg L−1 and limit of quantification (LOQ) 5 µg L−1. This LOQ is fit-for-purpose for the analysis of Al in hemodialysis water or flagging of outliers as maximum content is specified as 10 µg L−1.5 This methodology provides an alternative approach to that developed by both Rodrigues et al.22 and Shokrollahi et al.,18 and more recently by Elečková et al.17 and Khanhuathon et al.,19 having sufficient detection power to achieve the direct determination of aluminum using simple standard spectrophotometric equipment. Measurements of ten replicate solutions of the QCS-02-R1-5 quality control certified reference material standard (AccuStandard) appropriately diluted to 10 µg L−1 were performed using the proposed methodology and results compared to those obtained using ICP-MS. In accordance with a t-test at a level of 95% confidence, equivalent results were obtained. The relative standard deviation was 4% (n = 10).23 This procedure was also applied to the determination of Al in six real samples obtained from a hemodialysis center in Curitiba, Paraná State. Results are summarized in Table 2. In all cases, concentrations were below the estimated LOQ and hence in conformance with Brazilian legislated limits. Spikes, added to these samples at the mandated maximum allowable concentration (10 µg L−1), exhibited recoveries of
0 5 10 15 20 25 30
0.22 0.24 0.26 0.28 0.30 0.32 0.34 0.36
time / min
Absorbance
With PVP40
Without PVP40
Figure 4. Effect of time on the development of absorbance by the Al - alizarin red S complex in the presence and absence of added PVP40. Bars represent standard deviation of three replicate measurements.
Figure 5. Effect of Fe3+ and Cu2+ interference on visible color development: (1) aqueous standard solution containing 100 µg L−1 of Al3+; (2) aqueous standard solution containing 100 µg L−1 of Al3+, 500 µg L−1 of Fe3+ and 0.05 mol L−1 ascorbic acid; (3) aqueous standard solution containing 100 µg L−1 of Al3+ and 500 µg L−1 of Fe3+; (4) aqueous standard solution containing 100 µg L−1 of Al3+, 500 µg L−1 of Cu2+ and 0.01 mol L−1 L-histidine; (5) aqueous standard solution containing 100 µg L−1 of Al3+ and 500 µg L−1 of Cu2+.
Table 2. Analysis of real samples of hemodialysis water and spike (10 µg L−1, n = 3) recoveries
Sample Spectrophotometric
method / (µg L−1) ICP-MS / (µg L
−1)
01 < 5 < 0.2
02 < 5 < 0.2
03 < 5 < 0.2
04 < 5 < 0.2
05 < 5 < 0.2
06 < 5 < 0.2
01 spiked 11 ± 1 10.0 ± 0.1
02 spiked 10 ± 1 9.0 ± 0.1
03 spiked 9 ± 1 9.0 ± 0.1
< : below estimated LOQ.
0 5 10 15 20 25 30
0.22 0.24 0.26 0.28 0.30 0.32 0.34 0.36
time / min
Absorbance
90-110% with all results in accordance with those obtained using an independent ICP-MS technique.
Conclusions
In the presence of PVP40 surfactant, the Al-alizarin red S chromophore exhibited an improvement in sensitivity for determination of Al in hemodialysis water. The proposed method is very simple and of low cost, yielding good precision and accuracy and is thus a simple alternative for quality control determinations of Al in hemodialysis water, having low reagent and sample consumption and ease of implementation in hemodialysis centers. The methodology is readily amenable to use of automated flow injection techniques to yield high throughput determinations. This simple procedure has been adopted by TECPAR’s routine application laboratory as an alternative to ICP-MS methodology.
Acknowledgements
The authors are thankful to Fundação Araucária (Paraná, Brazil) for a scholarship (E. B. Fantin).
References
1. Da Silva, A. M. M.; Martins, C. T. B.; Ferraboli, R.; Jorgetti, V.; Romão Jr., J. E.; J. Bras. Nefrol.1996, 18, 180.
2. Willhite, C. C.; Ball, G. L.; MacLellan, C. J.; Crit. Rev. Toxicol. 2012, 42, 358.
3. Luehmann, D. A.; Keshaviah, P. R.; Ward, R. A.; Klein, E.; Thomas, A.; A Manual on Water Treatment for Hemodialysis,
U. S. Department of Health and Human Services, Food and Drug Adminstration, 1989.
4. Raggi, M. A.; Sabbioni, C.; Mandrioli, R.; Zini, Q.; Varani, G.;
J. Pharm. Biomed. Anal.1999, 20, 335.
5. Agência Nacional de Vigilância Sanitária (ANVISA);
Requirements for Operating Dialysis Services ANVISA/MS,
Table II - Hemodialysis Water Quality Standard, Resolution RDC No. 11, 2014.
6. Ministério da Saúde, Sets Forth the Procedures of Control and Surveillance of Water Quality for Human Consumption and its
Potability Standards, Portaria No. 2914, 2011.
7. Trentini, P. L.; Ascanelli, M.; Zanforlini, B.; Venturini, F.; Bucci, G.; Fagioli, F.; J. Anal. At. Spectrom. 1993, 8, 905. 8. Braimoh, R. W.; Mabayoje, M. O.; Amira, C. O.; Coker, H.;
Hemodialysis International 2012, 16, 532.
9. Hou, X. H.; Lamberts, L. V.; Guan, G. J.; D’Haese, P. C.; Trace Elem. Electrolytes 2010, 27, 10.
10. Romero, R. A.; Tahán, J. E.; Moronta, A. J.; Anal. Chim. Acta 1992, 257, 147.
11. Luccas, P. O.; Nóbrega, J. A.; Oliveira, P. V.; Krug, F. J.; Talanta 1999, 48, 695.
12. De Carvalho, L. M.; Do Nascimento, P. C.; Boher, D.; Stefanello, R.; Bertagnolli, D.; Anal. Chim. Acta 2005, 546, 79. 13. Pereiro Garcia, M. R.; Diaz Garcia, M. E.; Sanz-Medel, A.;
J. Anal. At. Spectrom. 1987, 2, 699.
14. Garcia, M. R. P.; Garcia, A. L.; Garcia, M. E. D.; Sanz-Medel, A.; J. Anal. At. Spectrom. 1999, 5, 15.
15. Pereira, M. S. S.; Dos Reis, B. F.; Quim. Nova 2002, 25, 931. 16. DeLoncle, R.; Clanet, F.; Analysis 1992, 20, 36.
17. Elečková, L.; Alexovič, M.; Kuchár, J.; Balogh, I. S.; Andruch, V.; Talanta 2015, 133,27.
18. Shokrollahi, A.; Ghaedi, M.; Niband, M. S.; Rajabi, H. R.;
J. Hazard. Mater. 2008, 151, 642.
19. Khanhuathon, Y.; Siriangkhawut, W.; Chantiratikul, P.; J. Food Compos. Anal.2015, 41, 45.
20. Parker, C. A.; Goddard, A. P.; Ribeiro, A. S.; Anal. Chim. Acta 1950, 4, 517.
21. Hernández-Méndez, J.; Carabias-Martínez, R.; Moreno-Cordero, B.; Gutiérrez-Dávila, L.; Anal. Chim. Acta 1983, 149, 379.
22. Rodrigues, J. L.; Magalhães, C. S.; Luccas, P. O.; J. Pharm. Biomed. Anal. 2005, 36, 1119.
23. Miller, J. N.; Miller, J. C.; Statistics and Chemometries for Analytical Chemistry, 4th ed., Person Education: England, 2000.
Submitted: June 8, 2015