Article
J. Braz. Chem. Soc., Vol. 26, No. 10, 1988-1993, 2015. Printed in Brazil - ©2015 Sociedade Brasileira de Química 0103 - 5053 $6.00+0.00
A
*e-mail: anchieta@iq.unesp.br
Determination of Cd, Ni and V in Spices by Solid Sampling High-Resolution
Continuum Source Graphite Furnace Atomic Absorption Spectrometry
Alex Virgilio,a Jardes F. Rêgo,b Ariane I. Barrosb and José A. Gomes Neto*,b
aDepartamento de Química, Universidade Federal de São Carlos, CP 676,
13565-905 São Carlos-SP, Brazil
bDepartamento de Química Analítica, Universidade Estadual Paulista “Júlio de Mesquita Filho“,
CP 355, 14801-970 Araraquara-SP, Brazil
This work describes a procedure for determination of Cd, Ni and V in spices by high-resolution continuum source graphite furnace atomic absorption spectrometry (HR-CS GF AAS) using direct
solid sampling (SS). The use of Pd/Mg(NO3)2 as modifier for Cd, and an additional air-assisted
pyrolysis step allowed the use of aqueous calibration for all analytes. Accuracy was checked by analysis of certified reference materials (CRMs) and the results were in agreement to certified values
at 95% confidence level (t-test). Eight samples of spices were analyzed by the proposed procedure
and by inductively coupled plasma mass spectrometry (ICP-MS). The found concentrations were
88-233 ng g-1 Cd , 113-2842 ng g-1 Ni and 154-1007 ng g-1 V, with precision generally better than
12%. Results obtained by the proposed procedure were in agreement with those obtained by microwave-assisted digestion and ICP-MS determination. The limits of detection were 0.2, 18
and 7 ng g-1 for Cd, Ni and V, respectively.
Keywords: direct solid sampling, high-resolution continuum source atomic absorption spectrometry, trace elements, food analysis, spices
Introduction
Spices are defined as pungent substances obtained from dried seeds, roots, barks, fruits or vegetables which are primarily used for flavoring, coloring, preserving and disguising some off-flavors in foods.1,2 It can be added
to foods in different forms such as whole spices, ground spices, essential oils and infusions.3,4 Among several
components, spices may contain both essential and toxic trace metals in a wide concentration range, originated from the raw material, contamination or adulteration sources.4,5
In order to ensure the safety and quality control of those food additives, the development of accurate and sensitive analytical methods for determination of trace elements is essential.
Among spectrometric techniques, direct solid sampling (SS) coupled to graphite furnace atomic absorption spectrometry (GF AAS) is attractive for determination of trace metals due to its high sensitivity, minimal use of hazardous and toxic reagents, least sample handling and reduced risks of contamination or
analyte loss.6,7 More recently, SS procedures became
even more versatile with high-resolution continuum source graphite furnace atomic absorption spectrometry (HR-CS GF AAS) due to its unique features as higher sensitivity by using wavelength-integrated absorbance or summation of absorbances for different lines,8
multi-element capability9,10 and superior background correction
based on least-squares algorithm.11,12
The SS HR-CS GF AAS has been employed for elemental analysis in a wide variety of matrices including plastic materials and polymers,13-15 carbon-based
materials,10,16-18 plant materials,19,20 food samples,21-23 and
biological samples,24-26 however, this technique is still
Experimental
Instrumentation
A ContrAA 700 high-resolution continuum source atomic absorption spectrometer (Analytik Jena, Jena, Germany) was used for absorbance measurements throughout the work. This instrument consists of a xenon short-arc lamp (XBO 301, 300 W, GLE, Berlin, Germany) operating in “hot-spot” mode as a continuum radiation source, a compact high-resolution double-echelle monochromator with a resolution of about 2 pm per pixel and a charge-coupled device (CCD) array detector. The spectrometer is equipped with a transversely heated pyrolytically coated graphite atomizer without dosing hole and an automated solid sampling device (SSA 600) consisted of a pair of tweezers and a Sartorius WZ2PW micro-balance (Göttingen, Germany) with precision of 0.001 mg. Further details about the instrumentation are described elsewhere.27 Solid samples were transferred to
pyrolytically-coated solid sampling platforms with a stainless steel micro spatula. For calibration, analytical reference solutions were injected manually onto the platforms using micropipettes. High purity argon 99.996% (White Martins, São Paulo, SP, Brazil,) was used as purge and protective gas.
Samples were digested using an Ethos 1600 (Milestone-MLS, Sorisole, Italy) closed-vessel cavity microwave oven. An Agilent 8800 inductively coupled plasma tandem mass spectrometer (ICP-MS/MS) with a triple quadrupole (Agilent Technologies, Tokyo, Japan) was used to perform the comparative analysis. Further details about this instrument and its features can be found elsewhere.28
Reagents, analytical solutions and samples
High purity de-ionized water obtained using a Millipore Rios 5® reverse osmosis and a Millipore
Milli-Q Academic® deionizer system (resistivity
18.2 MΩ cm, Millipore, Bedford, MA, USA), and nitric acid (Suprapur®, Merck, Darmstadt, Germany) were used
to prepare all solutions. Analytical standard solutions were prepared by appropriate dilutions of the 1.00 g L-1
Cd, Ni and V stock standard solutions (Normex®, Carlo
Erba, Milan, Italy) in 0.1% (v/v) HNO3. For Cd, a modifier
solution containing 0.10% (m/v) Pd(NO3)2 + 0.05% (m/v)
Mg(NO3)2 was prepared by dilution of 10 g L-1 Mg(NO3)2
and 10 g L-1 Pd(NO
3)2 stock solutions (Merck) in 0.05%
(m/v) Triton X-100 (Mallinckrodt Baker, Paris, KY, USA). For V, a 1.00 g L-1 BaF
2 modifier solution was prepared
by dissolving 50 mg of the salt (BaF2 99.9%, Aldrich,
St. Louis, MO, USA) in 50 mL of water plus 0.05% (m/v) Triton X-100 (Mallinckrodt Baker). For sample digestion,
concentrated nitric acid (Spectrum, Gardena, CA, USA) and 30% (v/v) hydrogen peroxide (Merck) were used.
The CRMs 1515 Apple Leaves, 1572 Citrus Leaves, 1547 Peach Leaves, 1570a Spinach Leaves and 1573a Tomato Leaves from National Institute of Standards and Technology (NIST, Gaithersburg, MD, USA) were used for optimizations, solid calibration and method validation. Spice samples of annatto, paprika, nutmeg, ginger, garlic, wasabi, saffron and cinnamon in dried and ground forms were purchased at a local market in São Carlos (SP, Brazil).
Procedures
Atomic absorption measurements were carried out at the main analytical lines at 228.802, 232.003 and 318.540 nm for Cd, Ni and V, respectively. Integrated absorbance values were normalized for 1.0 mg of sample and were obtained at least in three replicates using peak volume selected absorbance (PVSA) equivalent to 3 pixels.
Analytical curves using analyte masses of 0, 0.5, 1.0, 5.0, 10, 20 and 30 pg for Cd; 0, 50, 100, 250, 500, 750 and 1000 pg for Ni and 0, 100, 250, 500, 750 and 1000 pg V were made using both aqueous standard solutions and solid CRMs. The blank signal for each analyte was determined subjecting the empty platform through the complete temperature program, according to “zero mass” concept.7 For solid sample
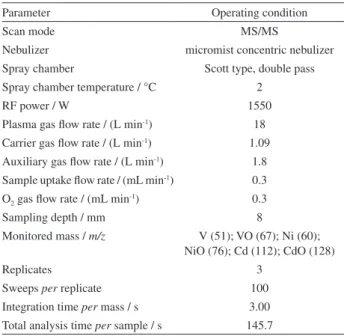
analysis by HR-CS GF AAS, sample masses (ca. 0.5 mg) were manually transferred to the solid sampling platforms, weighed and automatically introduced into the atomization chamber. The samples were analyzed using external calibration with aqueous standard solutions. For comparative analysis, digested samples were analyzed by ICP-MS/MS using the operational conditions described in Table 1.
For digestion, sample masses around 300 mg were accurately weighed and transferred to the digestion vessels followed by addition of 6 mL of 7 mol L-1 HNO
3 plus
2 mL of 30% m/m H2O2. The microwave heating program
involving power, time and temperature was composed of three steps: (i) an 800 W for 10 min ramp in which the temperature slowly increased up to 200 °C; (ii) a 1000 W for 10 min plateau at 200 °C and (iii) a 0 W for 15 min cooling down step. The digested samples were transferred to 50 mL polypropylene flasks and the volume was made up to 50 mL with distilled-deionized water.
Results and Discussion
Thermochemical behavior of the analytes
solid samples, but the settlement of optimal pyrolysis and atomization temperatures is a major parameter to make it feasible.7 For volatile elements as Cd, the presence
of chemical modifiers is important to provide thermal stabilization at higher pyrolysis temperatures, in order to achieve the proper matrix elimination. The universal modifier Pd/Mg(NO3)2 is well described in the literature
29,30 for Cd
determination and was evaluated in this work. For Ni and V, modifiers are generally unnecessary since they are considered refractory elements.31 Nevertheless, the successful use of
Mg(NO3)2 for Ni
29 and BaF
2 as a chemical modifier for V
is reported in the literature.32,33 In the latter, authors claimed
that the use of fluoride ions may promote the formation of volatile compounds with V, which can contribute to reduce the carbides formation and provide a similar behavior of V vaporization in solid and aqueous media. In addition, magnesium nitrate may be used to thermally stabilize Ni and allow higher pyrolysis temperatures for matrix decomposition.29 Considering those aspects and the goal of
the calibration with aqueous standards, chemical modifiers for Ni and V were also studied in detail.
Despite the use of modifiers, the observed absorbances for solid samples were generally lower than those obtained using the same amount of the analytes in aqueous solutions. This occurrence may be explained by the presence of the solid matrix in the atomizer due to inadequate matrix removal. When solid samples were analyzed, a persistent carbonaceous residue in solid sample platforms is often observed after each measurement, even for a longer pyrolysis step or higher atomization and cleaning
temperatures. Those residues may increase the background, cause light scattering, memory effects, and change the vaporization kinetics of the analytes. The residues can be mechanically removed off the platforms but considering the auto sampler convenience, a new strategy was evaluated. The use of oxygen as modifier31 by means of an additional
air-assisted pyrolysis (ashing) step at 600 °C for 30 s showed to be effective for matrix decomposition and carbonaceous residue elimination. This strategy may also match the sensitivities of analytical curves obtained in aqueous and solid media, thus improving the possibility of adopting calibration with aqueous standards.
The thermochemical behavior of the analytes in presence and absence of modifiers for aqueous and solid media was evaluated by means of pyrolysis and atomization curves. Pyrolysis temperatures were investigated in the 500-1600 °C interval with a default atomization temperature of 1800 °C for Cd and 2600 °C for Ni and V. The optimal pyrolysis temperature was determined by the maximum temperature achieved without analytes losses. The atomization step was optimized by varying the temperature in the 1300-2700 °C range, using the previously optimized pyrolysis temperatures. In this case, the intensity and profile of atomic absorption peak, precision and background intensity were considered to select the optimal atomization temperatures. Optimal temperatures of pyrolysis and atomization in absence and presence of modifiers and for different media are shown in Table 2.
In order to increase the possibility of aqueous calibration, the characteristic mass (m0) was calculated
using the absorbance signals obtained in each atomization temperature for solution and solid samples, since the closest values of m0 may indicate similar sensitivities
for both media. Data presented in Table 2 reveals that similar m0 values for aqueous and solids were obtained
only when Pd(NO3)2 was used for Cd and in absence of
it for Ni and V. In absence of chemical modifiers, the maximum pyrolysis observed in aqueous and solid media without analytes losses are 700 °C for Cd and 1400 °C for Ni and V. For Cd, temperatures may increase up to 900 °C in the presence of Pd(NO3)2 + Mg(NO3)2 while for
V, the use of BaF2 showed no influence on its volatility in
both media. For Ni, the use of Mg(NO3)2 can stabilize the
analyte up to 1500 °C in aqueous medium while in solid medium the same temperature is achieved even without the modifier. This may be explained by the high content of Mg present in plant materials which may interact with the analyte during the pyrolysis step and provide further thermal stabilization.
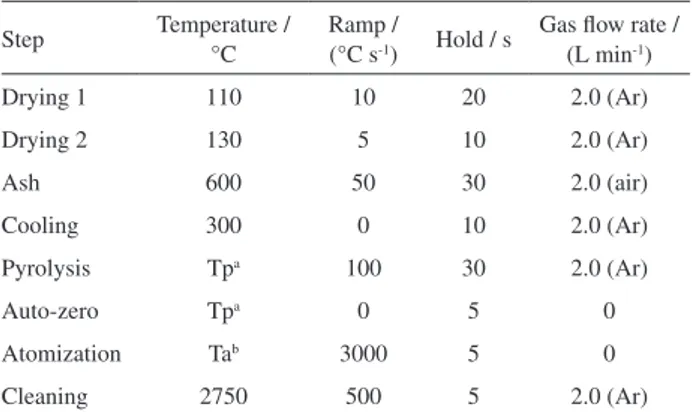
The optimized temperature program used for determinations of Cd, Ni and V is shown in Table 3. Best Table 1. Instrumental operating conditions for ICP-MS/MS
Parameter Operating condition
Scan mode MS/MS
Nebulizer micromist concentric nebulizer
Spray chamber Scott type, double pass Spray chamber temperature / °C 2
RF power / W 1550
Plasma gas flow rate / (L min-1) 18
Carrier gas flow rate / (L min-1) 1.09
Auxiliary gas flow rate / (L min-1) 1.8
Sample uptake flow rate / (mL min-1) 0.3
O2 gas flow rate / (mL min-1) 0.3
Sampling depth / mm 8
Monitored mass / m/z V (51); VO (67); Ni (60); NiO (76); Cd (112); CdO (128)
Replicates 3
Sweeps per replicate 100
Integration time per mass / s 3.00
Total analysis time per sample / s 145.7
results were obtained using Pd(NO3)2 + Mg(NO3)2 for
Cd and with no modifier for Ni and V. Considering the approximate time spent for manual loading of the sample (15 s), weighing (30 s), manual addition of modifier solution (15 s) and the time/temperature program of atomizer (140 s), the whole time for one measurement is close to 200 s, which corresponds to a sample throughput of 16-18 solid samples per hour.
Calibration and figures of merit
Despite the importance of characteristic mass as an indicator on how effective the heating program is in matrix elimination, only the comparison between slopes of analytical curves in different media for Cd, Ni and V can confirm the equivalence between aqueous and solid calibration. The main figures of merit for calibration plots using at least 5 standards with concentrations in the 0.5-30 pg Cd, 50-1000 pg Ni and 100-1000 pg V ranges
and using the optimal parameters described in Table 3 are listed in Table 4. For all analytes, the slopes of analytical curves obtained using aqueous and solid standards were quite similar, thus indicating the feasibility of aqueous calibration for determination of Cd, Ni and V in solid samples. In all cases, the peak profiles were similar in solid and aqueous media.
Limits of detection (LOD) for Cd (0.2 ng g-1),
Ni (18 ng g-1) and V (7 ng g-1) were comparable to those
reported in literature using solid sampling HR-CS GF AAS for determination of Cd in grain products (0.6 ng g-1),21
biomass (1.1 ng g-1),34 and coal (2 ng g-1),16 Ni in biological
samples (25 ng g-1),35 and for Ni and V (6 and 10 ng g-1,
Table 2. Optimized pyrolysis (Tp) and atomization (Ta) temperatures and characteristic mass (m0) obtained in absence and presence of modifiers for
determination of Cd, Ni and V in aqueous and solid medium by SS HR-CS GF AAS
Analyte Medium Modifier Tp / °C Ta / °C m0 / pg
Cd
aqueous solution – 700 1800 1.1
1515 Apple Leaves – 700 1800 1.3
aqueous solution Pd + Mg 900 1600 0.6
1515 Apple Leaves Pd + Mg 900 1600 0.7
Ni
aqueous solution – 1400 2700 5.2
1570a Spinach Leaves – 1500 2700 4.0
aqueous solution Mg(NO3)2 1500 2700 8.7
1570a Spinach Leaves Mg(NO3)2 1500 2700 3.7
V
aqueous solution – 1400 2700 18.3
1573a Tomato Leaves – 1400 2700 18.1
aqueous solution BaF2 1400 2700 22.7
1573a Tomato Leaves BaF2 1400 2700 18.2
Table 4. Figures of merit for Cd, Ni and V using calibration curves obtained in aqueous and solid media by SS HR-CS GF AAS
Figure of merit Cd Ni V
Aqueous calibration
Linear range / pg 0.5-30 50-1000 100-1000
Slope / (s pg-1) 6.9 × 10⁻³ 3.2 × 10⁻⁴ 2.4 × 10⁻⁴
R 0.9993 0.9994 0.9985
LOD / (ng g-1) 0.2 18 7
m0 / pg 0.6 14.0 18.6
RSD / % 3.7 (0.5)b 6.4 (50)b 4.0 (100)b
Solid calibrationa
Linear range / pg 0.5-30 50-1000 100-1000 Slope / (s pg-1) 7.0 × 10⁻³ 2.9 × 10⁻⁴ 2.3 × 10⁻⁴
R 0.9963 0.9986 0.9965
LOD / (ng g-1) 0.3 19 8
m0 / pg 0.5 15.1 18.3
RSD / % 7.1 (0.5)b 8.3 (100)b 6.5 (100)b aCRMs used: NIST standard reference material (SRM) 1515 Apple Leaves
(Cd), NIST SRM 1570a Spinach Leaves (Ni), NIST SRM 1573a Tomato Leaves (V); banalyte mass related to the RSD value (in pg); R: correlation
coefficient; LOD: limit of detection; RSD: relative standard deviation. Table 3. Optimized temperature program of graphite atomizer for Cd, Ni
and V determinations by SS HR-CS GF AAS
Step Temperature / °C
Ramp /
(°C s-1) Hold / s
Gas flow rate / (L min-1)
Drying 1 110 10 20 2.0 (Ar)
Drying 2 130 5 10 2.0 (Ar)
Ash 600 50 30 2.0 (air)
Cooling 300 0 10 2.0 (Ar)
Pyrolysis Tpa 100 30 2.0 (Ar)
Auto-zero Tpa 0 5 0
Atomization Tab 3000 5 0
Cleaning 2750 500 5 2.0 (Ar)
aPyrolysis temperatures: Cd = 900 °C; Ni and V = 1400 °C; batomization
respectively) in carbon and activated charcoal samples.17
Relative standard deviations (RSDs) lower than 8.3% and correlation coefficients better than 0.996 were typically obtained.
Trueness was checked by the determination of Cd, Ni and V in plant CRMs (1515 Apple Leaves, 1572 Citrus Leaves, 1547 Peach Leaves, 1570a Spinach Leaves, 1573a Tomato Leaves) using aqueous calibration (Table 5). It is important to consider that the minimum mass amount recommended for CRM use (ca. 150 mg) is relatively large for SS GF AAS analysis, however, the use of sample masses smaller than 2 mg may also provide reliable results.20 The found values presented no
statistical differences when compared with the certified values at a 95% confidence level (paired t-test). For two CRMs (1570a Spinach Leaves and 1573a Tomato Leaves) Cd contents were not determined because the measured absorbances were above the linear dynamic range, even for smaller sample masses. The accurate results presented in Table 5 reaffirmed the effectiveness of the aqueous calibration for determination of Cd, Ni and V in plant materials by direct solid sampling.
Analysis of samples
The optimized SS HR-CS GF AAS procedure was applied to the determination (n = 3) of Cd, Ni and V in eight samples of spices and condiments (Table 6). The found concentrations varied from 88-233 ng g-1 Cd,
113-2842 ng g-1 Ni and 154-1007 ng g-1 V and can be
considered in the same concentration range as previously reported in literature for this type of samples.5 The RSDs
were generally better than 12% (n = 3) and no interferences caused by structured background were observed for Cd, Ni and V in the spice samples. The obtained results were compared to ICP-MS and in most cases were in agreement at a 95% confidence level (paired t-test), except for Cd in wasabi and paprika, Ni in nutmeg and saffron and V in wasabi.
Conclusions
The proposed SS HR-CS GF AAS method is fast, sensitive, accurate and did not require conventional sample treatment. A careful temperature program optimization using Pd(NO3)2/Mg(NO3)2 as chemical modifier for Cd and
Table 6. Results (mean ± standard deviation, n = 3) for determination of Cd, Ni and V in spices by the proposed (SS HR-CS GF AAS) and comparative (ICP-MS) methods
Sample SS HR-CS GF AAS ICP-MS
Cd / (ng g-1) Ni / (ng g-1) V / (ng g-1) Cd / (ng g-1) Ni / (ng g-1) V / (ng g-1)
Annatto < 0.2 632 ± 31 < 7 < 0.1 658 ± 5 10 ± 1
Paprika 220 ± 3 2842 ± 48 1007 ± 10 277 ± 4 2661 ± 84 1069 ± 19
Nutmeg < 0.2 1415 ± 20 195 ± 23 < 0.1 1798 ± 19 188 ± 7
Ginger 233 ± 28 592 ± 41 < 7 240 ± 22 550 ± 21 < 0.04
Garlic < 0.2 < 18 278 ± 5 < 0.1 < 0.4 269 ± 4
Wasabi 225 ± 8 694 ± 9 280 ± 35 198 ± 2 721 ± 6 214 ± 3
Saffron < 0.2 113 ± 7 < 7 < 0.1 140 ± 2 2.2 ± 0.2
Cinnamon 88 ± 2 < 18 154 ± 19 102 ± 7 16 ± 3 166 ± 5
SS HR-CS GF AAS: solid sampling high-resolution continuum source graphite furnace atomic absorption spectrometry; ICP-MS: inductively coupled plasma mass spectrometry.
Table 5. Results (mean ± standard deviation, n = 3) for determination of Cd, Ni and V in CRMs by SS HR-CS GF AAS using aqueous standard calibration
NIST CRM Cd certified / (ng g-1)
Cd determined / (ng g-1)
Ni certified / (ng g-1)
Ni determined / (ng g-1)
V certified / (ng g-1)
V determined / (ng g-1)
1515 13 ± 2 13 ± 1 910 ± 120 960 ± 50 260 ± 30 230 ± 20
1572 30 ± 10 29 ± 1 600 ± 300 530 ± 90 – –
1547 26 ± 3 25 ± 1 690 ± 90 660 ± 30 370 ± 30 350 ± 20
1570a 2.89 ± 0.07a ndb 2.14 ± 0.10a 2.1 ± 0.2a 570 ± 30 500 ± 40
1573a 1.52 ± 0.04a ndb 1.59 ± 0.07a 1.49 ± 0.07a 835 ± 10 850 ± 70
aValues in µg g-1; bnot determined, since Cd contents were higher than the upper limit of linear range; NIST CRM: National Institute of Standards and
air-assisted pyrolysis for all analytes were efficient strategies to determine Cd, Ni and V in spice samples using the benefits and convenience of calibration with aqueous standard solutions. The concentrations of Cd, Ni and V determined in the spice samples are in a low concentration range (from ng g-1 to a few µg g-1) and were shown to be similar
to those previously reported in the literature.The procedure is straightforward and can be considered an alternative to routine analysis of spice samples for quality control.
Acknowledgements
The authors thank Fundação de Amparo à Pesquisa do Estado de São Paulo (FAPESP, grant 09/52480-0) for financially supporting this work and Coordenação de Aperfeiçoamento Pessoal de Nível Superior (CAPES) for fellowships to A. V. and J. F. R. The authors are also grateful to Conselho Nacional de Desenvolvimento Científico e Tecnológico (CNPq) for fellowship to A. I. B. and research grant to J. A. G. N. The authors are thankful to Agilent Technologies for the loan of the ICP-MS/MS instrument.
References
1. Scully, T.; The Art of Cookery in the Middle Ages; Boydell Press: Woodbridge, 1995.
2. Raghavan, S.; Handbook of Spices, Seasonings, and Flavorings; CRC Press: Boca Raton, 2006.
3. Raj, A. A.; Aaron, I. S.; Seihenbalg, S. S.; Tiroutchelvamae, D.; Ranganathan, T. V.; Int. J. Eng. Res. Appl. 2014, 4, 75. 4. Peter, K. V.; Handbook of Herbs and Spices; CRC Press: Boca
Raton, 2001.
5. Gonzálvez, A.; Armenta, S.; Cervera, M. L.; Guardia, M.;
Talanta 2008, 74, 1085.
6. Belarra, M. A.; Resano, M.; Vanhaecke, F.; Moens, L.; TrAC, Trends Anal. Chem. 2002, 21, 828.
7. Kurfürst, U.; Solid Sample Analysis: Direct and Slurry Sampling Using GF-AAS and ETV-ICP; Springer: Berlin, 1998.
8. Bechlin, M. A.; Gomes Neto, J. A.; Nóbrega, J. A.; Microchem. J.
2013, 109, 134.
9. Resano, M.; García-Ruiz, E.; Anal. Bioanal. Chem. 2011, 399, 323.
10. Resano, M.; Bolea-Fernández, E.; Mozas, E.; Flórez, M. R.; Grinberg, P.; Sturgeon, R. E.; J. Anal. At. Spectrom. 2013, 28, 657.
11. Becker-Ross, H.; Florek, S.; Heitmann, U.; J. Anal. At. Spectrom. 2000, 15, 137.
12. Araujo, R. G. O.; Welz, B.; Vignola, F.; Becker-Ross, H.; Talanta
2009, 80, 846.
13. Resano, M.; Briceño, J.; Belarra, M. A.; Spectrochim. Acta, Part B 2009, 64, 520.
14. Duarte, A. T.; Dessuy, M. B.; Vale, M. G. R.; Welz, B.; Anal. Methods 2013, 5, 6941.
15. Flórez, M. R.; Resano, M.; Spectrochim. Acta, Part B 2013, 88, 31.
16. Silva, A. F.; Borges, D. L. G.; Lepri, F. G.; Welz, B.; Curtius, A. J.; Heitmann, U.; Anal. Bioanal. Chem. 2005, 382, 1835. 17. Lepri, F. G.; Borges, D. L. G.; Araujo, R. G. O.; Welz, B.;
Wendler, F.; Krieg, M.; Becker-Ross, H.; Talanta 2010, 81, 980. 18. Mior, R.; Morés, S.; Welz, B.; Carasek, E.; Andrade, J. B.;
Talanta 2013, 106, 368.
19. Rêgo, J. F.; Virgilio, A.; Gomes Neto, J. A.; Nóbrega, J. A.;
Talanta 2012, 100, 21.
20. Virgilio, A.; Nóbrega, J. A.; Rêgo, J. F.; Gomes Neto, J. A.;
Spectrochim. Acta, Part B 2012, 78, 58.
21. Santos, L. M. G.; Araujo, R. G. O.; Welz, B.; Jacob, S. C.; Vale, M. G. R.; Becker-Ross, H.; Talanta 2009, 78, 577.
22. Ozbek, N.; Akman, S.; J. Agric.Food Chem. 2013, 61, 4816. 23. Gunduz, S.; Akman, S.; Food Chem. 2013, 141, 2634. 24. Resano, M.; Briceño, J.; Belarra, M. A.; J. Anal. At. Spectrom.
2009, 24, 1343.
25. Briceño, J.; Belarra, M. A.; De Schamphelaere, K. A. C.; Vanblaere, S.; Janssen, C. R.; Vanhaecke, F.; Resano, M.;
J. Anal. At. Spectrom. 2010, 25, 503.
26. Rello, L.; Lapeña, A. C.; Aramendía, M.; Belarra, M. A.; Resano, M.; Spectrochim. Acta, Part B 2013, 81, 11.
27. Welz, B.; Becker-Ross, H.; Florek, S.; Heitmann, U.; Vale, M. G. R.; J. Braz. Chem. Soc. 2003, 14, 220.
28. Thomas, R. J.; Practical Guide to ICP-MS; CRC Press: Boca Raton, 2013.
29. Bermejo-Barrera, P.; Moreda-Piñeiro, J.; Moreda-Piñeiro, A.; Bermejo-Barrera, A.; J. Anal. At. Spectrom. 1998, 13, 777. 30. Welz, B.; Sperling, M.; Atomic Absorption Spectrometry;
Wiley-VCH: Weinheim, 1999.
31. Butcher, D. J.; Sneddon, J.; A Practical Guide to Graphite Furnace Atomic Absorption Spectrometry; Wiley: New York,
1998.
32. Fernandes, K. G.; Nogueira, A. R. A.; Gomes Neto, J. A.; Nóbrega, J. A.; J. Braz. Chem. Soc. 2004, 15, 676.
33. Ambrozini, B.; Amorim Filho, V. R.; Oliveira, S. R.; Sacramento, L. V. S.; Gomes Neto, J. A.; Food Chem. 2009,
116, 1024.
34. Duarte, A. T.; Dessuy, M. B.; Vale, M. G. R.; Welz, B.; Andrade, J. B.; Talanta 2013, 115, 55.
35. Gómez-Nieto, B.; Gismera, M. J.; Sevilla, M. T.; Procopio, J. R.; Talanta 2013, 116, 860.
Submitted: May 11, 2015
Published online: July 21, 2015