ANALYSIS OF TERRESTRIAL LASER SCANNING AND PHOTOGRAMMETRY DATA
FOR DOCUMENTATION OF HISTORICAL ARTIFACTS
R.A. KUÇAK a, F. KILIÇ b, A. KISA c,
a ITU, Civil Engineering Faculty, 80626 Maslak Istanbul, Turkey – [email protected] b YTU, Civil Engineering Faculty, 34220, Davutpaşa, Esenler, Istanbul, Turkey– [email protected]
cÇevre ve Şehircilik Bakanlığı CBS Müdürlüğü, Ankara, Turkey– [email protected]
KEY WORDS: Documentation, Lidar, Laser Scanning, Photogrammetry, Artifact, Cultural Heritage, Accuracy
ABSTRACT:
Historical artifacts living from the past until today exposed to many destructions non-naturally or naturally. For this reason, The protection and documentation studies of Cultural Heritage to inform the next generations are accelerating day by day in the whole world. The preservation of historical artifacts using advanced 3D measurement technologies becomes an efficient tool for mapping solutions. There are many methods for documentation and restoration of historic structures. In addition to traditional methods such as simple hand measurement and tachometry, terrestrial laser scanning is rapidly becoming one of the most commonly used techniques due to its completeness, accuracy and fastness characteristics. This study evaluates terrestrial laser scanning(TLS) technology and photogrammetry for documenting the historical artifacts facade data in 3D Environment. PhotoModeler software developed by Eos System was preferred for Photogrammetric method. Leica HDS 6000 laser scanner developed by Leica Geosystems and Cyclone software which is the laser data evaluation software belonging to the company is preferred for Terrestrial Laser Scanning method. Taking into account the results obtained with this software product is intended to provide a contribution to the studies for the documentation of cultural heritage.
1. INTRODUCTION
Photogrammetric methods are used for years to prepare databases (measured drawings and three-dimensional model) for maintenance and repair of historic buildings. These methods has enriched the development of laser scanners, detail and accuracy has been increased.
During the last years multiple applications and projects for heritage documentation have been performed using laser scanner techniques, close-range photogrammetry, combination of both and other techniques, and discussions about which is the best choice for this work have been ongoing, facing the different methodologies and tools. ( Guarnieri et. all, 2006)
Nowadays the generation of a 3D model is mainly achieved using non-contact systems based on light waves, in particular using active or passive sensors. We can currently distinguish four alternative methods for object and scene modelling: (i) image-based rendering, which does not include the generation of a geometric 3D model but, it might be considered a good technique for the generation of virtual views; (ii) image-based modelling (e.g. photogrammetry), the widely used method for geometric surfaces of architectural objects, precise terrain and city modelling as well as Cultural Heritage documentation; (iii) range-based modelling (e.g. laser scanning), which is becoming a very common approach for the scientific community but also for non-expert users such as Cultural Heritage professionals; (iv) combination of image- and range-based modelling, as they both have advantages and disadvantages and their integration can allow the generation of complete and detailed 3D models efficiently and quickly.( Almagro A., Almagro Vidal A., 2007) In this study, two different case studies were realized with both techniques and obtained results were compared by using statistical methods. These two methods are TLS and Photogrammetry techniques which are widely used in
documentation of cultural heritage monument. The terrestrial laser scanner system used for this project is Leica by using statistical methods HDS 6000 and we prefered Samsung S630 which is a non-metric camera for terrestrial photogrammetry. Also, we used Cyclone Software for TLS data and PhotoModeler software for Photogrammetry.
2. DATA AND METHODOLOGY
2.1 The Study Area
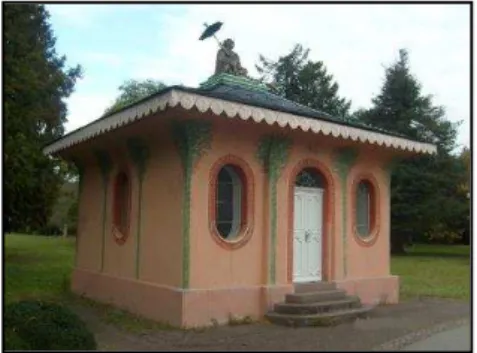
In this study, Chinese Tea House was selected as the model which was built between 1764-1765(Figure 1). It is it is located in Süd campus of Karlsruhe Institute of Technology in Germany. The building used for growing pheasants until 1773 was restored as a teahouse in the garden of the pavilion during the conversion. Moreover, Chinese workers coming to work at the campus building in 1825 were used to rest in the break time given for tea drinking during the construction of the campus buildings, The building of Karlsruhe Institute of Technology had been modelled by terrestrial laser scanning method and terrestrial photogrammetric method [1].
Figure 1: Chinese Tea House
The International Archives of the Photogrammetry, Remote Sensing and Spatial Information Sciences, Volume XLII-2/W1, 2016 3rd International GeoAdvances Workshop, 16–17 October 2016, Istanbul, Turkey
This contribution has been peer-reviewed.
2.2 Terrestrial Laser Scanning
Laser scanning, from the air or from the ground, is one of those technical developments that enables a large quantity of three-dimensional measurements to be collected in a short space of time. It generates a point cloud in a local coordinate system with intensity values; additional information such as RGB values is usually provided by internal or external digital cameras. Laser scanners can operate from the ground or integrated into an airplane. The former is referred to as terrestrial laser scanning (TLS) whereas the latter is referred to as airborne laser scanning or LiDAR, although this latter term applies to a particular principle of operation which includes laser scanners used from the ground.Laser scanning from any platform generates a point cloud: a collection of XYZ co-ordinates in a common co-ordinate system that portrays to the viewer an understanding of the spatial distribution of a subject. It may also include additional information, such as pulse amplitude or RGB values. Generally, a point cloud contains a relatively large number of coordinates in comparison with the volume the cloud occupies, rather than a few widely distributed points. (English Heritage, 2007)
The study area was scanned by selecting ultra high mode for the four sides of building with Leica HDS 6000 which can get 500.000 points per second (Figure 2). Also, specific sphere targets were located for registration process during scanning process each different sides of building The four sides of building was scanned with 6 mm point accuracy.
Figure 2: Ultra High Mode Scanning
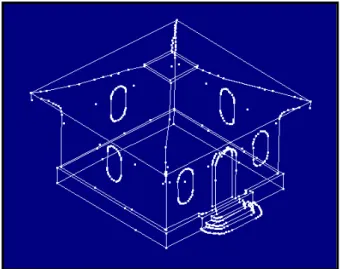
3D point cloud model of the building was generated with Cyclone software which is the laser data evaluation software belonging to Leica Geosystems. The 3D Model was done by using automatically mesh generation and interactive method (Figure 3).
Figure 3: 3D Model by TLS
2.3 Terrestrial Photogrammetry
Depending on the properties of an object which has to be modelled, different types of photogrammetry are used. Primary classification is made on the basis whether the photographs are taken from the air or from the ground. If satellite or airplane images show terrain, photogrammetry is aerial. Terrestrial photogrammetry use images made from a spot close to the ground and generally do not represent terrain, but smaller natural or artificial objects.(Hanke, K., Grussenmeyer, P., 2002)
In many studies, the use of one single stereo pair may not to reconstruct a complex building. So, many of photos must be used to cover an object as a whole. This helps to increase the accuracy when using images of an unknown or uncalibrated camera. For this reason, bundle adjustment is a wide spread technique in terrestrial photogrammetry of today (Figure 4). It combines the application of semi-metric or even non-metric cameras, convergent photos and flexible measurements in a common computer environment.
Figure 4: Examples for Terrestrial Photogrammetry
In the study area, 36 pieces were photographed to obtain 3D models from approximately 8.5 meters. 12 pieces of the captured images were used in the modeling process. PhotoModeler software developed by Eos System was preferred for Photogrammetric method. Also, we used Samsung Camera which is 5 MP non-metric camera. PhotoModeler, points to produce a 3D model were marked in least three pictures, because the marking of points forming the object at least three pictures is a good solution to increase accuracy of model. The 3D drawing was made to vectorize a detail in any of the three photos and 3D drawing has been completed with 12 photos (Figure 5).
Figure 5: The vectorising model
The International Archives of the Photogrammetry, Remote Sensing and Spatial Information Sciences, Volume XLII-2/W1, 2016 3rd International GeoAdvances Workshop, 16–17 October 2016, Istanbul, Turkey
This contribution has been peer-reviewed.
2.4 Statistical Methods
In the literature of the subject numerous tests of multivariate normality and rules of constructing their test statistics have already been proposed. Here a number of questions arise; which tests are best when it comes to power, error of the first kind; which have the properties of the omnibus test; which are directed tests, and finally, which of them should be used in practice. (Domanski, 2010)
In statistics, the Jarque–Bera test is a test of whether
sample data have the skewness and kurtosis matching a normal distribution. The test is named after Carlos Jarque and Anil K. Bera. The Jarque-Bera test statistic is defined as (Carlos M. Jarque, Anil K. Bera, 1987) :
(1)
Lilliefors (LF) test is a modification of the Kolmogorov-Smirnov test. The KS test is appropriate in a situation where the parameters of the hypothesized distribution are completely known. However, sometimes it is difficult to initially or completely specify the parameters as the distribution is unknown. In this case, the parameters need to be estimated based on the sample data. When the original KS statistic is used in such situation, the results can be misleading whereby the probability of type I error tend to be smaller than the ones given in the standard table of the KS test (Lilliefors, 1967) Given a sample of observations, LF statistic is defined as (Lilliefors, 1967),
(2)
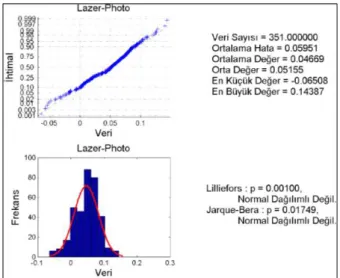
In this study, the approximately 350 base distances obtained from TLS and Photogrammetric Method were compared by using these statistical methods. The results were realized with both techniques (Figure: 6).
Figure 6: Laser-Photo Comparing with statistical methods
3. RESULTS AND DISCUSSIONS
The base distances were compared by using statistical methods and the coarse errors had removed from the both data. Thus, the standard deviation of the base distances was calculated for both methods. The standard deviation for TLS data was obtained as 3.4 cm and the standard deviation for Photogrammetry was obtained as 2.9 cm.
Also, the normal distribution for two methods weren’t
observed for the Jarque–Bera test and Lilliefors (LF) test.
As a result; the data obtained from the photogrammetric method is more accurate than the data obtained from TLS for this study.
In this study, 5 MP camera chosen for photogrammetric method have remained poor as resolution for the modelling of the building details and it led to disruptions.
Due to insufficient resolution, lots of points couldn’t
clearly mark for 3D model and this led to the error in the model. So, Standard deviation of photogrammetric methods were greatly influenced. Also, Cyclone program has lots of lacks of model producing and this situation effected the accuracy of TLS model.
4. CONCLUSIONS
The Chinese Tea House, which is located in The city of Karlsruhe in Germany, was produced as 3D model by terrestrial laser scanning method and terrestrial photogrammetric method. The distances between the points determining for the two systems and the differences between these distances was calculated. After the coarse errors had removed from the both data, error and confidence tests was performed.
The experiments performed in this study show that each of these methods has both advantages and disadvantages and one unique technique cannot recommendable for the documentation of historical artifacts. Photogrammetric data or terrestrial laser scanning data can be used by editing in various CAD programs for architectural projects. Because these methods use the coordinate information, both methods can be integrated. Every acquisition technique, i.e. laser scanning, photogrammetry or conventional surveying techniques presents obviously some limitations, but also very complementary assets (Grussenmeyer, P., 2008 et all). An integrated system that combines TLS and photogrammetric methods instead of being satisfied with a single method will give more accurate results for 3D modelling documentation works. Also, Recent developments in photogrammetry such as the point cloud generating from photogrammetric captures are currently used successfully in a number of lots of documentation applications.
The International Archives of the Photogrammetry, Remote Sensing and Spatial Information Sciences, Volume XLII-2/W1, 2016 3rd International GeoAdvances Workshop, 16–17 October 2016, Istanbul, Turkey
This contribution has been peer-reviewed.
References
Almagro A., Almagro Vidal A., 2007. Traditional Drawings Versus New Representation Techniques. The ISPRS International Archives of the Photogrammetry, Remote Sensing and Spatial Information Sciences, Athens, Greece, Vol. XXXVI-5/C53, pp. 52-57
Carlos M. Jarque, Anil K. Bera, 1987. “A Test for Normality of Observations and Regression Residuals” International Statistical Review / Revue Internationale de Statistique Vol. 55, No. 2, pp. 163-172
Domanski, C., 2010. “Properties of the Jarque-Bera Test” FOLIA OECONOMICA 235, Acta Universitatis Lodziensis. English Heritage, 2007. “3D laser scanning for heritage. Advice and guidance to users on laser scanning in archaeology and architecture” http://archive.cyark.org/temp/EH3dscanning.pdf (02.02.16)
Grussenmeyer, P., et all 2008. “Comparıson Methods Of Terrestrıal Laser Scannıng, Photogrammetry And Tacheometry Data For Recordıng Of Cultural Herıtage Buildings” The International Archives of the Photogrammetry, Remote Sensing and Spatial Information Sciences. Vol. XXXVII. Part B5. Beijing Guarnieri Et. All, 2006. “Digital Photogrammetry And TLS Data Fusion Applied To Cultural Heritage 3d Modelling”
Hanke, K., Grussenmeyer, P., 2002. “Architectural Photogrammetry: Basic Theory, Procedures, Tools” ISPRS Commission 5 tutorial
.
Lilliefors, 1967. “On the Kolmogorov-Smirnov Test for Normality with Mean and Variance Unknown” Journal of the American Statistical Association Volume 62, Issue 318. Stejakovic V., 2008. “Terrestrial Photogrammetry And Application To Modelling Architectural Objects” Architecture and Civil Engineering Vol. 6, No1, 2008, pp. 113 – 125. [1] - https://de.wikipedia.org/wiki/Fasanenschl%C3%B6sschen_
%28Karlsruhe%29#cite_note-Ludwig.2CSchmidt-Bergmann.2CSchmitt-1
The International Archives of the Photogrammetry, Remote Sensing and Spatial Information Sciences, Volume XLII-2/W1, 2016 3rd International GeoAdvances Workshop, 16–17 October 2016, Istanbul, Turkey
This contribution has been peer-reviewed.