DOI: http://dx.doi.org/10.1590/2446-4740.03015
*e-mail: [email protected] Received: 26 April 2016 / Accepted: 23 August 2016
Image segmentation and particles classiication using texture
analysis method
Mayar Aly Atteya*, Mohammed Abdel-Megeed Mohammed Salem, Doaa Abdel Karim Mohamed Hegazy, Mohammed Ismail Roushdy
Abstract Introduction: Ingredients of oily ish include a large amount of polyunsaturated fatty acids, which are important elements in various metabolic processes of humans, and have also been used to prevent diseases. However, in an attempt to reduce cost, recent developments are starting a replace the ingredients of ish oil with products of microalgae, that also produce polyunsaturated fatty acids. To do so, it is important to closely monitor morphological changes in algae cells and monitor their age in order to achieve the best results. This paper aims to describe an advanced vision-based system to automatically detect, classify, and track the organic cells using a recently developed SOPAT-System (Smart On-line Particle Analysis Technology), a photo-optical image acquisition device combined with innovative image analysis software. Methods: The proposed method includes image de-noising, binarization and Enhancement, as well as object recognition, localization and classiication based on the analysis of particles’ size and texture. Results: The methods allowed for correctly computing cell’s size for each particle separately. By computing an area histogram for the input images (1h, 18h, and 42h), the variation could be observed showing a clear increase in cell. Conclusion: The proposed method allows for algae particles to be correctly identiied with accuracies up to 99% and classiied correctly with accuracies up to 100%.
Keywords: Haar wavelet, Morphological operations, Texture analysis, Watershed segmentation.
Introduction
Long-chain polyunsaturated fatty acids (eicosapentaenoic acid, EPA and docosahexaenoic acid, DHA) are important elements for various metabolic processes in humans (Martins et al., 2013). The ingredients of oily ish include a large amount of polyunsaturated fatty acids, which are used in the prevention of heart and cancer diseases (Madeira et al., 2007; Martins et al., 2013; Perez-Garcia et al., 2011). Also, the microalgae Crypthecodinium cohnii are identiied as a good producer of DHA (Hiraishi et al., 2013; Martin, 2003). In order to reduce cost, recent developments are starting to replace the ingredients of ish oil with products of microalgae, which include 30 to 70% of DHA (Martins et al., 2013).
Cells of C. cohnii grow in a liquid dark environment
at 27 °C (Bhaud et al., 1991). During the life cycle of C. cohnii, two forms are observed: motile cells
and non-motile (cysts) (Hiraishi et al., 2013; Martin, 2003). Both forms can vary in size (10-50 μm) (Martin, 2003). The variation of cell size may indicate different stages of the cell life cycle - a small cell represents a young offspring and a cyst represents an adult cell. Motile cells appear generally in oval shape, while
non-motile cells (cyst) are generally round in shape and appear larger than the motile cells (Hiraishi et al., 2013; Martin, 2003).
The main objective of this paper is to devise a method to visually differentiate between the small (non-active) cells and cyst (active) ones in order to follow and observe morphological changes for active cells, while the cells are also kept in a certain age. To do so, the method will be based on two measurable parameters: cell size and cell texture.
The determination of cell size is an important issue in different areas. For example, the particle size distribution of a drug substance may have signiicant effects on the inal performance of the product (Brümmer, 2008; Paul, 2009). In wastewater treatment, it plays an important role to determine the size of organic matters and their relationship with the treatment process (Audrey et al., 1985). The same can be said for the prediction of relative amounts of various sizes of ine particles in Athabasca oil sands (Schutte et al., 1999). Furthermore, texture particle property represents an important visual indication to
classify active cells out of non-active ones (Mihran and Anil, 1998).
A number of publications can be found in the literature dealing with image analysis for bioprocesses. For example, Wartelle et al. (2004) counted animal cells by means of three parameters: size of the high pass ilter to enforce the shape detection, threshold value used after the Hough transformation, and the number of circles which were examined. The correlation coeficient between reference (ground truth) and data sets has been equal to 0.99. Bittner et al. (1998), processed images of Saccharomyces cerevisiae to examine cell size distribution. The process was based on two parameters (optical properties of the cells, and threshold values) to facilitate cell recognition. The results show error percentage below 2%. Similar experiments were carried out on liquid drops and air bubbles (Galindo et al., 2005; Ribeiro et al., 2009), oil drops (Dominguez and Corkidi, 2011), and crystal drops (Rivoire et al., 2009). Nevertheless, the most relevant literature on this subject has been introduced by Jiang et al. (2010). These authors provided a strong method for segmentation, which is composed of image de-noising using Haar wavelet transform, histogram equalization for quality improving, edge detection and morphological operations to remove debris and gain closed contour for segmented objects. The presented work follows the aforementioned approach taking into consideration the different features of our images and how to process the connected and overlapped particles.
The C. cohnii images can be obtained by probe microscopy. Different microscopic devices are listed in Morita (2006). Nevertheless, microscopic images suffer from tricky problems, such as the small size of the particles, poor colour balance, un-sharpening, and low contrast and resolution (Bazila and Mir, 2014). SOPAT GmbH is a specialized company for measuring the development of particles in multiphase processes. The SOPAT-System (Smart On-line Particle Analysis Technology) is a photo-optical image acquisition device combined with innovative image analysis software. The system is being optimized for biological systems (SOPAT Bio Pro) so that cells’ information is extracted from images taken by an in-situ microscope probe, where the cells are evaluated within their own environment. Particles’ size, morphology, concentration and other relevant parameters are measured simultaneously by automatic image analysis programs.
The method presented here is implemented using MATLAB programming software, including the required methods for in-situ observation.
Methods
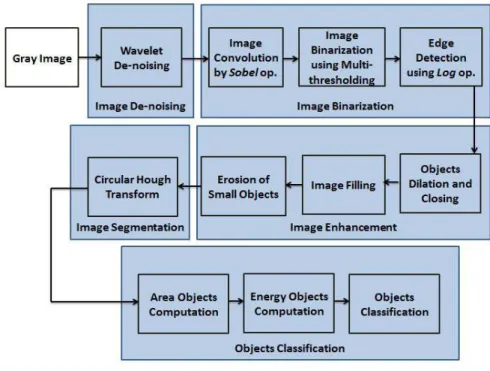
As shown in the literature, image processing and analysis play an important role in in-line observation of microorganisms using microscopic tools. Hence, the proposed method is divided into two major steps: image segmentation and object classiication. The image segmentation process includes image de-noising, image binarization, image enhancement, and object recognition and localization. Object classiication is achieved on the basis of cells size, and energy texture parameters. Figure 1 summarizes the various steps of the proposed method.
Wavelet based de-noising processing
The irst step in the proposed method is image de-noising, which is the process of removing out noise from the captured image. The approach can be summarized in three steps: (1) Stationary wavelet transform is applied to the noisy image; (2) Normalization is used to modify the coeficients of the wavelet. (3) The inverse discrete stationary wavelet transform is performed to obtain the denoised image (Jiang et al., 2010).
Haar wavelet has been used in the proposed method (Ismail and Khan, 2012). The scaling of the wavelet function can be represented as follows:
( ) ( ) ( )
, , , , ,
j k l x y j k x j l y
Φ = Φ Φ (1)
As show, it is described as an average function, which used for image approximation. Also, the mother wavelet function is described as the average of difference, which is used for image details. It is extended into three functions described as,
( ) ( ) ( )
, , , , ,
h
j k l x y j k x j l y
Ψ = Φ Ψ (2)
( ) ( ) ( )
, , , , ,
v
j k l x y j k x j l y
Ψ = Ψ Φ (3)
( ) ( ) ( )
, , , , ,
d
j k l x y j k x j l y
Ψ = Ψ Ψ (4)
where h, v, d are horizontal, vertical and diagonal details coeficients respectively.
Equation 1 is generated by the approximating of columns in the x-direction and approximating the rows in the y-direction. Horizontal details are obtained by approximating columns in the x-direction and detailing rows in the y-direction. Vertical details are computed by detailing columns in the x-direction and approximating rows in the y-direction. The diagonal image is performed by detailing both directions, x, and
In order to create a new image that contains the horizontal, vertical and diagonal edges that had been smoothed in the approximation image, the three detailed images are converted to binary images by a suitable threshold deined for each of them. Different threshold algorithms are described in Sachin and Dharmpal (2011) – from those, the authors chose the ‘penalized threshold’ method, which is based on sorting the details coeficients (d) in descending order and then computing the global threshold value (T) by minimizing the penalized criterion, as shown
in Equation 5:
2 2
1 2 ( )
[ ]
min t
t x x
n
T arg d t ln
t =
= − ∑ + σ α + (5)
where, t = 1, 2, …, n; α: sparsity parameter > 1; n: number of coeficients; and σ: standard deviation
of the zero mean gaussian white noise in the denoising model (Moghtased-Azar and Gholamnia, 2014). Finally, the inverse discrete stationary wavelet transform is performed to obtain the denoised image (Raviraj and Sanavullah, 2007).
Image binarization
Edge detection is one of the most frequently used techniques in image binarization. An edge is characterized by a high local change of the intensity in
the image (Maini and Aggarwal, 2009). Edge detection can be provided by various operators, such as: Sobel, Canny, Roberts, Prewitt, and log. In this paper we use a mix of Sobel and log operators. The following matrix is called Sobel kernel, and it is applied to the image for extracting horizontal and vertical edges (Vincent and Folorunso, 2009).
1 0 1 2 0 2 1 0 1
K −
= − −
(6)
The log operator is used to smooth the image with Gaussian ilter in order to reduce its sensitivity to noise, and then convolves the smoothed image with a Laplacian ilter. Alternatively, the image is convolved with a linear ilter - the Laplacian of Gaussian (LoG kernel):
( )
2 2
2
2 2
4 2
2
, 1 / [ –1
2 ( )]
x y
x y
LoG x y e
+ −
σ
+ = − πσ
σ
(7)
The edges can be detected by inding the zero crossing of the 2nd derivative of the image intensity.
Also, image multi-level thresholding is performed on the image for binarization. This process determines various threshold values to segment the image into
several clusters, C. This is done using a very popular thresholding technique - Otsu’s method (Deng-Yuan et al., 2011), that selects an optimal threshold value, t*, by maximizing σ2
B as follows:
{ }
{
2 ( )}
1*, *,2 ,c1* B 1*, *,2 ,c1*
t t …t− = Arg Max σ t t …t− (8)
1 1
1≤ < …<t tc− <L
with, 2 1
2
( )
C
B i= i µi µT
σ = ∑ ω − (9)
where, ωi: cumulative of the occurrence probability
of grey level i; μT: mean intensity of the image. The proposed method applies the convolution process using Sobel kernel, which is favourable for the next operation (image multi-level thresholding). Again the edge detection process is performed using log operator for extracting strong edges.
Image enhancement
To get a complete contour of segmented objects, dilation, erosion, closing, and region illing operations are applied on the binary image.
Dilation and erosion are the main morphological operations. Morphological image processing is a collection of non-linear operations related to shape or morphology of features in an image. Morphological operations rely only on the relative ordering of pixel values, not on their numerical values, and therefore are especially suited to processing binary images.
Suppose A is an image set and B a structuring element. Dilation and erosion operations are described as in Equations 10 and 11, respectively.
( )
: z
A⊕ =B z∈E B ∩ ≠ φA (10)
( ).
: z
A− =B z∈E B ∩A (11)
where, E: Euclidean distance = Z2, φ: for the empty
set, Bz: relection of B; Bz = (−b: b ∈B).
Closing operation is deined as dilation followed by erosion, using the same structuring element for both operations. Region illing is based on set of dilations, complement, and intersections, as in the following equation:
1 )
( c
f f
X = X − ⊕B ∩A (12)
where, X0: irst point inside the boundary; Ac: the
complement of set A; f = 1, 2, 3, …(El-dosuky et al., 2014).
The results of these operations are inluenced by the size and shape of the structuring element B. In fact, the choice of the structuring element depends on the shape of the objects in the image. In our case,
the suitable element is the ‘disk-shaped’ structuring element based on the circular shaped of the biological objects. To identify the objects, the dilation process is performed, followed by region illing to complete the pores of the objects. Furthermore, a median ilter is applied to smooth the contour curve after the erosion operation.
Object recognition and localization
It may happen that two or more objects are connected in their borders - this effect has been neglected by many authors. The problem is that, if the number of connected objects is large with respect to the total number of objects, it may cause signiicant classiication errors (Pons and Vivier, 1999). Therefore, we shall extract mutually connected objects using a Watershed Transform.
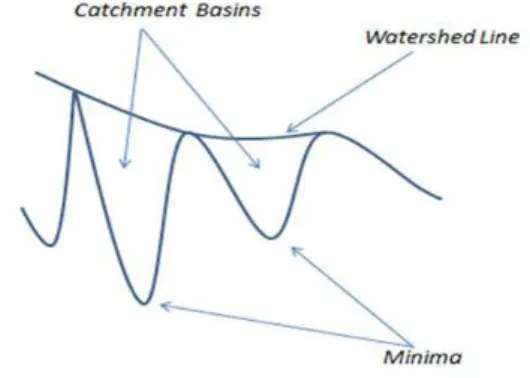
Watershed transformation belongs to a class of methods for region-based segmentation. The basic step of this transformation is to visualize an image (grey scale, or binary) into a topographic surface, which includes three notions: minima, catchment basins, and watershed lines, as shown in Figure 2.
Each regional minimum of this surface is represented as a catchment basin. The idea of watershed transformation is to pierce a hole in each minimum of catchment basin and allowing it to sink in a lake. The water would be inserted gradually from local minimum irstly until ill up different catchment basins in the image. When the rising water in different basins would risk merging, dams are built to prevent the merging of water coming from two different basins. These boundary dams correspond to the watershed lines that needed to divide (Lu and Ke, 2007).
There are various methods are used for the watershed transform, such as gradient, marker-controller and distance transform (Aayushi, 2014; Beucher, 1991). The gradient magnitude method is applied to
gradient images instead of grey level ones (Belaid and Mourou, 2009; Jackway, 1996). This method has an over-segmentation problem due to noise in the image. To solve this problem, the marker-controller watershed approach is introduced. It consists of markers to be deined as new minima of the gradient image objects. After the segmentation process, the watershed line for each object can be separated from its neighbors (Aayushi, 2014).
In the proposed method, the authors have chosen distance transform to perform the segmentation step. It calculates a distance map from a center point to the edges of the object. The centers are determined by performing multiple successive erosions with a suitable structuring element until all foreground regions of the image are eroded away. Then it ills that topological map with imaginary water. Where two watersheds meet a dam is built to separate them (Aayushi, 2014; Lu and Ke, 2007). The distance transform provides a metric of the separation of points in the image such as Euclidean, City Block, or Chessboard.
The chessboard metric has been used to measure the path between the pixels based on an 8-connected neighborhood. The pixels whose have edges or corners are touched, are one unit apart. The actual structuring element that should be used depends on which distance metric is chosen. A (3x3) ‘square-shaped’ element provides the chessboard distance transform.
Object classiication
The object is recognized by computing connected component labelling operations after applying the previously described methodologies (Stefano and Bulgarelli, 1999). Then it is possible to determine the number of cells in each input image and then measure the concentration of cells during growth. After that, relevant parameters of each cell size can be obtained: area, perimeter, diameter, and radius.
The process of classiication is unsupervised and based on two fundamental features: cell size, and cell texture. The area of the cell is determined from its radius. Also, cell texture has been chosen to provide a way for accurate classiication, ensuring the effectiveness and reliability of the process.
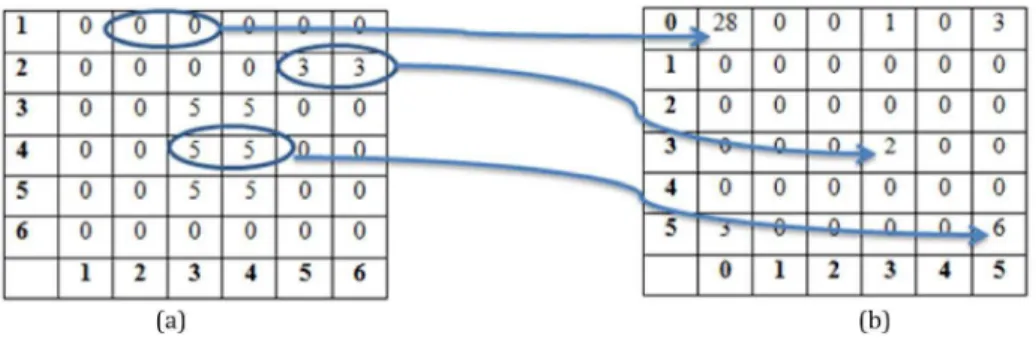
The texture of an image is represented by the distributions and relationships between the grey levels of the image. The co-occurrence matrix is identiied as an estimation matrix for joint probability of two pixels P(i, j). The dimension of this matrix is equal to the number of grey levels in the image (G) and its values are associated with the number of occurrences of pairs of grey levels (Figure 3). The matrix represents the most popular second-order statistical features for texture analysis (Malik et al., 2001). Indeed, from this matrix, we can compute the following properties: energy, entropy, contrast, homogeneity and correlation (Andrzej and Michal, 1998; Mihran and Anil, 1998). Mostly, energy is the most crucial factor used in our method, while the remaining factors do not properly differentiate between the objects due to the similarity of the particles’ values within the image. The angular second moment (energy) is computed as:
( )2
1 1
0 0 ,
G G
i j P i j
− −
= =
∑ ∑ (13)
Results
Two types of datasets are used to evaluate the proposed method. The irst data set is a synthetic image, generated by a computer program. Synthetic images allow for a ‘ground truth’ for all cells – known location (centre) and radius of each cell. The presented method is applied on 5 different synthetic images, with the same dimensions, 1024 × 1024, and almost equal number of cells. The purpose of that is to calibrate and test the reliability of the proposed method.
Real images of C. cohnii cells growing in a liquid
environment comprise the second data set. Cell growth is tracked by SOPAT-Probe at 1h, 18h, and 42h. Figure 4 represents the output of each step in the experiment - as described in Figure 1.
Figure 4a represents the initial grey image. Figure 4b shows the irst step - de-noising using Haar wavelet transform as a pre-processing step for the microalgae microscopic images. The initial image is decomposed into three levels, and the hard threshold is chosen for all levels. This eliminates noise effectively and also retains the edges information. The next step, image convolution by Sobel kernel, is shown in Figure 4c, and for better visualization, the image contrast is adjusted as shown in Figure 4d.
For the binary image, the multi-thresholding using Otsu’s method is applied, followed by edge detection via log operator (Figure 5a). The log parameters are assigned as: t = 0.0005, σ = 2.5. In the resulting image,
a clear identiication of the cells could not be made. The enhancement process is started by closing and dilating the objects to identify the features of cells,
as shown Figure 5b. Even if the dilation of the cells borders leads to connect previously unconnected cells the watershed technique would be able to overcome this issue. To improve identiication, the holes of the particle are illed, as shown in Figure 5c. The resulting image again is not optimal since it contains a large amount of debris. This problem is solved by applying one of the morphological operations, erosion, with “disk-shaped” structuring element of size “10”. In order to remove such debris and get the circular edges more smoothed, median ilter technique is applied with a mask window (9×9), as shown in Figure 5d.
After that, the problem of connected objects, which are segmented as one component, must be faced. The objective is to ind the area size of the individual object. To do so, distance transform chessboard is used along with watershed to segment mutually connecting objects. The result is shown in Figure 6.
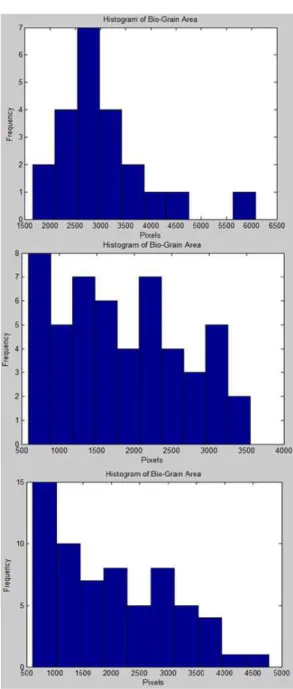
Now, the cell’s size can be computed for each object separately. By computing an area histogram for the input images (1h, 18h, and 42h), size variation can be observed, showing a clear increase in cell
Figure 4. (a) Grey scale image of microalgae; (b) Denoised image of microalgae by Haar wavelet method; (c) Image convolution using
concentration. Figure 7 shows the area histogram of the given images.
We found that the size parameter can be used to clearly differentiate cells. In our case, the cells with a radius greater than or equal to 29 are classiied as active cells. It may happen by chance that a certain group of elements have a radius 30 or more, however some may
not really be biological cells. Therefore, another set of parameters must be used for accurate classiication.
Energy texture is then measured for the denoised image for better object classiication. Objects which have energy greater than 0.12 are classiied as active objects, otherwise they are classiied as non-active. Overall, the classiication process is set for radius >= 29 and energy >= 0.12. These threshold values were chosen based on try and error (Figure 8). Often, the interested objects are visualized as a circular shape. By utilizing the centre and radius (neighbourhood size) of each object, the energy of the object could be measured separately. In Figure 8, the green squares represent active objects and blue ones represent non-active cells - rectangular squares are just the coloured border.
The accuracy percentage is given by calculating the average values of this metric for the input images, and is shown in Table 1. The method was applied to 5 different images with dimensions 2272 × 1704 and the accuracy values reached up to 99% for segmentation and 100% for classiication.
Figure 5. (a) Binary image of microalgae; (b) Image after closing and dilation; (c) Image after illing holes; and (d) Image after erosion and median ilter.
technique, log operator for edge extraction, morphological operations for good enhancement, watershed transform for connected objects extraction, and energy texture and cell size for inal classiication. Area histogram has been used to monitor the concentration rate during the growth process at different times. At any rate, the calculated values were very close to those obtained by manual segmentation, with accuracy up to 99%.
The results of this method have been compared with those obtained by Bittner et al. (1998) and Jiang et al. (2010). In Jiang et al. (2010), a strong method for microalgae segmentation was presented and reached excellent accuracy. However, it did not address the case of connected objects and was applied to only 2 real images of Nitzschia closterium Eh and
Chlorella, which are not enough to assess the goodness
of a segmentation method. The method presented in this paper has been applied to process 5 synthetic images and 5 real images. Results showed that it can handle the separation of connected and overlapped particles by applying the watershed transform, delivering good accuracy. The drawback of the watershed method is over-segmentation. Sometimes, it divides a perfect object into multiple ones and counts them as more than one object. Alternatively, a circular Hough transform may be used to segment the circular shapes and extract mutually connected objects, while preserving high accuracy. In Bittner et al. (1998), images of
Saccharomyces cerevisiae were processed to examine
Figure 7. Area histogram (in pixels) of bio-cells for 1h, 18h, and 42h.
Table 1. Accuracy percentage for input images. Image 1
1h (1) Image 218h (1) Image 342h (1) Image 41h (2) Image 518h (2)
Synthetic objects (ground truth) 22 55 66 58 100
Detected objects 22 54 65 58 99
Segmentation accuracy (%) 100 99 99 100 99
Classiication accuracy (%) 100 100 100 100 100
Discussion
In this work, a method for in-line identiication of micro-organisms has been presented. The method is supported by Haar wavelets, as the powerful de-noising
Figure 8. Image classiication based on size and energy texture parameters - green squares represent active objects and blue ones
the cell size distribution. The authors achieved error percentage below 2%. The method proposed in this paper was also able to achieve the same goal with high accuracy and error percentage below 1%.
Whatever the segmentation method applied or the dataset used, the correct localization of the cells is an import element to allow for accurate classiication. In fact, the size parameter has been the most important factor when differentiating between the cells. The method was capable of identifying small objects as non-active and other cells as active ones (biological cells). The radius of each cell has been computed separately after the segmentation step by using the properties extracted by the connected component labelling method. Energy texture property has also been an important feature for accurate classiication.
One of the limitation of this work is that it must be applied to high-contrast images. Low-contrast images would not render satisfactory results. The proposed technique has been based on the basis of grey level intensity, while the edges are characterized by a high local change of the intensity within the image. Since low-contrast images have low gradient values, the process of edge extraction can not be performed properly.
Overall, the proposed method can reduce the processing time for in-line identiication of microorganisms when compared to other methods described in the literature. The classiication process used in this paper does not require a training data set (unsupervised) and is based on basic properties of segmented cells (texture and size), contributing to the reduction of processing time. In order to further improve processing time, and allow for in-line observation and control, the authors suggest the use of parallelization on different cores in a multi-core computer, which would contribute to decrease the required time mathematical processing.
Acknowledgements
Many thanks were provided to Dr.-Ing. Stefan Junne and Prof.Dr. Peter Neubauer, chair of Bioprocess Engineering, Berlin University of Technology, for providing the datasets for our study.
References
Aayushi AK. Image segmentation using watershed transform. International Journal of Soft Computing and Engineering. 2014; 4(1):5-9.
Andrzej M, Michal S. Texture analysis methods: a review. Brussels: Technical University of Lodz, Institute of Electronics; 1998. COST B11 report.
Audrey DL, George T, Takashi A. Characterization of the size distribution of contaminants in wastewater: treatment
and reuse implications. Journal Water Pollution Control Federation. 1985; 57(7):805-16.
Bazila, Mir AH. Segmentation of microscopic images of living cells: a study. International Journal of Signal Processing: Image Processing and Pattern Recognition. 2014; 7(2):327-38. http://dx.doi.org/10.14257/ijsip.2014.7.2.30.
Belaid LJ, Mourou W. Image segmentation: a watershed transformation algorithm. Image Analysis & Stereology. 2009; 28(2):93-102. http://dx.doi.org/10.5566/ias.v28.p93-102. Beucher S. The watershed transformation applied to image segmentation. Scanning Microscopy International. 1991; 6:299-314.
Bhaud Y, Salmon J, Soyer-Gobillard M. The complex cell cycle of the dinoflagellate protoctist crypthecodinium cohnii as studied in vivo and by cytofluorimetry. Journal of Cell Science. 1991; 100(3):675-82.
Bittner C, Wehnert G, Scheper T. In situ microscopy for on-line determination of biomass. Biotechnology and Bioengineering. 1998; 60(1):24-35. http://dx.doi.org/10.1002/ (SICI)1097-0290(19981005)60:1<24::AID-BIT3>3.0.CO;2-2. PMid:10099402.
Brümmer H. Particle characterisation in excipients, drug products and drug substances. Life Science Technical Bulletin. 2008; 1(11), 1-6.
Deng-Yuan H, Ta-Wei L, Wu-Chih H. Automatic multilevel thresholding based on two-stage Otsu’s method with cluster determination by valley estimation. International Journal of Innovative Computing, Information, & Control. 2011; 7(10):5631-44.
Dominguez AR, Corkidi G. Automated recognition of oil drops in images of multiphase dispersions via gradient direction pattern. In: 4th International Congress on Image and Signal Processing; 2011; Shanghai. U.S.: IEEE; 2011. p. 1209-13.
El-dosuky MA, Riad AM, Khedr WM, Aoud M. Image restoration based on morphological operations. International Journal of Computer Science. Engineering and Information Technology. 2014; 4(3):9-21.
Galindo E, Larralde-Corona CP, Brito T, Cordova-Aguilar MS, Taboada B, Vega-Alvarado L, Corkidi G. Development of advanced image analysis techniques for the in situ characterization of multiphase dispersions occurring in bioreactors. Journal of Biotechnology. 2005; 116(3):261-70. http://dx.doi.org/10.1016/j.jbiotec.2004.10.018. PMid:15707687.
Hiraishi O, Prabowo DA, Suda S. Diversity of crypthecodinium spp. (dinophyceae) from okinawa prefecture, japan. Materials Science and Technology. 2013; 21:181-91.
Ismail B, Khan A. Image de-noising with a new threshold value using wavelets. Journal of Data Science. 2012; 10:259-70. Jackway PT. Gradient watersheds in morphological scale-space. Image Processing, IEEE. 1996; 5(6):913-21. http:// dx.doi.org/10.1109/83.503908. PMid:18285180.
Lu N, Ke X. A segmentation method based on gray-scale morphological filter and watershed algorithm for touching objects image. In: Proceedings of the Fourth International Conference on Fuzzy Systems and Knowledge Discovery; 2007; Haikou. U.S.: IEEE; 2007. p. 474-8.
Madeira V, Ruano F, Silva T, Reis A, Mendes A, Guerra P. Study of docosahexaenoic acid production by the heterotrophic microalga crypthecodinium cohnii ccmp 316 using carob pulp as a promising carbon source. World Journal of Microbiology & Biotechnology. 2007; 23(9):1209-15. http://dx.doi.org/10.1007/s11274-007-9349-z.
Maini R, Aggarwal H. Study and comparison of various image edge detection techniques. International Journal of Image Processing. 2009; 3(1):1-11.
Malik J, Belongie S, Leung T, Shi J. Contour and texture analysis for image segmentation. International Journal of Computer Vision. 2001; 43(1):7-27. http://dx.doi. org/10.1023/A:1011174803800.
Martin ES. Docosahexaenoic acid production by the marine alga crypthecodinium cohnii: applied microbiology and biotechnology [thesis]. Netherlands: Delft University Press; 2003.
Martins DA, Custodio L, Barreira L, Pereira H, Ben-Hamadou R, Varela J, Abu-Salah KM. Alternative sources of n-3 long chain polyunsaturated fatty acids in marine microalgae. Marine Drugs. 2013; 11(7):2259-81. http:// dx.doi.org/10.3390/md11072259. PMid:23807546. Mihran T, Anil KJ. Texture analysis. In: Chen CH, Pau LF, Wang PSP, editors. The handbook of pattern recognition and computer vision. 2nd ed. Singapore: World Scientific Publishing; 1998. p. 207-48.
Moghtased-Azar K, Gholamnia M. Effect of using different types of threshold schemes (in wavelet space) on noise reduction over GPS times series. Journal of Geomatics Science and Technology. 2014; 4(1):51-66.
Morita S. Roadmap of scanning probe microscopy. In: Avouris P, Bhushan B, Bimberg D, von Klitzing K, Sakaki H, Wiesendanger R, editors. Nano science and technology. Berlin: Springer; 2006. p. 7-14.
Paul K. Particle size analysis. Pharmaceutical Technology Europe. 2009; 21(4):1-3.
Perez-Garcia O, Escalante FME, de Bashan LE, Bashan Y. Heterotrophic cultures of microalgae: metabolism and
potential products. Water Research. 2011; 45(1):11-36. http:// dx.doi.org/10.1016/j.watres.2010.08.037. PMid:20970155. Pons M-N, Vivier H. Biomass quantification by image analysis. Advances in Biochemical Engineering/Biotechnology. 1999; 66:133-84. http://dx.doi.org/10.1007/3-540-48773-5_5. Raviraj P, Sanavullah MY. The modified 2D-Haar wavelet transformation in image compression. Middle-East Journal of Scientific Research. 2007; 2(2):73-8.
Ribeiro MMM, Bras LMR, Gomes EF, Guimaraes MML. Drop distribution determination in a liquid-liquid dispersion by image processing. International Journal of Chemical Engineering. 2009; 2009:746439.
Rivoire A, Pinoli J, Fevotte G, Presles B, Debayle J. In situ particle size measurements during crystallization processes using image analysis. In: XII Congrès de la Société Française de Génie des Procédés Pour relever les défis industriels du XXI siècle A la croisée des Sciences et des Cultures; 2009; Marseille. France: Societe Fancaise de Genie des Procedes; 2009.
Sachin DR, Dharmpal DD. Wavelet based image denoising technique. International Journal of Advanced Computer Science and Applications. 2011; 2(3):49-53.
Salem MAM. Medical image segmentation: multiresolution-based algorithms [thesis]. Cairo: Ain Shams University; 2011.
Schutte R, Thompson GR, Donkor KK, Duke MJM, Cowles R, Li XP, Kratochvil B. Estimation of particle size distribution in Athabasca oil sands by indirect instrumental neutron activation analysis. Canadian Journal of Chemistry. 1999; 77(10):1626-37.
Stefano L, Bulgarelli A. A simple and efficient connected components labeling algorithm. In: Proceedings of the International Conference on Image Analysis and Processing; 1999; Venice. U.S.: IEEE Computer Society; 1999. p. 322-7. Vincent OR, Folorunso O. A descriptive algorithm for sobel image edge detection. In: Proceedings of Informing Science & IT Education Conference (InSITE); 2009; Nigeria. California: Informing Science Institute; 2009. p. 97-107. Wartelle F, Dhulster P, Guez JS, Cassar JP, Suhr H. Real time in situ microscopy for animal cell concentration monitoring during high density culture in bioreactor. Journal of Biotechnology. 2004; 111(3):335-43. http:// dx.doi.org/10.1016/j.jbiotec.2004.04.028. PMid:15246669.
Authors
Mayar Aly Atteya1*, Mohammed Abdel-Megeed Mohammed Salem1, Doaa Abdel Karim Mohamed Hegazy1, Mohammed Ismail Roushdy2
1 Scientiic Computing Department, Faculty of Computers and Information Systems, Ain Shams University, Abbasia, Cairo, 11566, Egypt.