Abstract—The purpose of a seat suspension system are attempt to isolate vehicle vibration excitations from being transmitted to the drivers and to improve passenger comfort. Traditional seat suspension systems are composed of 2-DOF, that is springs and viscous dampers. This paper, presents a 7-DOF vehicle’s driver model with seat suspension system. A genetic algorithm is applied to search for the optimal parameters of the seat in order to minimize seat suspension deflection and driver’s body acceleration to achieve the best comfort of the driver. The simulation results were compared with the ones of the passive suspensions through step and sinusoidal excitation of the seat suspension system for the currently used suspension systems. The optimum design parameters of the suspension systems obtained are kse=5014.1 N/m and cse=55.5 N.s/m in case of
sinusoidal input and kse=42934 N/m and cse=50 N.s/m in case of
step input, respectively.
Index Terms— Biodynamic response, Genetic algorithms, Seat-driver suspension model, Simulation.
I. INTRODUCTION
In the last fifty years, many people become more concerned about the ride quality of vehicle which is directly related to driver fatigue, discomfort, and safety. As traveling increases, the driver is more exposed to vibration mostly originating from the interaction between the road and vehicle. The vibration experience by the driver is known as whole-body vibration, which occurs when the body is supported on a vibrating surface. Research has shown that operators exposed to low-frequency whole body vibration can experience temporary and even permanent injuries.
In an early studies, various biodynamic models have been developed to depict human motion from single-DOF to multi-DOF models. These models can be divided as distributed (finite element) models, lumped parameter models and multibody models. The distributed model treats the spine as a layered structure of rigid elements, representing the vertebral bodies, and deformable elements representing the intervertebral discs by the finite element method [1]-[2]. Multibody human models are made of several rigid bodies interconnected by pin (two-dimensional) or ball and socket
Manuscript received December 31, 2009.
W. Abbas, Engineering Physics and Mathematics Department, Faculty of Engineering (Mataria), Helwan University, Cairo, Egypt. (phone:
+201-0139-5551; e-mail: wael_abass@hotmail.com).
Ossama B. Abouelatta, Production Engineering and Mechanical Design Department, Faculty of Engineering Mansoura University 35516 Mansoura,
Egypt. (e-mail: abouelatta@mans.edu.eg).
Magdy S. El-Azab, Mathematics and Engineering Physics Department, Faculty of Engineering, Mansoura University, 35516 Mansoura, Egypt.
(e-mail: ms_elazab@hotmail.com).
Adel A. Megahed, Mathematics and Engineering Physics Department, Faculty of Engineering, Cairo University, Cairo, Egypt. (e-mail:
adelam@menanet.net).
(three-dimensional) joints, and can be further separated into kinetic and kinematic models. The kinetics is interested in the study of forces associated with motion, while kinematics is a study of the description of motion, including considerations of space and time, and are often used in the study of human exercise and injury assessment in a vehicle crash.
The lumped parameter models consider the human body as several rigid bodies and spring-dampers. This type of model is simple to analyze and easy to validate with experiments. However, the disadvantage is the limitation to one-directional analysis. These models can be summarized as: 1-DOF model [3], 2-DOF human body [4], 3-DOF analytical model [5], 4-DOF human model [6]-[8], 6-DOF nonlinear model [9], and 7-DOF model [10]. A complete study on lumped-parameter models for seated human under vertical vibration excitation has been carried out by Liang and Chiang [11], based on an analytical study and experimental validation. So, it is known that the lumped parameter model is probably one of the most popular analytical methods in the study of biodynamic responses of seated human subjects, though it is limited to one-directional analysis. However, vertical vibration exposure of the driver is our main concern.
On the other hand, a genetic algorithms (GA) method increases the probability of finding the global optimum solution and avoids convergence to a local minimum which is a drawback of gradient-based methods. Therefore, genetic algorithms optimization is used to determine both the active control and passive mechanical parameters of a vehicle suspension system and to minimize the extreme acceleration of the passenger‟s seat, subjected to constraints representing the required road-holding ability and suspension working space [12]-[14].This work presents an optimization of a 7-DOF vehicle‟s driver with seat suspension system using genetic algorithms to determine a set of parameters to achieve the best comfort of the driver.
II. MATHEMATICAL MODEL
A. Seated-Human Driver Model
This section is devoted to the mathematical modeling of proposed model, including the seat suspension and human body as illustrated in Fig. 1. The human-body, has a 7-DOF that proposed by Patil and Palanichamy [15].The human-body consists of seven mass segments interconnected by eight sets of springs and dampers. The seven masses represent the following body segments: head and neck (m1), back (m2), upper torso (m3), thorax (m4), diaphragm (m5), abdomen (m6) and thighs and pelvis (m7). The arms and legs are combined with the upper torso and thigh, respectively. The stiffness and damping properties of thighs and pelvis are
pplication of enetic lgorithms to he Optimal
Design of ehicle‟s Driver
-
eat uspension odel
k8 and c8, abdomen are k6 and c6, the diaphragm are k5 and c5, the thorax are k4 and c4 ,the torso are (k2, k3) and (c2, c3), back are k7 and c7, and head are k1 and c1. The seat suspension system is represented by 1-DOF, consists of seat mass (mse), spring constant(kse) and damping coefficient (cse). The biomechanical parameters of the model are listed in Table 1.
Fig. 1 Schematic diagram of seated-human model. Table 1 System parameters of the proposed seat suspension and human-body model [10, 16].
Mass (kg)
Damping coefficient (N.s/m)
Spring constant (N/m) m1 = 5.55 C1 = 3651 k1 = 53640
m2 = 6.94 C2 = 3651 k2 = 53640
m3 = 33.33 C3 = 298 k3 = 8941
m4 = 1.389 C4 = 298 k4 = 8941
m5= 0.4629 C5= 298 k5= 8941
m6= 6.02 C6= 298 k6= 8941
m7= 27.7 C7= 3651 k7= 53640
C8= 378 k8= 25500
mse= 15 Cse= 2156 kse= 19600
Therefore, the governing equation of motion of the seat suspension can be obtained as follows:
(1) A mathematical model of the human-body can be obtained as follows:
(2)
(3)
(4)
(5)
(6)
(7)
(8)
B. Input Profile Excitations
The excitation input from the road is transmitted to the vehicle floor. For the simplification of the dynamic modeling, it is assumed that there exists only the vertical motion of the vehicle. Both pitching and rolling motions are ignored in this study.
In this work, two types of the input profiles excitation are adopted to evaluate the proposed system. The sinusoidal profile is firstly used, which is described by, where, , and A (0.025 m) is the hump height. D (0.8 m) is the width of the hump, and vc is the vehicle velocity. This excitation assumed that the vehicle model travels with a constant velocity of 23 km⁄h (6.38 m⁄s). The second types of road is step profile. The step height was 0.02 m applied instantaneously.
III. NUMERICAL SIMULATIONS MODEL
The seat-driver model was simulated using MATLAB software ver. 7.8 (R2009a) dynamic system simulation software, Simulink. A Simulink model was constructed by using the differential equations derived by applying Newton‟s law to the seat-driver model.
IV. GENETIC ALGORITHMS
Genetic algorithms (GAs) are stochastic techniques whose search methods model a natural evolution. These algorithms are based on Darwin‟s theory of „survival of fittest‟ [17, 18]. This means that problems are solved by an evolutionary process which is used to optimize the solutions to a given problem (the solution is not always the best). GA uses a probabilistic process to find approximate solutions to difficult to solve problems through application of the principles of evolutionary biology to computer science.
A. Genetic Algorithm Techniques
Genetic algorithms are typically implemented as a computer simulation in which a population of abstract representations (called chromosomes) of candidate solutions to an optimization problem (called individuals) taken from a search space evolves toward better solutions. The evolution starts from a population of completely random individuals and takes place in several generations. In each generation, multiple individuals are stochastically selected from the current population, modified (mutated or recombined) to form a new population, which becomes the current population in the next iteration of the algorithm. A measure of how good a solution is to solve the problem, called fitness function, is also necessary in the evolutionary process. A simple genetic algorithm that yields good results in any practical problem is composed of following three operations [14]:
Reproduction: A process in which individual strings are copied according to their objective function values.
Crossover: Here, pairs of strings are picked at random from the existing population to be subjected to crossover.
Mutation: After crossover, strings are subjected to
mutation. Mutation is applied to each child individually. The flow chart of the optimization procedure used in the research calculations is shown in Fig. 2.
1. the objective function or the performance index which is required to be minimized.
2. the bounds of the design variables which are limited to lower and upper bounds, (LB, UB). Within these limits the genetic algorithm choose the values of the design variables during the simulation.
3. the number of individuals which are produced in each generation.
4. the maximum number of generation. 5. the generation gap.
6. the precision of the binary representation. 7. the accuracy.
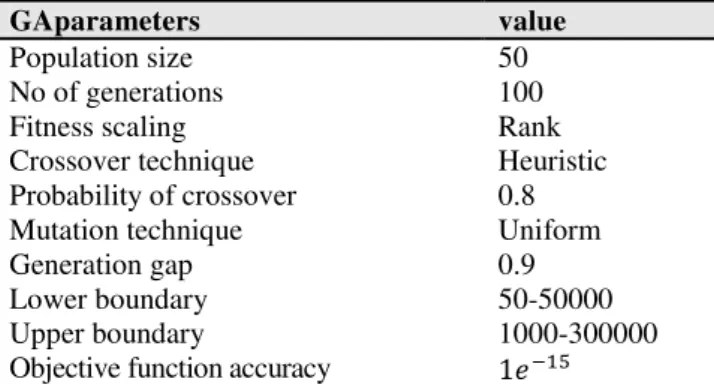
The program will terminate when the accuracy reach to the setting value or when the maximum generation is reached. Table 2 shows the GA parameters and its selected values.
Fig.2 Flowchart of the optimization procedure. Table 2 Genetic algorithm parameters.
GAparameters value
Population size No of generations Fitness scaling Crossover technique Probability of crossover Mutation technique Generation gap Lower boundary Upper boundary
Objective function accuracy
50 100 Rank Heuristic 0.8 Uniform 0.9 50-50000 1000-300000
B. Objective Function
Head acceleration, force transmitted to the upper body, and the seat suspension working space (seat suspension deflection) are the most important factors affecting driver‟s health and comfort [19]. Therefore, the objective function of this study combines head acceleration , seat mass acceleration ( , and the seat suspension working space (ssws) to achieve the best comfort of the driver.
This study used the classical weighted sum approaches to solve a multi-objective optimization problem as follows [20]:
where w1, w2 and w3 are weighting factors to emphasize the relative importance of the terms. Table 3, shows weighting factors used in step and sinusoidal excitation inputs.
Table 3 Weighting factors used in step and sinusoidal excitation inputs.
Weight w1 w2 W3
Step Input 1.5 1.0 1.1
Sinusoidal input 1.5 1.0 1.1
V. RESULTS AND DISCUSSION
The GA method increases the probability of finding the global optimum solution and avoids convergence to a local minimum which is a drawback of gradient-based methods. Computer simulations are performed for three cases of different weighted factors in order to obtain the required dynamic performance of the proposed design of the seat. The results are generated when excited by an artificial generated step and sinusoidal inputs, respectively.
The optimal seat parameters for the present model were determined and the results with GA method were compared with passive model. The design results from the passive and optimal suspensions are tabulated in table 4. Simulation is performed using seat-driver data illustrated in table 1, for the defined seat excitation inputs.
Table 4The design results from the GA program for passive and optimal suspension.
Seat suspension setting
Currently used
GA optimization Sinusoidal Step
Kse 19600 5014.1 42934
Cse 2156 55.5 50
Figs.3 and 4 present the history of the some selected response components of the human-body model for sinusoidal input excitation. In particular the results in Fig.3, depict the acceleration histories obtained at the seven human components, head and neck, back, upper torso, thorax, diaphragm, abdomen and thighs and pelvis, respectively. The maximum amplitude of acceleration determined in all seven human components is increased originally and then decreased. Whereas, Fig.4 shows the displacement histories obtained at the seven human components.
On the other hand, Figs. 5 and 6 present the same part of the history determined response components for the human-body model, in case of step input excitation. In addition, Fig. 7 presents seat suspension working space obtained at sinusoidal input excitation and step input excitation. Therefore, in order to verify the validity of the results, the GA were compared to those obtained by passive suspension for head, chest, lumber and pelvic of the human body using two different excitation input: sinusoidal and step inputs.
(a) (b) (c)
(d) (e) (f )
(g)
Fig.3 Acceleration histories obtained at (a) Head, (b) Back, (c) Torso, (d) Thorax, (e) Diaphragm, (f) Abdomen and (g) Pelvic using a sinusoidal input excitation.
(a) (b) (c)
(d) (e) (f )
(g)
Fig.4 Displacement histories obtained at (a) Head, (b) Back, (c) Torso, (d) Thorax, (e) Diaphragm, (f) Abdomen, (g) Pelvic and (h) Seat suspension working space
using a sinusoidal input excitation. 0 0.2 0.4 0.6 0.8 1
-10 -5 0 5 10
Time (sec)
Ac
c
elerat
ion
(m
/s
2)
Head Acceleration
Passive Genetic
0 0.2 0.4 0.6 0.8 1
-10 -5 0 5 10
Time (sec)
Ac
c
elerat
ion
(m
/s
2)
Back Acceleration
Passive Genetic
0 0.2 0.4 0.6 0.8 1 -10
-5 0 5 10
Time (sec)
Ac
c
elerat
ion
(m
/s
2)
Torso Acceleration
Passive Genetic
0 0.2 0.4 0.6 0.8 1
-10 -5 0 5 10
Time (sec)
Ac
c
elerat
ion
(m
/s
2)
Thorax Acceleration
Passive Genetic
0 0.2 0.4 0.6 0.8 1
-10 -5 0 5 10
Time (sec)
Ac
c
elerat
ion
(m
/s
2)
Diaphragm Acceleration
Passive Genetic
0 0.2 0.4 0.6 0.8 1
-10 -5 0 5 10
Time (sec)
Ac
c
elerat
ion
(m
/s
2)
Abdomen Acceleration
Passive Genetic
0 0.2 0.4 0.6 0.8 1
-10 -5 0 5 10
Time (sec)
Ac
c
elerat
ion
(m
/s
2)
Pelvis Acceleration
Passive Genetic
0 0.2 0.4 0.6 0.8 1
-0.04 -0.02 0 0.02 0.04
Time (sec)
D
is
plac
em
ent
(m
)
Head displacement
Passive Genetic Input Profile
0 0.2 0.4 0.6 0.8 1
-0.04 -0.02 0 0.02 0.04
Time (sec)
D
is
plac
em
ent
(m
)
Back displacement
Passive Genetic input Profile
0 0.2 0.4 0.6 0.8 1
-0.04 -0.02 0 0.02 0.04
Time (sec)
D
is
plac
em
ent
(m
)
Torso displacement
Passive Genetic input Profile
0 0.2 0.4 0.6 0.8 1
-0.04 -0.02 0 0.02 0.04
Time (sec)
D
is
plac
em
ent
(m
)
Thorax displacement
Passive Genetic input Profile
0 0.2 0.4 0.6 0.8 1
-0.04 -0.02 0 0.02 0.04
Time (sec)
D
is
plac
em
ent
(m
)
Diaphragm displacement Passive Genetic input Profile
0 0.2 0.4 0.6 0.8 1
-0.04 -0.02 0 0.02 0.04
Time (sec)
D
is
plac
em
ent
(m
)
Abdomen displacement
Passive Genetic input Profile
0 0.2 0.4 0.6 0.8 1
-0.04 -0.02 0 0.02 0.04
Time (sec)
D
is
plac
em
ent
(m
)
Pelvis displacement
(a) (b) (c)
(d) (e) (f )
(g)
Fig.5 Acceleration histories obtained at (a) Head, (b) Back, (c) Torso, (d) Thorax, (e) Diaphragm, (f) Abdomen and (g) Pelvic using a step input excitation.
(a) (b) (c)
(d) (e) (f )
(g)
Fig.6 Displacement histories obtained at (a) Head, (b) Back, (c) Torso, (d) Thorax, (e) Diaphragm, (f) Abdomen, (g) Pelvic and (h) Seat suspension working space
using a step input excitation. 0 0.2 0.4 0.6 0.8 1
-40 -20 0 20 40
Time (sec)
Ac
c
elerat
ion
(m
/s
2)
Head Acceleration
Passive Genetic
0 0.2 0.4 0.6 0.8 1
-40 -20 0 20 40
Time (sec)
Ac
c
elerat
ion
(m
/s
2)
Back Acceleration
Passive Genetic
0 0.2 0.4 0.6 0.8 1
-20 -10 0 10 20
Time (sec)
Ac
c
elerat
ion
(m
/s
2)
Torso Acceleration
Passive Genetic
0 0.2 0.4 0.6 0.8 1
-20 -10 0 10 20
Time (sec)
Ac
c
elerat
ion
(m
/s
2)
Thorax Acceleration
Passive Genetic
0 0.2 0.4 0.6 0.8 1
-20 -10 0 10 20
Time (sec)
Ac
c
elerat
ion
(m
/s
2)
Diaphragm Acceleration
Passive Genetic
0 0.2 0.4 0.6 0.8 1
-20 -10 0 10 20
Time (sec)
Ac
c
elerat
ion
(m
/s
2)
Abdomen Acceleration
Passive Genetic
0 0.2 0.4 0.6 0.8 1
-100 -50 0 50 100
Time (sec)
Ac
c
elerat
ion
(m
/s
2)
Pelvis Acceleration
Passive Genetic
0 0.2 0.4 0.6 0.8 1
-0.01 0 0.01 0.02
Time (sec)
D
is
plac
em
ent
(m
)
Head displacement
Passive Genetic Input Profile
0 0.2 0.4 0.6 0.8 1
-0.01 0 0.01 0.02
Time (sec)
D
is
plac
em
ent
(m
)
Back displacement
Passive Genetic Input Profile
0 0.2 0.4 0.6 0.8 1
-0.01 0 0.01 0.02
Time (sec)
D
is
plac
em
ent
(m
)
Torso displacement
Passive Genetic Input Profile
0 0.2 0.4 0.6 0.8 1
-0.01 0 0.01 0.02
Time (sec)
D
is
plac
em
ent
(m
)
Thorax displacement
Passive Genetic Input Profile
0 0.2 0.4 0.6 0.8 1
-0.01 0 0.01 0.02
Time (sec)
D
is
plac
em
ent
(m
)
Diaphragm displacement
Passive Genetic Input Profile
0 0.2 0.4 0.6 0.8 1
-0.01 0 0.01 0.02
Time (sec)
D
is
plac
em
ent
(m
)
Abdomen displacement
Passive Genetic Input Profile
0 0.2 0.4 0.6 0.8 1
-0.01 0 0.01 0.02
Time (sec)
D
is
plac
em
ent
(m
)
Pelvis displacement
(a) (b)
Fig.7 Seat suspension working space obtained at (a) sinusoidal and (b) step
input excitation.
able 6 Comparison of passive and results for driver‟s body parts.
Red.% Step
Red.% Sinusoidal
Driver‟s Body overshPeak
oot Max. overshoot Peak
oversh oot Max. overshoot
GA Passive GA
Passive
70.86 6.2190 21.3459 78.23
1.9141 8.7921 Head
Ac
ce
lera
ti
on
(m
/s
2 )
74.21 6.0797 23.5776 77.74
2.1174 9.5130 Back
52.32 6.0749 12.7415 78.22
2.0662 9.4904 Torso
50.08 5.7464 11.5122 78.21
1.9775 9.0757 Thorax
50.00 5.4393 10.8672 78.18
1.8685 8.5633 Diaphragm
53.68 5.1767 11.1764 78.17
1.7533 8.0331 Abdomen
91.03 7.4989 83.6045 78.20
1.7729 8.1329 Pelvis
31.50 0.0124 0.0181 51.51
0.0096 0.0198 Head
Disp
lac
em
en
t
(m
)
31.28 0.0123 0.0179 51.53
0.0095 0.0196 Back
31.05 0.0131 0.0190 51.69
0.0100 0.0207 Torso
31.35 0.0127 0.0185 51.48
0.0098 0.0202 Thorax
30.89 0.0123 0.0178 51.02
0.0096 0.0196 Diaphragm
30.99 0.0118 0.0171 50.79
0.0093 0.0189 Abdomen
31.81 0.0120 0.0176 52.12
0.0090 0.0188 Pelvis
44.64 0.0155 0.0280 78.37
0.0056 0.0259 SSWS
VI. CONCLUSIONS
A 7-DOF passive and optimal seat driver suspension systems are compared in time domain analyses subjected to sinusoidal and step inputexcitation. The optimum design parameters of the suspension systems obtained are kse=5014.1 N/m and cse=55.5 N.s/m in case of sinusoidal input and
kse=42934 N/mandcse=50N.s/m in case of step input, respectively. The Head acceleration was reduced by more than 70 % and for head displacement was reduced by more than 31.5%. The reduction of peak over shoot of seat suspension working space (ssws) about 78 % in case of sinusoidal input and 44 % in case of step input.
It is obvious from the results and plot indicate that optimal seat suspension system are less oscillatory, and have lower values of maximum over shoots , which is directly related to driver fatigue, discomfort, and safety. Therefore, optimal seat suspension system has better potential to improve driver comfort.
Step excitation input causes more dangerous on whole body parts (head and neck, back, upper torso, thorax, diaphragm, abdomen and thighs and pelvis) than those produced by sinusoidal excitation input.
REFERENCES
[1] B. Bazrgari, A. Shirazi-Adl, and M. Parnianpour, “Transient analysis
of trunk response in sudden release loading using kinematics-driven
finite element model”, Clinical Biomechanics vol. 24,2009, pp. 341–
347.
[2] Z. Zong, H. P. Lee, and C. Lu., “A three-dimensional human head
finite element model and power flow in a human head subject to
impact loading”, Journal of Biomechanics, vol. 39, 2006, pp.
284-292.
[3] R. R. Coermann, “The mechanical impedance of the human body in
sitting and standing position at low frequencies. Human Factors”,
October 1962, 227–253.
[4] C. W. Suggs, C. F. Abrams, and L. F. Stikeleather, “Application of a
damped spring-mass human vibration simulator in vibration testing of
vehicle seats. Ergonomics, vol. 12,1969, pp. 79–90.
[5] V. K. Tewari, and N. Prasad, “Three-DOF modelling of tractor
seat-operator system”, Journal of Terramechanics, vol. 36, 1999, pp.
207-219.
[6] P. E. Boileau, and S. Rakheja, “Whole-body vertical biodynamic
response characteristics of the seated vehicle driver: Measurement
and model development”, International Journal of Industrial
Ergonomics, vol. 22, 1998, pp. 449-472.
[7] Z. Zong, and K. Y. Lam, “Biodynamic response of shipboard sitting
subject to ship shock motion”, Journal of Biomechanics, vol. 35,
2002, pp. 35–43.
[8] X. X. Liu, J. Shi, and G. H. Li, “Biodynamic response and injury
estimation of ship personnel to ship shock motion induced by
underwater explosion”, Proceeding of 69th Shock and Vibration
Symposium, vol. 18, 1998, pp. 1–18.
[9] R. Muksian, and C. D. Nash, “A model for the response of seated
humans to sinusoidal displacements of the seat”. J Biomech, Vol. 7,
1974, pp. 209-15.
[10] M. K. Patil, M. S. Palanichamy, and N. G. Dhanjoo, “Minimization of
the vertical vibrations sustained by a tractor operator, by provision of
a standard-type tractor seat suspension”, ANNALS of biomedical
Engineering , vol. 6, 1978, pp. 138–153.
[11] C. C. Liang, and C. F. Chiang, “A study on biodynamic models of
seated human subjects exposed to vertical vibration”, International
Journal of Industrial Ergonomics, vol. 36, 2006, pp. 869–890.
[12] A. E. Baumal, J. J. McPhee, and P. H. Calamai, “Application of
genetic algorithms to the design optimization of an active vehicle
suspension system”, Computer Methods Appl. Mech. Engrg., vol.
163, 1998, pp. 87-94.
[13] R. Alkhatib, G. N. Jazar, and M. F. Golnaraghi, “Optimal design of
passive linear suspension using genetic algorithm”, Journal of Sound
and Vibration, vol. 275, 2004, pp. 665–691.
[14] M. K.Hada, A. Menon, and S. Y. Bhave, “Optimisation of an Active
Suspension Force Controller Using Genetic Algorithm for Random
Input”, Defense Science Journal, vol. 57, No. 5, 2007, pp. 691-706,
September.
[15] M. K. Patil, and M. S. Palanichamy, “A mathematical model of
tractor–occupant system with a new seat suspension for minimization
of vibration response”, Applied Mathematical Modeling, vol.
12,1988, pp. 63-71.
[16] K. Masaaki, and S. Taro, “Active suspension of truck seat”, shock and
vibration, vol. 5,1998, pp. 35-41.
[17] M. S. Kumar, “Genetic Algorithm Based Proportional Derivative
Controller For The Development of Active Suspension System”,
Information Technology and Control, vol. 36, No. 1, 2007, pp. 58-67.
[18] L. Sun, X. Cai, and J. Yang, “Genetic Algorithm-Based Optimum
Vehicle Suspension Design Using Minimum Dynamic Pavement
Load as a Design Criterion”, Journal of Sound and Vibration, vol.
301, 2007, pp. 18–27.
[19] Ö. ündoğdu, “Optimal seat and suspension design for a quarter car
with driver model using genetic algorithms”, International Journal of
Industrial Ergonomics, vol. 37 ,2007, pp. 327–332.
[20] A. Konak, D. W. Coit, and A. E. Smith, “Multi-objective optimization
using genetic algorithms: A tutorial”, Reliability Engineering and
System Safety , vol. 91, 2006, pp. 992–1007.
0 0.2 0.4 0.6 0.8 1
-0.04 -0.02 0 0.02 0.04
Time (sec)
D
is
plac
em
ent
(m
)
Seat suspension working space
Passive Genetic
0 0.2 0.4 0.6 0.8 1
-0.04 -0.02 0 0.02 0.04
Time (sec)
D
is
plac
em
ent
(m
)
Seat suspension working space