Submitted19 October 2015 Accepted 13 January 2016 Published1 February 2016
Corresponding author Charlotte De Busschere,
charlotte.debusschere@gmail.com
Academic editor Joanna Elson
Additional Information and Declarations can be found on page 15
DOI10.7717/peerj.1659
Copyright 2016 De Busschere et al.
Distributed under
Creative Commons CC-BY 4.0
OPEN ACCESS
Unequal contribution of native South
African phylogeographic lineages to
the invasion of the African clawed frog,
Xenopus laevis, in Europe
Charlotte De Busschere1, Julien Courant2, Anthony Herrel2, Rui Rebelo3, Dennis Rödder4, G. John Measey5and Thierry Backeljau1,6
1Operational Direction Taxonomy and Phylogeny, Royal Belgian Institute of Natural Sciences, Brussels,
Belgium
2UMR7179, Département d’Ecologie et de Gestion de la Biodiversité, Centre national de la recherche
scientifique, Paris, France
3Departamento de Biologia Animal/ Centre for Ecology, Evolution and Environmental Changes,
Faculdade de Ciências da Universidade de Lisboa, Lisboa, Portugal
4Herpetology Department, Zoologisches Forschungsmuseum Alexander Koenig, Bonn, Germany 5Centre of Invasive Biology, Department of Botany and Zoology, University of Stellenbosch,
Stellenbosch, South-Africa
6Evolutionary Ecology Group, University of Antwerp, Antwerp, Belgium
ABSTRACT
Due to both deliberate and accidental introductions, invasive African Clawed Frog (Xenopus laevis) populations have become established worldwide. In this study, we investigate the geographic origins of invasive X. laevis populations in France and Portugal using the phylogeographic structure ofX. laevisin its native South African range. In total, 80 individuals from the whole area known to be invaded in France and Portugal were analysed for two mitochondrial and three nuclear genes, allowing a comparison with 185 specimens from the native range. Our results show that native phylogeographic lineages have contributed differently to invasive EuropeanX. laevis
populations. In Portugal, genetic and historical data suggest a single colonization event involving a small number of individuals from the south-western Cape region in South Africa. In contrast, French invasiveX. laevisencompass two distinct native phylogeographic lineages, i.e., one from the south-western Cape region and one from the northern regions of South Africa. The FrenchX. laevispopulation is the first example of aX. laevisinvasion involving multiple lineages. Moreover, the lack of population structure based on nuclear DNA suggests a potential role for admixture within the invasive French population.
SubjectsBiodiversity, Biogeography, Ecology, Genetics
Keywords Phylogeography, Population genetics, Invasion history, Invasive species, Xenopus laevis
INTRODUCTION
Reconstructing the invasion history and dynamics of invasive species is crucial for
(Sakai et al., 2001;Lee & Gelembiuk, 2008;Prentis et al., 2009). Moreover, exploring patterns of population genetic variation and evolutionary processes may be key to infer the invasive potential of invasive alien species (Sakai et al., 2001;Lee & Gelembiuk, 2008). In this study, we focus on the African clawed frog,Xenopus laevis(Daudin, 1802), which is indigenous to Southern Africa, including South Africa up to Malawi (i.e.,X. laevis
sensu strictoFurman et al., 2015). Due to deliberate and accidental introductions from laboratories and pet suppliers, invasiveX. laevispopulations have become established in Asia, Europe, North America and South America (Tinsley & McCoid, 1996;Lobos & Measey, 2002;Crayon, 2005;Fouquet & Measey, 2006;Faraone et al., 2008;Measey et al., 2012;Peralta-García, Valdez-Villavicencio & Galina-Tessaro, 2014). Invasive
X. laevispopulations have negative impacts on local biota by reducing the occurrence of reproduction (Lillo, Faraone & Lo Valvo, 2010) and increasing predation pressures on native prey organisms (Lafferty & Page, 1997;Faraone et al., 2008;Measey et al., 2015).Lobos & Measey (2002)also suggested thatX. laevismight have indirect impacts on the aquatic system such as increasing water turbidity and nutrient release. Finally, the spread ofBatrachochytrium dendrobatis, which causes the amphibian skin disease chytridiomycosis and negatively impacts amphibian populations (Berger et al., 1998; Lips et al., 2006;Skerratt et al., 2007;Voyles et al., 2009;Crawford, Lips & Bermingham, 2010), has been linked to invasive amphibian species such asX. laeviswhich are often asymptotic carriers (Weldon et al., 2004); however, this link has yet to be proven.Measey et al. (2012)suggested that the global potential invasiveness ofX. laevishas been severely underestimated and that it is likely thatX. laeviswill expand its present colonized area. For example in Europe, introducedX. laevispopulations are currently established in France (Fouquet, 2001), Portugal (Rebelo et al., 2010) and Italy (Sicily) (Lillo et al., 2005), though the predicted suitable climate space forX. laeviscovers over one million km2 making this a species of European concern (Measey et al., 2012).
Within its native range,X. laevishas a wide geographical distribution in which it occu-pies a variety of natural, as well as manmade waterbodies (Measey, 2004). NativeX. laevis
Beaufort West (SA4). Laingsburg (SA3) and Beaufort West (SA4) are both located within the lowland part of the Great Karoo (700–800 m above sea level) which is separated from the south-western Cape (SA1–SA2) by the Cape Fold Mountains (Du Preez et al., 2009;Furman et al., 2015) and from the north by the Great Escarpment (Fig. 1). Another admixture zone was suggested between Niewoudtville (SA7) and the south-western Cape populations (SA1) around Vredendal (Measey & Channing, 2003). In its native range
X. laevisalso displays substantial phenotypic population differentiation.Du Preez et al. (2009), for example, showed that maleX. laevisfrom south of the Cape Fold Mountains were longer and heavier than males from north of the Cape Fold Mountains.
Given its wide native geographical and ecological ranges and high population genetic diversity, it is important to identify the source areas and population(s) of invasiveX. laevis
populations if one aims to understand the invasion history and invasive potential of this species (Sakai et al., 2001;Lee, 2002;Dlugosch & Parker, 2008;D’Amen, Zimmermann & Pearman, 2013). The origin of invasiveX. laevispopulations in Sicily and Chile has already been explored using DNA markers (Lillo et al., 2013;Lobos et al., 2014). Similarly, the origin of specimens from animal suppliers i.e.,Xenopus-1 Inc. (Dexter, MI, USA) andXenopusExpress (Brooksville, FL, USA), has been assessed (Du Preez et al., 2009). These studies support the assumption that export ofX. laevisspecimens for laboratory use mainly stemmed from the south-western Cape region in South Africa (Tinsley & McCoid, 1996;Weldon, De Villiers & Du Preez, 2007), although other source areas cannot be excluded, especially for older introduced stocks (Du Preez et al., 2009; L Van Sittert & J Measey, 2015, unpublished data).
The present paper aims to unravel to which extent single or multiple native phylogeographic lineages have contributed to the invasive populations in France and Portugal by comparing mtDNA and nDNA data sampled across the invaded, as well as the native range. In France, it is assumed thatX. laeviswas introduced at Bouillé-Saint-Paul (Deux Sèvres) from a nearby breeding facility where X. laeviswas bred from the 1950s until 1996 (Fouquet, 2001;Fouquet & Measey, 2006). From that breeding facilityX. laevis
may have escaped repeatedly and was probably released when the facility was definitively closed in 1996 (Measey et al., 2012). Currently, FrenchX. laevispopulations occupy an area of approximately 200 km2near the city of Saumur (Maine-et-Loire) (Fig. 1). The introduction ofX. laevisin Portugal is assumed to be accidental, caused in 1979 by the inundation of a basement of a research institute at Oeiras along river Laje, about 20 km west of Lisbon (Rebelo et al., 2010;Measey et al., 2012). Nowadays, several populations are found in two tributaries of river Tagus, i.e., river Laje and river Barcarena (Fig. 1) (Rebelo et al., 2010).
METHODS
Taxon samplingIn total 80 individuals from 32 localities, covering the known area invaded by X. laevis
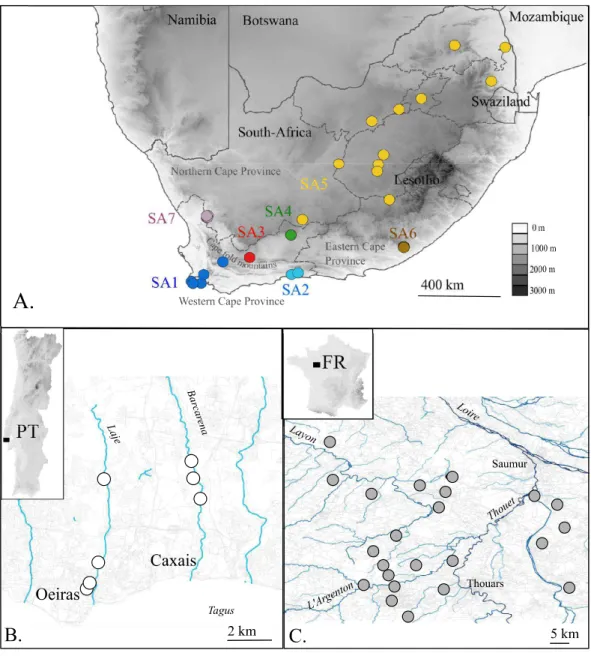
Figure 1 Map of the native (A. South Africa) and invadedX. laevislocalities (B. Portugal, C. France) surveyed in this study. Abbreviations and colours of sampling localities (circles) refer to geographical regions that are mentioned in methods (see ‘Taxon sampling’). More detailed locality information is pro-vided in Online Resource 1. National and provincial borders of South African Provinces are visualized by solid and dashed lines respectively (A). Rivers and roads are represented by blue and grey lines respectively (B) and (C). Names of main rivers (italic) and towns are shown (B) and (C).
& J Measey, 2015, unpublished data). These new data were supplemented by data on 164 South African specimens available on GenBank. One individual ofXenopus gilliRose & Hewitt, 1927was sampled near Kleinmond (South Africa). Based onFurman et al. (2015), sampling localities in South Africa were grouped into seven geographical regions: SA1: south-western Cape, south-west of the Cape Fold Mountains up to De Doorns; SA2: Cape, Hoekwil & Tsitsikamma region; SA3: Cape, Laingsburg; SA4: Cape, Beaufort West; SA5: northern South Africa (Kimberley, Victoria West, Potchefstroom); SA6: Cape, Rooikrantz Dam; SA7: Nieuwoudtville (Fig. 1). All specimen data with full locality information are provided in Online Resource 1. Animals from the Portuguese invasive population were captured under the permit no 570/2014/CAPT from Instituto da Conservação da Natureza e das Florestas, in the scope of the ‘‘Plano de erradicação deXenopus laevisnas ribeiras do Concelho de Oeiras’’. Animals from the native South-African populations were sampled under the permits 0056-AAA007-00092 (CapeNature, SA1) and CRO 109/13CR (Eastern Cape, SA6) provided by the Department of Economic Development, Environmental Affairs and Tourism and with ethics approval from the Research Ethics Committee: Animal Care and Use (protocol number: SU-ACUD14-00028).
DNA amplification and sequencing
Invasive specimens were euthanized with a lethal injection of sodium pentobarbital. Muscle tissue was dissected from invasive specimens, while native wild caught specimens were toe-clipped to obtain tissue samples. Genomic DNA was extracted by means of a NucleoSpinR tissue kit (Macherey-Nagel, Düren, Germany) according to the manufacturer’s protocol. Five genomic DNA fragments (circa (ca.) 2,040 bp) representing two mitochondrial and three nuclear gene fragments were amplified using PCR. These genes were selected in order to enable comparison with previously published work on native (Measey & Channing, 2003;Du Preez et al., 2009;Bewick, Anderson & Evans, 2011;Furman et al., 2015) and invasiveX. laevisspecimens (Lillo et al., 2013;Lobos et al., 2014). Fragments of the mitochondrial cytochrome b gene (Cytb; ca. 280 bp) and 16S ribosomal DNA (16S; ca. 800 bp) were amplified and sequenced with the primer pairs Cytb I /Cytb II and 16Sc-L/16Sd-H (Kessing et al., 1989;Evans et al., 2003). Fragments of the nuclear protein coding genes arginine methyltransferase 6 (Prmt6; ca. 666 bp), androgen receptor isoform
α(AR; ca. 402 bp) and microtubule associated serine/threonine kinase-like protein (Mastl;
ca. 539 bp) were amplified and sequenced with the primer pairs Exon4_for1/Exon4_rev2, XLAR_for_40/XLAR_rev_431 and Exon13_fora/Exon13_reva (Bewick, Anderson & Evans, 2011). The nuclear primer pairs are assumed to be paralog-specific, hence only amplifying one pair of alleles (see Bewick, Anderson & Evans, 2011). PCR amplifications were run with the conditions reported in Online Resource 3. PCR products were purified with FastAP TM thermosensitive alkaline phosphatase in combination with exonuclease I and subsequently sequenced in both directions. Nucleotide sequences were assembled and edited in CodonCode Aligner (CodonCode Corporation, Dedham, MA, USA). They were aligned together with corresponding well-documented sequences of South AfricanX. laevis
Lobos et al. (2014)in Chilean (CL) invasiveX. laevispopulations were included in the Cytb alignment. Cytb and 16S gene fragments obtained byLillo et al. (2013)were not included in the current alignments as they only partially overlapped due to the use of different primers. Nuclear sequences were converted into haplotypes using the PHASE algorithm (Stephens, Smith & Donnelly, 2001;Stephens & Donnelly, 2003) implemented in DnaSP v. 5 (Librado & Rozas, 2009). All new sequence data were deposited in Genbank (accession numbers in Online Resource 1:https://figshare.com/s/44b71de473fc11e5829d06ec4b8d1f61).
Genetic diversity
The following indices of genetic diversity were estimated using DnaSP v. 5 (Librado & Rozas, 2009): numbers of different haplotypes (h), the number of segregating sites (S), nucleotide diversity (π, i.e., the average number of nucleotide differences per site between
two sequences) and haplotype/allelic diversity (Hd, i.e., the probability that two haplotypes drawn uniformly at random from a population are not the same).
mtDNA analysis
Phylogenetic relationships among invasive and nativeX. laevismtDNA sequences were reconstructed with Bayesian inference (BI) and Maximum Parsimony (MP). Three alignments were created: two separate Cytb and 16S alignments including only unique alleles and a concatenated Cytb-16S alignment including only unique haplotypes. In all analyses,X. gilliwas used as outgroup. Parsimony informative sites were calculated with DnaSP v. 5 (Librado & Rozas, 2009). BI analyses were performed using MrBayes v. 3.2.4 (Ronquist & Huelsenbeck, 2003). Cytb, 16S and Cytb-16S alignments were analysed under a general time reversible (GTR) model with all model parameters estimated from the data and a proportion of invariant sites (+I) as selected by jModeltest v. 2.1.7 (Posada, 2008). BI analyses were run with two different Metropolis-coupled Markov chains for 10 million generations with sampling every 1,000th generation. The average standard deviations of split frequencies, the potential scale reduction factors and the plots of likelihood versus generation were evaluated to ensure convergence based on the log file and using Tracer v1.6 (Rambaut et al., 2013). A total of 25% of the trees were discarded as burn-in and posterior probabilities were calculated for each split from the remaining set of trees. MP trees were estimated with a neighbour joining tree as starting tree using the Phangorn package (Schliep, 2011) in R 3.1.1 (R Development Core Team, 2014). A set of most-parsimonious trees was generated using the parsimony ratchet (Nixon, 1999) with nearest neighbour interchange rearrangement, 10,000 ratchet iterations and up to maximum 10 rounds. Parsimony bootstrap values were obtained with 1,000 bootstrap replicates using the bootstrap.phyDat function in R 3.1.1. All topologies were visualized and edited in respectively Figtree v. 1.4.2 (Rambaut, 2014) and TreeGraph2 v. 2.4.0-456 beta (Stöver & Müller, 2010). Differentiation between native geographical areas and invaded regions was quantified using pairwiseFst
Autosomal analysis
The minimum number of recombination events within alleles were estimated in DnaSP v.5 (Hudson & Kaplan, 1985;Librado & Rozas, 2009). Given putative recombination, median-joining networks (MJN) (Bandelt, Forster & Rohl, 1999) were constructed in PopART v.1.7.2 (PopART, 2015) for each nuclear locus separately to illustrate the mutational differences between alleles and their distribution among invasive and native populations (Mardulyn, 2012). Pairwise Fst values were computed based on the allele frequencies to show to what extent alleles are differently sorted among populations (e.g., where the same alleles are found in different populations but with different frequencies). Native populations were defined based upon the geographical regions mentioned in ‘Taxon sampling.’ Individuals from France and Portugal respectively were treated as two populations. Pairwise Fst values were computed from the allele frequencies with 999 permutations to generate the probability that a random value would be greater than or equal to the observed data using GenAlEx v. 6.5 (Peakall & Smouse, 2012). Individuals with missing data for more than one gene were excluded from the analysis. In order to visualize population differentiation, the pairwiseFst matrix was subsequently used as a distance matrix for a principal coordinates analysis (PCoA) in GenAlEx v.6.5.
RESULTS
mtDNAMitochondrial alignments were constructed for Cytb and 16S involving 101 and 181 individuals respectively. The concatenated Cytb-16S alignment involved 64 individuals. None of the alignments showed gaps. The Cytb alignment involved16 unique alleles of X. laevis with 42 variable positions of which 34 were parsimony informative. No Cytb sequences were obtained of specimens from the regions SA2, SA3 and SA4. In contrast, all geographic regions were represented in the 16S alignment, which involved 15 alleles ofX. laeviswith 25 variable positions of which 17 were parsimony informative. The concatenated Cytb-16S alignment involved seven uniqueX. laevishaplotypes with 43 variable positions of which 39 were parsimony informative (Online Resource 2:
https://figshare.com/s/44b71de473fc11e5829d06ec4b8d1f61). The concatenated alignment
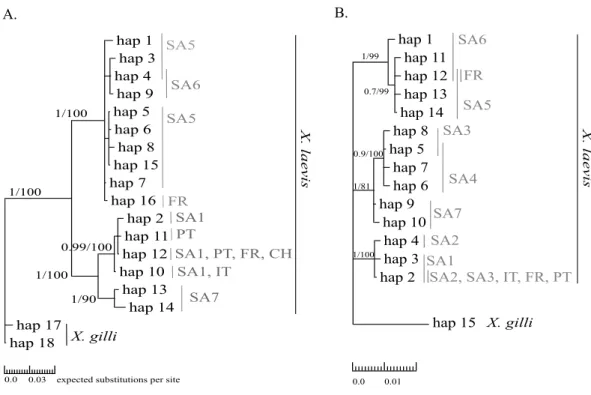
Figure 2 MP and BI inference based on Cytb (A) and 16S alignments (B).Bayesian consensus trees are visualized with Posterior BI bootstrap (B>0.70) and Parsimony bootstrap values. Parsimony scores (i.e., tree length) of Cytb MP tree and 16S MP tree were 83 and 47 respectively. Geographical regions where al-leles have been observed are indicated in grey (abbreviations seeFig. 1and ‘Methods’).
nDNA
Table 1 Summary of diversity statistics for all loci and each population.Statistics describing the num-ber of nucleotides sequenced (nt), number of individuals (ind), number of different haplotypes (h), num-ber of segregating sites (S), nucleotide diversity (π) and haplotype diversity (Hd).
Gene Country Pop nt ind h S π Hd
Cytb France FR 282 42 2 26 0.0233 0.251
Portugal PT 282 18 2 1 0.00105 0.294
South Africa SA1 282 12 3 3 0.00265 0.53
SA5 282 13 8 10 0.01099 0.91
SA6 282 6 2 1 0.00119 0.333
SA7 282 4 2 6 0.01429 0.667
16S France FR 544 56 2 13 0.00598 0.249
Portugal PT 544 16 1 0 0 0
South Africa SA1 544 23 2 1 0.00055 0.3
SA2 544 14 2 1 0.00026 0.143
SA3 544 9 3 11 0.00756 0.556
SA4 544 12 3 2 0.00106 0.53
SA5 544 13 3 2 0.0008 0.41
SA6 544 14 3 3 0.00079 0.275
SA7 544 22 2 1 0.00068 0.368
AR France FR 294 58 2 2 0.00338 0.495
Portugal PT 294 18 1 0 0 0
South Africa SA1 294 27 1 0 0 0
SA2 294 13 4 4 0.0044 0.582
SA3 294 18 2 2 0.00347 0.508
SA4 294 20 3 2 0.0014 0.229
SA5 294 25 3 2 0.00078 0.222
SA6 294 9 1 0 0 0
SA7 294 23 2 1 0.00373 0.043
Mastl France FR 525 53 13 6 0.00499 0.804
Portugal PT 525 18 2 5 0.00053 0.056
South Africa SA1 525 27 10 10 0.00609 0.73
SA2 525 12 9 8 0.00662 0.873
SA3 525 9 8 12 0.00712 0.895
SA4 525 13 8 9 0.00453 0.745
SA5 525 13 13 10 0.00452 0.938
SA6 525 9 13 6 0.00421 0.961
SA7 525 24 7 10 0.00264 0.543
Prmt6 France FR 396 51 16 8 0.00679 0.839
Portugal PT 396 18 4 3 0.00213 0.605
South Africa SA1 396 27 10 7 0.00375 0.829
SA2 396 13 9 6 0.00447 0.871
SA3 396 8 10 9 0.00787 0.942
SA4 396 12 7 7 0.00498 0.79
SA5 396 13 13 8 0.00679 0.911
SA6 396 10 15 13 0.00793 0.974
Figure 3 Result of Principal Co-ordinate analysis of nuclear genetic variation among native (SA1– SA7) and invasive French (FR) and Portuguese (PT)X. laevispopulations.PCoA of pairwiseFstvalues based on allele frequencies in three nuclear loci (n=180 individuals; Online Resource 5). Abbreviations refer to geographical regions (seeFig. 1).
native populations (SA1–SA3)(Fig. 3). Native populations SA5 and SA6 clustered together (Fig. 3).
South Africa
Haplotype diversity of nDNA and mtDNA within the native range ofX. laeviswas on average 0.60 ±0.20 and 0.45±0.18 respectively. Mitochondrial nucleotide diversity within the native regions was either rather low (π≤0.0016: SA1, SA2, SA4, SA6) or high
(π≥0.0059: SA3, SA5, SA7). As mentioned previously, mtDNA and nDNA variation was
geographically structured within South Africa (Fig. 2, Online Resource 4 and 5) (Furman et al., 2015). The monophyly of the sequences from northern South African regions (SA5) and the newly sampled sites at Rooikrantz Dam in the Eastern Cape (SA6) was consistently strongly supported by both Cytb and 16S (Fig. 2). Furthermore, the pairwise populationFst
values based on nDNA and on 16S separately were not significant between these two regions (Online Resource 4 and 5:https://figshare.com/s/44b71de473fc11e5829d06ec4b8d1f61).
Portugal
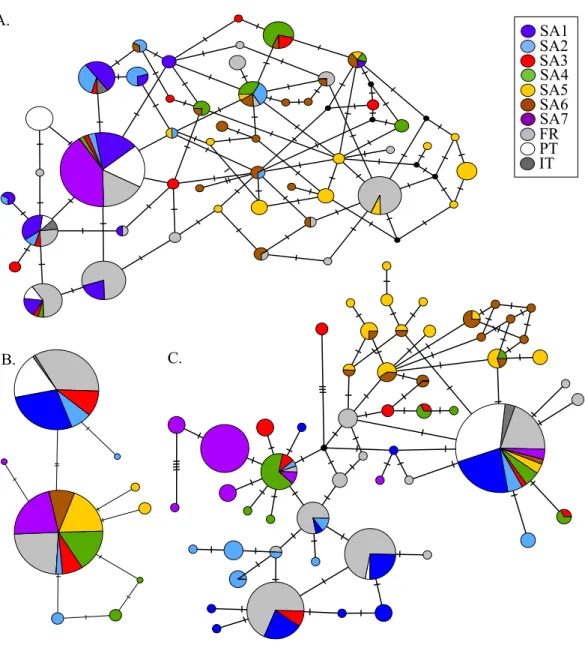
Figure 4 MJN of nuclear Prmt6 (A), AR (B) and Mastl (C) sequence data from native and invasiveX. laevispopulations.The sizes of the circles are proportional to allele frequencies. Colours refer to native geographic and invaded regions (see legend). Small black nodes represent unsampled alleles and numbers of mutations are marked by stripes on the connecting branches.
in native populations (π=0.0039 ± 0.0035). Similarly, the mean Portuguese haplotype
diversity (Hd=0.191 ± 0.261) across all loci was lower than in the native populations
(Hd=0.558± 0.323).
France
86% of specimens) was very similar to Cytb sequences in northern South Africa and Rooikrantz Dam populations (SA5–SA6) with on average four nucleotide differences (Fig. 2). Similarly, 86% of the French individuals had a 16S allele (i.e., hap_12) identical to a 16S sequence only found in northern South Africa and Rooikrantz Dam region (SA5–SA6)(Fig. 2). The concatenated Cytb-16S dataset comprised 38 French individuals which represented two different haplotypes. One haplotype was identical to a haplotype found in SA1 (i.e., hap_12_2) and the other haplotype was only found in France but highly similar to haplotypes found in SA6 (i.e., hap_16_12; Online Resource 2).
MtDNA haplotype diversity for each marker was low within the French population (Hd≤0.251,Table 1). PairwiseFst value based on 16S among SA6 and France was not
significant (Fst =0.049; Online Resource 4). Haplotype diversities for nDNA ranged from 0.50 for AR up to 0.80 for Mastl and Prmt6 (Table 1). France comprised 13 Mastl and 16 Prmt6 alleles with seven Mastl and 10 Prmt6 alleles being hitherto only found in France. nDNA allele frequencies in France were most similar to those in native populations from Laingsburg in the south-western Western Cape Province (SA3,Fig. 3, Online Resource 4:https://figshare.com/s/44b71de473fc11e5829d06ec4b8d1f61). No significant difference was observed when comparing nDNA allele frequencies among individuals representing the two different mitochondrial groups (Fst =0;p=0.421), however sample sizes were
low i.e., 49 and 8 individuals representing northern South Africa-Rooikrantz Dam mtDNA (SA5–SA6) and south-western Cape mtDNA (SA1–SA2) respectively. In comparison with the native geographic regions, mean nucleotide diversity across all loci in France was higher (π=0.009± 0.008 versusπ=0.0039 ±0.0035) while French haplotype diversity across
all loci was comparable (Hd=0.528 ±0.287 versusHd=0.558 ± 0.323).
Sicily
The Sicilian individuals were identical to native individuals from SA1 for Cytb and from SA1–SA3 for 16S (Fig. 1). Only one concatenated Cytb-16S haplotype was found which was unique to Sicily and highly similar to haplotypes found in FR, PT and SA1. Sicilian AR and Prmt6 alleles were identical to alleles occurring in the native range regions SA1-SA3. Cytb and 16S sequences of Sicilian individuals sampled by Lillo et al. (2013) were not included in the current analyses as they involved different gene regions. However, the mtDNA sequences in the present study were identical to those ofLillo et al. (2013)in the overlapping gene regions (Cytb:∼242 bp, 16S:∼374 bp).
DISCUSSION
native range because, as well phenotypic as genotypic traits of colonizing individuals might influence the invasion process (Sakai et al., 2001;Lee & Gelembiuk, 2008). Here, the origin of invasive French and PortugueseX. laevisspecimens was investigated using DNA sequence data.
The genetic diversity of the invasive Portuguese populations was lower than across the native range ofX. laevisin South Africa, but the Portuguese sequences were very similar or even identical to those of native individuals from the south-western Cape region in South Africa. This suggest (1) that the Portuguese populations may be derived from the latter and (2) that the Portuguese population derives from a single colonization event involving a small number of individuals, most likely stemming from one and the same source population in the south-western Cape region. This is in line with what one would expect from the historical data which attributes the introduction ofX. laevisin Oeiras (Portugal) to a single accidental flood of a basement of a research institute in 1979 (Rebelo et al., 2010). Analogous to the Portuguese samples, the identical sequences shared by the Sicilian (Lillo et al., 2013), Chilean (Lobos et al., 2014) and south-western Cape populations samples support the idea thatX. laeviswas imported in Sicily and Chile from wild populations in the south-western Western Cape Province. Indeed, the export ofX. laevisfrom the Western Cape Province is well documented, especially between 1940 and 1974 when there was only one official supplier in South Africa, i.e., Jonkershoek Fish Hatchery (Weldon, De Villiers & Du Preez, 2007).
In contrast to theX. laeviscolonization in Portugal, two distinct and divergent mtDNA lineages were detected in France. These lineages were related to two geographically non-overlapping native regions in South Africa. A majority of the French individuals possessed mtDNA highly similar or identical to a phylogeographic lineage from northern South Africa and Rooikrantz Dam (SA5–SA6, further referred to as the northern lineage). The other French individuals had mtDNA identical to native individuals from the south-western Cape (SA1–SA2). Haplotype and sequence diversity in the French population were relatively high and comparable to those in native South African regions. The mtDNA data thus suggest that two distinct phylogeographic lineages i.e., south-western Cape and northern lineage, contributed to the invasion ofX. laevisin France. Although the nDNA data are consistent with this suggestion, they solely indicate the Laingsburg region (SA3) and the south-western Cape (SA1–SA2) as possible source areas of the French nDNA alleles. This might be explained by either a scenario of a single South African source area where south-western and northern lineages admix or a scenario in which France was invaded by individuals from several distinct South African source areas followed by admixture of the colonizing animals. In the case of the first scenario, the most likely source population based upon the nDNA data would be the Laingsburg region which is considered as an admixture zone among the south-western Cape regions SA1-SA2 and the Beaufort West region SA4 (Du Preez et al., 2009;Furman et al., 2015). However, individuals from Laingsburg do not show mtDNA of the northern populations. Hence, the occurrence of the main mitochondrial alleles (Cytb: hap_16; 16S: hap_12) in French individuals cannot be explained by this scenario. Conversely, historical data supports the second scenario in which theX. laevis
both the south-western Western Cape province and the Eastern Cape Province (Port Elizabeth)(L Van Sittert & J Measey, 2015, unpublished data). Unfortunately, information concerning export from the latter region is limited. In contrast, there is some export data from the Western Cape province in the period that the French breeding facility was active (1950–1996) (Weldon, De Villiers & Du Preez, 2007). Until 1974, there was one official animal supplier i.e., Jonkershoek Fish Hatchery. Subsequently, trading was left to private enterprises for which export and collection information is hitherto unknown. Yet, since 1990, permits were licenced to four South African animal suppliers restricting the collection ofX. laevisto man-made water bodies (Weldon, De Villiers & Du Preez, 2007). Around the same time, in 1989, the ownership of the French breeding facility changed (Measey et al., 2012). Taking all these circumstances together, it seems likely that during its 56 years of existence, the French breeding facility might have importedX. laevisrepeatedly from different South African sources. Moreover, it seems not unlikely that secondary trading occurred within Europe or even worldwide e.g., among commercial breeding facilities and/or research institutes.
To the best of our knowledge, the FrenchX. laevispopulation is the first example in which two geographically non-overlapping phylogenetic lineages participated in aX. laevis
the French population offers a study system for investigating the extent to which the combination of genetic variation from divergent phylogeographic lineages might have influenced the French invasion and/or might influence its future range expansion. In sum, the genetic structure ofX. laevisin its native South African range allowed us to investigate the geographic origins of invasiveX. laevispopulations in France and Portugal. The current analyses showed that native phylogeographic lineages are not equally represented in invasive EuropeanX. laevispopulations.
ACKNOWLEDGEMENTS
This work was conducted in the contexts of the Biodiversa project BR/132/A1/INVAXEN-BE ‘‘Invasive biology ofXenopus laevisin Europe: ecology, impact and predictive models’’ and of the BELSPO-IUAP project P7/04 ‘‘SPEEDY: SPatial and environmental determinants of Eco-Evolutionary DYnamics: anthropogenic environments as a model’’ and FWO research community W0.009.11N ‘‘Belgian Network for DNA Barcoding,’’ coordinated by the ‘‘Joint Experimental Molecular Unit (JEMU)’’ at RBINS. JM would like to thank the DST-NRF Centre of Excellence for Invasion Biology for support. We gratefully thank Francesco Lillo, François Lefebvre, Jean Secondi, Mohlamatsane Mokhatla and Lubabalo Mofu for their aid in sampling Xenopus specimens.
ADDITIONAL INFORMATION AND DECLARATIONS
Funding
This work was financially supported by the Biodiversa project BR/132/A1/INVAXEN-BE ‘‘Invasive biology of Xenopus laevis in Europe: ecology, impact and predictive models’’ at RBINS. JM received funds from the National Research Foundation (South Africa) CPRR13080726510 and incentive funding. The funders had no role in study design, data collection and analysis, decision to publish, or preparation of the manuscript.
Grant Disclosures
The following grant information was disclosed by the authors: Biodiversa project: BR/132/A1/INVAXEN-BE.
National Research Foundation (South Africa): CPRR13080726510.
Competing Interests
John Measey is an Academic Editor for PeerJ.
Author Contributions
• Charlotte De Busschere conceived and designed the experiments, performed the experiments, analyzed the data, wrote the paper, prepared figures and/or tables. • Julien Courant, Anthony Herrel, Rui Rebelo and G. John Measey contributed
reagents/materials/analysis tools, reviewed drafts of the paper. • Dennis Rödder reviewed drafts of the paper.
Animal Ethics
The following information was supplied relating to ethical approvals (i.e., approving body and any reference numbers):
Animals from the Portuguese invasive population were captured under the permit no 570/2014/CAPT from Instituto da Conservação da Natureza e das Florestas, in the scope of the ‘‘Plano de erradicação de Xenopus laevis nas ribeiras do Concelho de Oeiras.’’ Animals from the native South-African populations were sampled under the permits 0056-AAA007-00092 (CapeNature, SA1) and CRO 109/13CR (Eastern Cape, SA6) provided by the Department of Economic Development, Environmental Affairs and Tourism and with ethics approval from the Research Ethics Committee: Animal Care and Use (protocol number: SU-ACUD14-00028).
DNA Deposition
The following information was supplied regarding the deposition of DNA sequences: New sequences are available from Genbank with accession numbers fromKT586615to
KT587048.
Data Availability
The following information was supplied regarding data availability: Data and online resource can be found at:
https://figshare.com/s/44b71de473fc11e5829d06ec4b8d1f61.
http://dx.doi.org/10.6084/m9.figshare.1577557.
REFERENCES
Bandelt HJ, Forster P, Rohl A. 1999.Median-joining networks for inferring intraspecific phylogenies.Molecular Biology and Evolution16:37–48
DOI 10.1093/oxfordjournals.molbev.a026036.
Berger L, Speare R, Daszak P, Green DE, Cunningham AA, Goggin CL, Slocombe R, Ragan MA, Hyatt AD, McDonald KR, Hines HB, Lips KR, Marantelli G, Parkes H. 1998.Chytridiomycosis causes amphibian mortality associated with population declines in the rain forests of Australia and Central America.Proceedings of the National Academy of Sciences of the United States of America95:9031–9036
DOI 10.1073/pnas.95.15.9031.
Bewick AJ, Anderson DW, Evans BJ. 2011.Evolution of the closely related, sex-related genes DM-W and DMRT1 in African clawed frogs (Xenopus).Evolution65:698–712
DOI 10.1111/j.1558-5646.2010.01163.x.
Crawford AJ, Lips KR, Bermingham E. 2010.Epidemic disease decimates amphibian abundance, species diversity, and evolutionary history in the highlands of central Panama.Proceedings of the National Academy of Sciences of the United States of America107:13777–13782DOI 10.1073/pnas.0914115107.
D’Amen M, Zimmermann NE, Pearman PB. 2013.Conservation of phylogeographic lineages under climate change.Global Ecology and Biogeography22:93–104
DOI 10.1111/j.1466-8238.2012.00774.x.
Daudin FM. 1802.Histoire naturelle des rainettes, des grenouilles et des crapauds. Paris: Imprimerie de Bertrandet: Chez Levrault.
Dlugosch KM, Anderson SR, Braasch J, Cang FA, Gillette HD. 2015.The devil is in the details: genetic variation in introduced populations and its contributions to invasion.
Molecular Ecology 24:2095–2111DOI 10.1111/mec.13183.
Dlugosch KM, Parker IM. 2008.Founding events in species invasions: genetic variation, adaptive evolution, and the role of multiple introductions.Molecular Ecology
17:431–449DOI 10.1111/j.1365-294X.2007.03538.x.
Du Preez LH, Kunene N, Hanner R, Giesy JP, Solomon KR, Hosmer A, Van Der Kraak GJ. 2009.Population-specific incidence of testicular ovarian follicles inXenopus laevisfrom South Africa: A potential issue in endocrine testing.Aquatic Toxicology
95:10–16DOI 10.1016/j.aquatox.2009.07.018.
Evans BJ, Brown RM, McGuire JA, Supriatna J, Andayani N, Diesmos A, Iskandar D, Melnick DJ, Cannatella DC. 2003.Phylogenetics of fanged frogs: testing bio-geographical hypotheses at the interface of the Asian and Australian faunal zones.
Systematic Biology 52:794–819DOI 10.1080/10635150390251063.
Excoffier L, Lischer HEL. 2010.Arlequin suite ver 3.5: a new series of programs to perform population genetics analyses under Linux and Windows.Molecular Ecology Resources10:564–567DOI 10.1111/j.1755-0998.2010.02847.x.
Faraone FP, Lillo F, Giacalone G, Lo Valvo M. 2008.The large invasive population of
Xenopus laevisin Sicily, Italy.Amphibia-Reptilia29:405–412
DOI 10.1163/156853808785112075.
Fouquet A. 2001.Des clandestins aquatiques.Zamenis6:10–11.
Fouquet A, Measey GJ. 2006.Plotting the course of an African clawed frog invasion in Western France.Animal Biology56:95–102DOI 10.1163/157075606775904722. Furman BLS, Bewick AJ, Harrison TL, Greenbaum E, Gvoždík V, Kusamba C, Evans
BJ. 2015.Pan-African phylogeography of a model organism, the African clawed frog
Xenopus laevis.Molecular Ecology24:909–925DOI 10.1111/mec.13076.
Grab S. 2010. Drakensberg Escarpment: mountains of geomorphic diversity. In: Migon P, ed.Geomorphological landscapes of the world. Dordrecht Heidelberg London New York: Springer, 133–142.
Grohovaz GS, Harley E, Fabian B. 1996.Significant mitochondrial DNA sequence divergence in natural populations ofXenopus laevis(Pipidae) from Southern Africa.
Herpetologica52:247–253.
Gurdon JB, Hopwood N. 2000.The introduction ofXenopus laevisinto developmental biology: of empire, pregnancy testing and ribosomal genes.International Journal of Developmental Biology44:43–50.
Hudson RR, Kaplan NL. 1985.Statistical properties of the number of recombination events in the history of a sample of DNA sequences.Genetics111:147–164. Kessing BD, Croom H, Martin A, McIntosh C, McMillan WO, Palumbi S. 1989.The
simple fool’s guide to PCR. Honolulu: Department of Zoology, University of Hawaii. Kolbe JJ, Glor RE, Rodríguez Schettino L, Lara AC, Larson A, Losos JB. 2004.
Genetic variation increases during biological invasion by a Cuban lizard.Nature
431:177–181DOI 10.1038/nature02807.
Kolbe JJ, Larson A, Losos JB, De Queiroz K. 2008.Admixture determines genetic diversity and population differentiation in the biological invasion of a lizard species.
Biology Letters4:434–437DOI 10.1098/rsbl.2008.0205.
Lafferty KD, Page CJ. 1997.Predation on the endangered tide-water goby,Eucyclogobius newberryi, by the introduced African clawed frog,Xenopus laevis, with notes on the frog’s parasites.Copeia3:589–592DOI 10.2307/1447564.
Lavergne S, Molofsky J. 2007.Increased genetic variation and evolutionary potential drive the success of an invasive grass.Proceedings of the National Academy of Sciences of the United States of America104:3883–3888DOI 10.1073/pnas.0607324104. Lee CE. 2002.Evolutionary genetics of invasive species.Trends in Ecology & Evolution
17:386–391DOI 10.1016/S0169-5347(02)02554-5.
Lee CE, Gelembiuk GW. 2008.Evolutionary origins of invasive populations.Evolutionary Applications1:427–448DOI 10.1111/j.1752-4571.2008.00039.x.
Librado P, Rozas J. 2009.DnaSP v5: a software for comprehensive analysis of DNA poly-morphism data.Bioinformatics25:1451–1452DOI 10.1093/bioinformatics/btp187. Lillo F, Dufresnes C, Faraone FP, Lo Valvo M, Stöck M. 2013.Identification and
potential origin of invasive clawed frogsXenopus(Anura: Pipidae) in Sicily based on mitochondrial and nuclear DNA.Italian Journal of Zoology80:566–573
DOI 10.1080/11250003.2013.847502.
Lillo F, Faraone FP, Lo Valvo M. 2010.Can the introduction ofXenopus lae-visaffect native amphibian populations? Reduction of reproductive occur-rence in presence of the invasive species.Biological Invasions13:1533–1541
DOI 10.1007/s10530-010-9911-8.
Lillo F, Marrone F, Sicilia A, Castelli G, Zava B. 2005.An invasive population ofXenopus laevis(Daudin, 1802) in Italy.Herpetozoa18:63–64.
Lips KR, Brem F, Brenes R, Reeve JD, Alford RA, Voyles J, Carey C, Livo L, Pessier AP, Collins JP. 2006.Emerging infectious disease and the loss of biodiversity in a Neotropical amphibian community.Proceedings of the National Academy of Sciences of the United States of America103:3165–3170DOI 10.1073/pnas.0506889103. Lobos G, Measey GJ. 2002.Invasive populations ofXenopus laevis(Daudin) in Chile.
Herpetological Journal12:163–168.
Lobos G, Mendez MA, Cattan P, Jaksic F. 2014.Low genetic diversity of the successful invasive African clawed frogXenopus laevis(Pipidae) in Chile.Studies on Neotropical Fauna and Environment 49:50–60DOI 10.1080/01650521.2014.912865.
Measey GJ. 2004. Species account:Xenopus laevis. In: Minter LR, Burger M, Harrison JA, Braack HH, Bishop PJ, eds.Atlas and Red Data book of the Frogs of South Africa, Lesotho and Swaziland. Washington, D.C.: Smithsonian Institution Press, 266–267. Measey GJ, Channing A. 2003.Phylogeography of the genusXenopusin southern Africa.
Amphibia-Reptilia24:321–330DOI 10.1163/156853803322440781.
Measey GJ, Rödder D, Green SL, Kobayashi R, Lillo F, Lobos G, Rebelo R, Thirion JM. 2012.Ongoing invasions of the African clawed frog,Xenopus laevis: a global review.
Biological Invasions14:2255–2270DOI 10.1007/s10530-012-0227-8.
Measey GJ, Vimercati G, De Villiers FA, Mokhatla MM, Davies SJ, Edwards S, Altwegg R. 2015.Frog eat frog: exploring variables influencing anurophagy.PeerJ 3:e1204
DOI 10.7717/peerj.1204.
Nixon KC. 1999.The Parsimony Ratchet, a New Method for Rapid Parsimony Analysis.
Cladistics15:407–414 DOI 10.1111/j.1096-0031.1999.tb00277.x.
Novak S, Mack R. 1993.Genetic variation inBromus tectorum(Poaceae): com-parison between native and introduced populations.Heredity71:167–176
DOI 10.1038/hdy.1993.121.
Peakall R, Smouse PE. 2012.GenAlEx 6.5: genetic analysis in Excel. Population genetic software for teaching and research–an update.Bioinformatics28:2537–2539
DOI 10.1093/bioinformatics/bts460.
Pearman PB, D’Amen M, Graham CH, Thuiller W, Zimmermann NE. 2010. Within-taxon niche structure: niche conservatism, divergence and predicted effects of climate change.Ecography33:990–1003DOI 10.1111/j.1600-0587.2010.06443.x. Peralta-García A, Valdez-Villavicencio JH, Galina-Tessaro P. 2014.African clawed
frog (Xenopus laevis) in Baja California: a confirmed population and possible ongoing invasion in Mexican watersheds.The Southwestern Naturalist 59:431–434
DOI 10.1894/NBF-12.1.
Posada D. 2008.jModelTest: phylogenetic model averaging.Molecular Biology and Evolution25:1253–1256DOI 10.1093/molbev/msn083.
Prentis PJ, Sigg DP, Raghu S, Dhileepan K, Pavasovic A, Lowe AJ. 2009.Understanding invasion history: genetic structure and diversity of two globally invasive plants and implications for their management.Diversity and Distributions15:822–830
DOI 10.1111/j.1472-4642.2009.00592.x.
R Development Core Team. 2014.R: a language and environment for statistical comput-ing. Vienna: the R Foundation for Statistical Computing.Available athttp:// www.R-project.org/.
Rambaut A. 2014.FigTree: Tree Figure Drawing Tool. Version 1.4.2.Available athttp: // tree.bio.ed.ac.uk/ software/ figtree/.
Rambaut A, Drummond AJ, Suchard M, Xie W. 2013.Tracer: MCMC Trace Analysis Tool. Version 1.6.0.Available athttp:// tree.bio.ed.ac.uk/ software/ tracer/.
Rebelo R, Amaral P, Bernardes M, Oliveira J, Pinheiro P, Leitão D. 2010.Xenopus laevis(Daudin, 1802), a new exotic amphibian in Portugal.Biological Invasions
Rius M, Darling JA. 2014.How important is intraspecific genetic admixture to the success of colonising populations?Trends in Ecology & Evolution29:233–242
DOI 10.1016/j.tree.2014.02.003.
Ronquist F, Huelsenbeck JP. 2003.MrBayes 3: Bayesian phylogenetic inference under mixed models.Bioinformatics19:1572–1574DOI 10.1093/bioinformatics/btg180. Rose W, Hewitt J. 1927.Description of a new species of Xenopus from the Cape
peninsula.Transactions of the Royal Society of South Africa14:343–346.
Sakai AK, Allendorf FW, Holt JS, Lodge DM, Molofsky J, With KA, Baughman S, Cabin RJ, Cohen JE, Ellstrand NC, Mccauley DE, O’Neil P, Parker IM, Thompson JN, Weller SG. 2001.The population biology of invasive species.Annual Review of Ecology and Systematics32:305–332DOI 10.1146/annurev.ecolsys.32.081501.114037. Schliep KP. 2011.phangorn: phylogenetic analysis in R.Bioinformatics27:592–593
DOI 10.1093/bioinformatics/btq706.
Skerratt LF, Berger L, Speare R, Cashins S, McDonald KR, Phillott AD, Hines HB, Kenyon N. 2007.Spread of chytridiomycosis has caused the rapid global decline and extinction of frogs.EcoHealth4:125–134DOI 10.1007/s10393-007-0093-5.
Stephens M, Donnelly P. 2003.A comparison of bayesian methods for haplotype reconstruction from population genotype data.American Journal of Human Genetics
73:1162–1169DOI 10.1086/379378.
Stephens M, Smith NJ, Donnelly P. 2001.A new statistical method for haplotype reconstruction from population data.American journal of human genetics68:978–89
DOI 10.1086/319501.
Stöver BC, Müller KF. 2010.TreeGraph 2: combining and visualizing evidence from dif-ferent phylogenetic analyses.BMC Bioinformatics11:7DOI 10.1186/1471-2105-11-7. Tamura K, Stecher G, Peterson D, Filipski A, Kumar S. 2013.MEGA6: Molecular Evolu-tionary Genetics Analysis version 6.0.Molecular Biology and Evolution30:2725–2729
DOI 10.1093/molbev/mst197.
Thompson JD, Higgins DG, Gibson TJ. 1994.CLUSTAL W: improving the sensitivity of progressive multiple sequence alignment through sequence weighting, position-specific gap penalties and weight matrix choice.Nucleic Acids Research22:4673–4680
DOI 10.1093/nar/22.22.4673.
Tinsley RC, Loumont C, Kobel HR. 1996. Geographical distribution and ecology. In: Tinsley RC, Kobel HR, eds.The biology of Xenopus. Oxford: Oxford University Press, 35–59.
Tinsley RC, McCoid MJ. 1996. Feral populations of Xenopus outside Africa. In: Tinsley RC, Kobel HR, eds.The biology of Xenopus. Oxford: Oxford University Press, 81–94. Voyles J, Young S, Berger L, Campbell C, Voyles WF, Dinudom A, Cook D, Webb R,
Alford RA, Skerratt LF, Speare R. 2009.Pathogenesis of chytridiomycosis, a cause of catastrophic amphibian declines.Science326:582–585DOI 10.1126/science.1176765. Weldon C, De Villiers AL, Du Preez LH. 2007.Quantification of the trade inXenopus
Weldon C, Du Preez LH, Hyatt AD, Muller R, Spears R. 2004.Origin of the amphibian chytrid fungus.Emerging Infectious Diseases10:2100–2105