www.epjournal.net – 2014. 12(4): 814-826 ¯ ¯ ¯ ¯ ¯ ¯ ¯ ¯ ¯ ¯ ¯ ¯ ¯ ¯ ¯ ¯ ¯ ¯ ¯ ¯ ¯ ¯ ¯ ¯ ¯ ¯ ¯ ¯
Original Article
Sex Differences and Similarities in Urban Home Ranges and in the Accuracy
of Cognitive Maps
Pia Stephan, Department of Anthropology, University of Vienna, Vienna, Austria. Email: [email protected] (Corresponding author).
Johannes P. M. Jäschke, Department of Anthropology, University of Vienna, Vienna, Austria. Elisabeth Oberzaucher, Department of Anthropology, University of Vienna, Vienna, Austria. Karl Grammer, Department of Anthropology, University of Vienna, Vienna, Austria.
Abstract: Former research has examined potential human sex differences in spatial abilities or home range size. Both are assumed to have an adaptive function. In this study we combined the investigation of home range size in an urban environment and spatial abilities by accuracy analysis of cognitive maps. Participants (n = 87) drew a sketch of their home range in Vienna depicting all places regularly visited in every-day life. We used the sketches’ geographical locations to calculate the size of the home range. With the Geometric Morphometric Methodology, we quantified the accuracy of cognitive maps by measuring Euclidean distances between corresponding landmarks in the sketches and the geographical maps of home ranges. Our results showed a non-significant trend for men to have a larger home range. Overall, participants’ cognitive maps were fairly accurate. However, men sketched their home range more precisely than women. Female map accuracy increased as a function of residency duration. In addition, accuracy of cognitive maps was influenced by home range size and number of frequently visited places. In summary, findings indicate that sex differences in home range size and spatial abilities may still persist in humans living in urbanized Western societies, but are also influenced by environmental experience.
Keywords: home range, spatial abilities, cognitive map, sex differences, Geometric Morphometric Methodology
– – Volume 12(4). 2014. -815- Introduction
Sex differences in spatial abilities are well documented and have been addressed by several evolutionarily-based theories, partially linking them to differences in home range size. One of the most popular theoretical approaches is the hunter-gatherer theory by Silverman and Eals (1992). They assume that, in hunter-gatherer ancestral environments, men and women evolved different cognitive abilities beneficial for their strategies to acquire food in the course of the sexual division of labor.
In the male-range theory of sex differences in spatial abilities, Gaulin and Fitzgerald (1986) refer to sexual selection theory by Trivers (1972) based on the phenomenon that many polygamous and promiscuous species show a sexual dimorphism in home range size (Apps, 1986; Baber and Coblentz, 1986; Cranford, 1977; Swihart and Slade, 1989). As a function of the particular mating system, individuals need to cover differential distances to gain access to potential reproductive partners and obtain resources. This mainly applies to the sex that engages in greater amounts of intrasexual competition. Since in most mammals, including Homo, males are more strongly subjected to that form of sexual selection, they usually have larger home ranges than females and, consequently, should have evolved increased spatial abilities as an adaptation for better orientation. However, in a comparative analysis, Clint, Sober, Garland, and Rhodes (2012) found no evidence for a positive association between species differences in home range size and corresponding differences in spatial navigation abilities. They hypothesize that sex differences in spatial abilities could have developed as a hormonal side effect of the evolution of sex differences in testosterone levels, which originally had no adaptive function for spatial navigation.
Empirical studies support such evolutionarily-based considerations by providing evidence on sex differences in spatial abilities and home range size. MacDonald and Hewlett (1999), for instance, demonstrated that men do have larger home ranges than women in modern hunter-gatherer societies. This dimorphism has also been shown for adults (Ecuyer-Dab and Robert, 2004) and children (Muchow, 1935) in industrialized Western societies.
– – Volume 12(4). 2014. -816- differ in brain areas associated with spatial cognition (Witelson, 1976), and studies demonstrating influences of sex hormones on spatial cognition (Hausmann, Slabbekoorn, van Goozen, Cohen-Kettenis, and nt r n, 2000; Kimura and Hampson, 1994; Postma et al., 2000). All together these findings suggest that sex differences in spatial abilities might in fact be evolutionary based.
One methodological approach for the investigation of spatial abilities is the use of cognitive maps. Cognitive maps may be seen as a mental representation of an individual’s environment, depicting only relevant and frequently visited places in daily life. Their development and characteristics are influenced by individual spatial abilities. Thus, on the basis of the results outlined above, one may expect that the cognitive maps of men and women differ in quantitatively measurable aspects such as Euclidean distance estimation. Research on cognitive maps has revealed further factors influencing map characteristics and development, such as age and environmental experience (for a review, see Evans,
1980). Using a drawing as a representation of one’s cognitive map harks back to Lynch (1960) and was thereafter applied by several researchers (e.g., Hirtle and Jonides, 1985; Kerst, Howard, and Gugerty, 1987). Kerst et al. (1987) could show that, despite the variance in subjects’ drawing abilities and corresponding questions on comparability (Byrne, 1979; Montello, 1991), drawings are a suitable and reliable method to survey distance estimation.
In the current study, we combined the investigation of home range size in an urban environment and of spatial abilities by analyzing the accuracy of cognitive maps. In contrast to most recent studies, we used a real-life setting for the analysis of cognitive maps. By drawing a sketch of their home range, participants provided us with an
approximation of their individual cognitive maps. For an analysis of the cognitive maps’
accuracy, we compared the sketches with the geographical maps of the individual home ranges. Differences were assessed applying the Geometric Morphometric Methodology.
Furthermore, we computed the participants’ actual home range sizes using geographical
data.
We hypothesized that men have a larger home range than women. In addition, we expected sex differences in the accuracy of cognitive maps in favor of male participants. We also investigated a potential connection between home range size and map accuracy. Materials and Methods
Participants
Male (n = 53) and female (n = 52) participants, mainly undergraduate students of the University of Vienna, voluntarily took part in the study without financial compensation. Data collection was conducted in two waves: 40 individuals participated over a period from March 2009 to May 2009 within a practical course at the Department of Anthropology, and 65 individuals took part in the study during the period from May 2010 to July 2010. Overall, 44 male and 43 female participants (age: M ± SD = 23.8 ± 3.33) provided complete datasets and were included in the analysis.
Procedure – Sketches and generating geographical maps
– – Volume 12(4). 2014. -817- everyday life. No time limit was given for this task. Additionally, participants filled out questionnaires asking for information about every drawn place (e.g., frequency of visits, activities usually performed there, travel time or feelings associated with it). We also collected socio-demographic data including number of friends, family network size, duration of living in Vienna, and mean number of days being in Vienna per month (referring to Dunstan et al., 2005). The sketches were digitized in jpg-format. Based on the
drawn places’ geographical locations, with addresses provided for each place, the geographical maps of the home ranges were generated in Google Maps and also converted to jpg-format.
Analysis – Geometric Morphometric Methodology
Since the participants’ drawings varied in scale and rotation, we compared the
geographical maps with the sketches by applying the Geometric Morphometric Methodology (GMM). GMM is primarily used for the analysis of shape in biological contexts. In contrast to traditional morphometric methods, GMM enables one to analyze and describe objects’ shapes irrespective of differences in their sizes, locations, and orientations (Slice, Bookstein, Marcus, and Rohlf, 1996). Other methods of analysis determine only the relative position of corresponding objects (Billinghurst and Weghorst, 1995), whereas GMM allows a more precise investigation of cognitive maps by calculating Euclidean distances.
The software TpsUtil (Rohlf, 2010a) was used to create a data file for each pair of maps (sketch of the home range and corresponding geographical map). Afterwards, individual landmarks were defined according to the places inside the home range and set in the software TpsDig2 (Rohlf, 2010b). We placed the landmarks on the marks for every place on the geographical maps, whereas the landmarks were set on the approximated centroid of the depicted places on the sketches.
In order to conduct an analysis of the landmark configurations of the drawn and geographical maps by GMM, a Procrustes superimposition (PS) was performed whereby the absolute position, orientation, and size are eliminated for each pair of maps (Bookstein, 1991). PS uses the method of least squares and consists of three main steps (Mitteroecker and Gunz, 2009). First, the raw data—in this case, landmark coordinates on drawn and geographical maps—are subjected to a translation of the centroids to the same origin. Thereafter, the landmark configurations are scaled to centroid size. This is defined as the square root of the sum of squared deviations of the coordinates to their centroid. Finally, the landmark configurations are rotated until the sum of squared Euclidean distances between corresponding landmarks is minimized (Rohlf and Slice, 1990). The resulting coordinates were used to analyze differences in shape and to determine Euclidean distances between homologous landmarks on sketches and geographical maps (see Figure 1). PS was performed using the software Morpheus (Slice, 2009).
Home range size
– – Volume 12(4). 2014. -818- polygon, is characterized by including any distance between two points from the set of points inside the polygon. The convex hull was computed on the basis of the Graham Scan algorithm, with its area calculated by Delaunay triangulation. Both computations were conducted in Matlab 17.12. The determination of the minimum convex polygon to estimate home range sizes described by Rose (1982) is more accurate than other applied methods (Boyle, Lourenco, da Silva, and Smith, 2009). Thus, it is still a widely used instrument in zoological studies. Specifically when no information is available about the exact routes between the individual core areas within the home range, the use of the convex hull as an approximation of home range size ensures the inclusion of all potentially used routes.
In addition, the Euclidean distances of the individual core areas to home ranges’ centroids and the distances to participants’ homes were calculated. For each subject, the mean and the sum of these distances were computed. These calculations, as well as all statistical analyses on home range size, were performed in SPSS 18.0. Group differences in home range size between men and women were analyzed by using Student-t- or Mann-Whitney-U-tests, respectively.
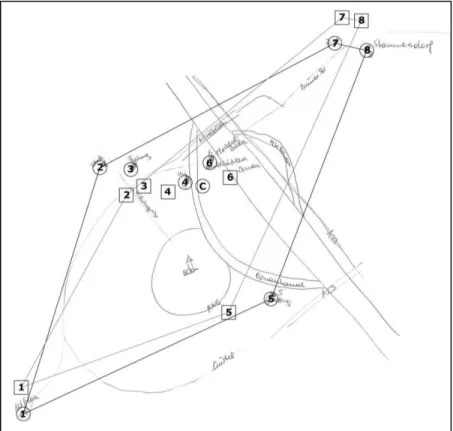
Figure 1. Example of a sketch of an individual home range in comparison with the geographical map generated in Google Maps
Note. Numbers in quadrates label drawn places inside the home range; numbers in circles label corresponding places on the geographical map.
Accuracy of cognitive maps
– – Volume 12(4). 2014. -819- regression for the comparison of sketched and real maps, we separately merged the sketched places of female and male participants. As a result, we could compare overall female and male cognitive maps of Vienna to the corresponding real maps. Calculations were performed applying the BiDimRegression algorithm (for further information, see Carbon, 2013) in the statistical software package R (R Core Team, 2013) version 3.0.2. for Windows.
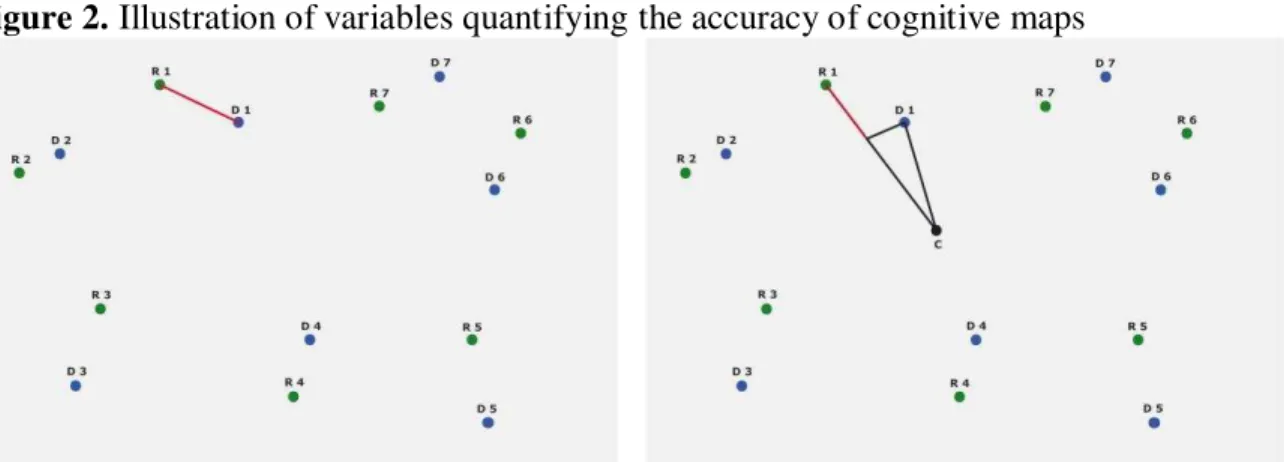
In addition, we quantified the accuracy of cognitive maps by means of Euclidean distances between the corresponding landmarks in the drawings and the geographical maps of home ranges. We also computed the difference of the distances between the homologous landmarks and centroid or home (see Figure 2). Mann-Whitney-U-tests were used to determine possible group differences between the sexes in the stated variables of map accuracy.
Figure 2. Illustration of variables quantifying the accuracy of cognitive maps
Note. Left side: Euclidean distance (red line) between homologous landmarks (D = drawn points; R = geographical points). Right side: Difference of distances (red line) between the homologous landmarks and the centroid (C).
Associations between the accuracy of cognitive maps and possible influencing factors
were analyzed in R using linear models. We regressed the accuracy of participants’
drawings on the number of frequently visited places, home range size, sex, years of residency in Vienna, and mean number of days being in Vienna each month. We allowed for interactions between the sex of a participant and the other fixed factors. Insignificant interactions were deleted stepwise from regressions. Measures of accuracy were log transformed before running the regression (Crawley, 2012). This was necessary to fit an adequate model.
Results
Sex differences in home range size
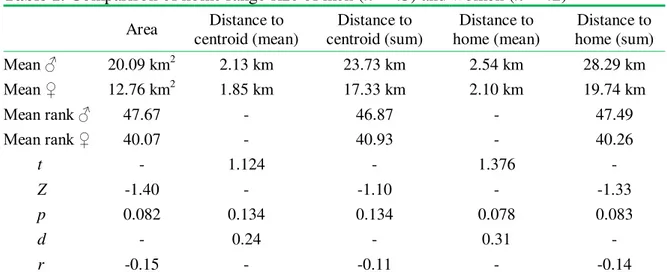
– – Volume 12(4). 2014. -820- Table 1. Comparison of home range size of men (n = 45) and women (n = 42)
Area Distance to centroid (mean)
Distance to centroid (sum)
Distance to home (mean)
Distance to home (sum)
Mean ♂ 20.09 km2 2.13 km 23.73 km 2.54 km 28.29 km
Mean ♀ 12.76 km2 1.85 km 17.33 km 2.10 km 19.74 km
Mean ran ♂ 47.67 - 46.87 - 47.49
Mean ran ♀ 40.07 - 40.93 - 40.26
t - 1.124 - 1.376 -
Z -1.40 - -1.10 - -1.33
p 0.082 0.134 0.134 0.078 0.083
d - 0.24 - 0.31 -
r -0.15 - -0.11 - -0.14
Note. Student t/Mann-Whitney U test (depending on data distribution), one-tailed; Effect sizes: d = Cohen’s
d, r = Bravais-Pearson correlation coefficient.
The bidimensional regressions for female and male participants’ s etched maps
revealed that both sexes’ s etches were quite similar to the real maps of their home ranges
(women: R2 = 0.70, df1 = 2, df2 = 832, p < 0.001; men: R2 = 0.76, df1 = 2, df2 = 966, p < 0.001). Thus, overall the participants’ cognitive maps seemed to be fairly accurate, although for men the similarity between sketched and real map was numerically higher.
Also, the comparison of sketches and geographical maps of home ranges related to the accuracy variables described in the Methods section showed that men sketched places more precisely than women. Euclidean distances between homologous points were smaller
on men’s s etches (Z = -4.092, n = 886 [number of sketched places], r = -0.14, MR men = 410.7, MR women = 481.2, p < 0.001). Moreover, the absolute difference of distances between the homologous landmarks and the centroid/home was larger on maps of female participants (between homologous landmarks and centroid: Z = -1.437, n = 886, r = -0.05,
MR men = 432.0, MR women = 456.7, p = 0.076; between homologous landmarks and home: Z = -1.692, n = 886, r = -0.06, MR men = 429.9, MR women = 459.1, p < 0.05).
Thus, men’s s etches seemed to be more accurate than women’s s etches. However, even
for significant sex differences the effect sizes were rather moderate.
Sex differences in the accuracy of cognitive maps
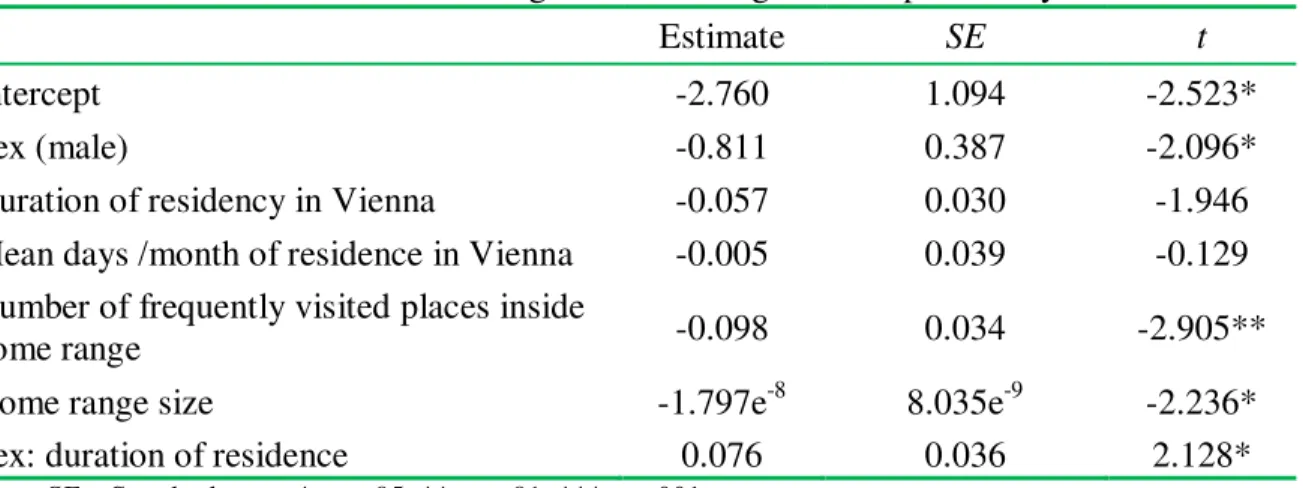
– – Volume 12(4). 2014. -821- Table 2. Results of the linear model regressions on cognitive map accuracy
Estimate SE t
Intercept -2.760 1.094 -2.523*
Sex (male) -0.811 0.387 -2.096*
Duration of residency in Vienna -0.057 0.030 -1.946
Mean days /month of residence in Vienna -0.005 0.039 -0.129
Number of frequently visited places inside
home range -0.098 0.034 -2.905**
Home range size -1.797e-8 8.035e-9 -2.236*
Sex: duration of residence 0.076 0.036 2.128*
Note. SE = Standard error. * p < .05; ** p < .01; ***p≤ .001.
Discussion
Sex differences in home range size
We found a non-significant trend of men having larger home ranges than women.
This points in the same direction as former studies’ findings (Ecuyer-Dab and Robert, 2004; MacDonald and Hewlett, 1999).
There are several possible explanatory approaches for the results of the current study. First of all, our results might be based on influences of the urbanized environment. Within the space of a city, all places with high functional importance (e.g., shopping possibilities) can be found close to home, irrespective to the question of where home is located inside the city. Consequently, there is no obligatory necessity for a wide home range. Conceivably, sex differences in ranging due to differential adaptations might exist, albeit not clearly expressed in the living conditions of modern Western societies.
Furthermore, the non-significance of our findings could be based on drawbacks of the method we applied. We did not analyze paths within the area of home range, as we did not have that information. Perhaps men and women differ in the distances of paths inside their home ranges. Maybe in a more detailed and objective spatial-temporal analysis, by direct observation or GPS tracking, for instance, overall sex differences in ranging could be determined.
Women’s cognitive maps are less accurate
– – Volume 12(4). 2014. -822- Interestingly, a deeper analysis of possible influencing factors on cognitive map accuracy revealed that there was an interaction between residence length and sex. We
found women’s accuracy to increase with each year of residency in Vienna. This
corresponds to a possible effect of familiarity with places on the accuracy of cognitive maps, even if former research could not convey a clear picture of this connection. For instance, Holahan (1978) showed that familiarity, based on duration of living or frequency of use, has a positive effect on the accuracy of cognitive maps. Ladd (1970), however, found no such association comparing the cognitive maps of people who differed in duration of housing.
In men, increasing duration of residency did not lead to greater map accuracy. It has been shown that men outperform women in tests on spatial knowledge of places if knowledge was newly required from direct experience (Montello et al., 1999). Therefore, it is conceivable that a familiarity effect on cognitive map accuracy emerges only for female participants because male participants have already obtained a relatively great spatial knowledge of their environment a short time after they have become residents in Vienna.
Association between home range size and accuracy of sketches
Interestingly, a positive correlation between home range size and accuracy of sketches could be found. This corresponds to the results of a study by Ecuyer-Dab and Robert (2004). The larger the home range, the smaller is the Euclidean distance of corresponding points, and the smaller is the difference between distances of homologous points and the centroid or home. This association between home range size and accuracy of cognitive maps is in line with the hypothesis that improved spatial abilities constitute an adaptation to increased ranging for the sex engaging in more intrasexual competition (Gaulin and Fitzgerald, 1986). However, we found no direct link between home range size, cognitive map accuracy, and sex of a participant. Instead, participants with a great extent of ranging seem to have a more precise knowledge of their environment irrespective of sex. This indicates that there may be a substantial effect of spatial information acquisition on the mental representation of the environment due to experience by ranging.
The connection between map accuracy and home range size, as well as frequently visited places, is particularly interesting because the method itself sets limits to scale and, therefore, to accuracy. The size of the sketch surface and the order in which places of the home range are drawn constrain the map’s scale and the relative position of subsequently drawn places. In other words, the more places are drawn, the more difficult it is to sketch the following point accurately regarding scale and relative position (see Evans, 1980).
Overall, our findings indicate that ranging and increased environmental experiences
indeed have a positive impact on the individual’s cognitive map accuracy, overruling
potentially confounding methodological variables.
Conclusions
In the current study we investigated human home ranges in an urbanized sample and
individuals’ cognitive maps as the corresponding mental representations. One advance of
– – Volume 12(4). 2014. -823- in short-term learning pace as a possible influence on map accuracy. A cognitive map is influenced by a person’s spatial abilities. Thus, its characteristics li e accuracy, for instance, allow conclusions to be made about these skills. Applying Geometric Morphometric Methodology, we used an innovative approach for the analysis of these characteristics, enabling us to compare shapes irrespective of orientation and size.
Therefore, we were able to precisely analyze the mental representation of peoples’
environments. Our approach suggests that GMM could be established for the analysis of a huge range of data types besides the mainstream shape analysis of faces or bones.
Possible confounding variables of urban environments affecting spatial abilities and behavior still remain unexplained. In order to identify these, comparative approaches investigating people living in rural and urban settings could be a great asset. Additionally, the use of GPS-tracking or direct behavior observation could give deeper insights into a determination of temporal-spatial patterns of movement in urban home ranges.
Our findings indicate that evolutionarily-based sex differences in home range size and spatial abilities, in part, still persist in humans living in urbanized Western societies. On the other hand, spatial abilities seem to be strongly influenced by external variables in the long run. As predicted, men tend to have a larger home range and show a higher accuracy in cognitive maps. However, differences in the accuracy of cognitive maps disappear with women’s greater length of residence and, thus, greater knowledge of environmental conditions. In contrast to prior studies, focusing on cognitive map differences depending either on sex or familiarity, we find a corresponding interaction. Furthermore, a connection between home range size as well as number of frequently visited places and accuracy of cognitive maps persists. This indicates that decreased environmental experience has a positive influence on the mental representation of the person’s environment. To conclude, the temporal as well as spatial home range experiences seem to be related to the acquisition and possession of spatial information. Consequently, a high extent of experience may positively affect the knowledge and cognitive representation of
the individual’s home range.
Acknowledgements: We would like to thank Markus Koppensteiner, the Associate Editor Harald Euler, and three anonymous reviewers for their constructive criticism and helpful comments that improved the manuscript substantially.
Received 13 May 2013; Revision submitted 21 July 2014; Accepted 30 July 2014
References
Alexander, G. M. (2005). Memory for face locations: Emotional processing alters spatial abilities. Evolution and Human Behavior, 26, 352–362.
Apps, P. J. (1986). Home ranges of feral cats on Dassen Island. Journal of Mammalogy, 67, 199–200.
Baber, D. W., and Coblentz, B. E. (1986). Density, home range, habitat use, and reproduction in feral pigs on Santa Catlina Island. Journal of Mammalogy, 67, 512– 525.
– – Volume 12(4). 2014. -824-
International Symposium, IEEE Computer Society: Los Alamitos, CA, 40–47.
Bookstein, F. L. (1991). Morphometric tools for landmark data: Geometry and biology. Cambridge, UK: Cambridge University Press.
Boyle, S. A., Lourenço, W. C., da Silva, L. R., and Smith, A. T. (2009). Home range estimates vary with sample size and methods. Folia Primatologica, 800, 33–42. Byrne, R. W. (1979). Memory for urban geography. Quarterly Journal of Experimental
Psychology, 31, 147–154.
Carbon, C. C. (2013). BiDimRegression: Bidimensional regression modeling using R.
Journal of Statistical Software, Code Snippets, 52, 1–11.
Clint, E. K., Sober, E., Garland, T., Jr., and Rhodes, J. S. (2012). Male superiority in spatial navigation: Adaptation or side effect? The Quarterly Review of Biology, 87, 289– 313.
Collins, D. W., and Kimura, D. (1997). A large sex difference on a two-dimensional mental rotation task. Behavioral Neuroscience, 111, 845–849.
Coluccia, E., and Louse, G. (2004). Gender differences in spatial orientation: A review.
Journal of Environmental Psychology, 24, 329–340.
Cranford, J. A. (1977). Home range and habitat utilization by Neotoma fuscipes as determined by radiotelemetry. Journal of Mammalogy, 58, 165–172.
Crawley, M. J. (2012). The R book. Chichester, UK: John Wiley & Sons.
Dabbs, J. M., Chang, E., Strong, R. A., and Milun, R. (1998). Spatial ability, navigation strategy, and geographical knowledge among men and women. Evolution and Human Behavior, 19, 89 98.
Dunstan, F., Weaver, N., Araya, R., Bell, T., Lannon, S., Lewis, G., Patterson, J., Thomas, H., Jones, P., and Palmer, S. (2005). An observation tool to assist with the assessment of urban residential environments. Journal of Environmental Psychology, 25, 239–305.
Ecuyer-Dab, I., and Robert, M. (2004). Spatial ability and home-range size: Examining the relationship in Western men and women (Homo sapiens). Journal of Comparative Psychology, 118, 217–231.
Evans, G. W. (1980). Environmental cognition. Psychological Bulletin, 88, 259–287. Friedman, A., and Kohler, B. (2003). Bidimensional regression: assessing the configural
similarity and accuracy of cognitive maps and other two-dimensional data sets.
Psychological Methods, 8, 468–491.
Gaulin, S. J. C., and Fitzgerald, R. W. (1986). Sex differences in spatial ability: An evolutionary hypothesis and test. American Naturalist, 127, 74–88.
Hausmann, M., Slabbekoorn, D., van Goozen, S. H. M., Cohen-Kettenis, P. T., and
nt r n, O. (2000). Sex hormones affect spatial abilities during the menstrual cycle. Behavioral Neuroscience, 114, 1245–1250.
Hirtle, S. C., and Jonides, J. (1985). Evidence of hierarchies in cognitive maps. Memory & Cognition, 13, 208–217.
Holahan, C. J. (1978). Environment and behavior: A dynamic perspective. New York: Plenum Press.
James, T. W., and Kimura, D. (1997). Sex differences in remembering the locations of objects in an array: Location-shifts versus location-exchanges. Evolution and Human Behavior, 18, 155–163.
– – Volume 12(4). 2014. -825- estimation and map sketching. Bulletin of the Psychonomic Society, 25, 185–188. Kimura, D., and Hampson, E. (1994). Cognitive pattern in men and women is influenced
by fluctuations in sex hormones. Current Directions in Psychological Science, 3, 57–61.
Ladd, F. (1970). Black youths view their environment: Neighborhood maps. Environment and Behavior, 2, 74–99.
Levin, S. L., Mohamed, F. B., and Platek, S. M. (2005). Common ground for spatial cognition? A behavioral and fMRI study of sex differences in mental rotation and spatial working memory. Evolutionary Psychology, 3, 227–254.
Linn, M. C., and Petersen, A. C. (1985). Emergence and characterization of sex differences in spatial ability: A meta-analysis. Child Development, 56, 1479–1498.
Lynch, K. (1960). The image of the city. Cambridge, MA: MIT Press.
MacDonald, D. H., and Hewlett, B. S. (1999). Reproductive interests and forager mobility.
Current Anthropology, 40, 501–523.
Matthews, M. H. (1987). Gender, home range and environmental cognition. Transactions of the Institute of British Geographers, New Series, 12, 43–56.
McGivern, R. F., Mutter, K. L., Anderson, J., Wideman, G., Bodnar, M., and Huston, P. J. (1998). Gender differences in incidental learning and visual recognition memory: Support for a sex difference in unconscious environmental awareness. Personality and Individual Differences, 25, 223–232.
Mitteroecker, P., and Gunz, P. (2009). Advances in geometrics morphometrics.
Evolutionary Biology, 36, 235–247.
Montello, D. R. (1991). The measurement of cognitive distance: Methods and construct validity. Journal of Environmental Psychology, 11, 101–122.
Montello, D. R., Lovelace, K. L., Golledge, R. G., and Self, C. M. (1999). Sex-related differences and similarities in geographic and environmental abilities. Annals of the Association of American Geographers, 89, 515–534.
Muchow, M. (1935). Der Lebensraum des Großstadtkindes. Hamburg: Riegel.
Postma, A., Meyer, G., Tuiten, A., van Honk, J., Kessels, R. P. C., and Thijssen, J. (2000). Effects of testosterone administration on selective aspects of object-location memory in healthy young women. Psychoneuroendocrinology, 25, 563–575.
R Core Team (2013). R: A language and environment for statistical computing. R Foundation for Statistical Computing. Vienna, Austria. Retrieved from http://.R-project.org/
Robert, M., and Chevrier, E. (2003). Does men’s advantage in mental rotation persist when real three-dimensional objects are either felt or seen? Memory and Cognition, 31, 1136–1145.
Rohlf, F. J. (2010a). TpsUtil, Version 1.46. Department of Ecology and Evolution, State University of New York at Stony Brook, NY.
Rohlf, F. J. (2010b). TpsDig2, digitize landmarks and outlines, Version 2.16. Department of Ecology and Evolution, State University of New York at Stony Brook, NY. Rohlf, F. J., and Slice, D. E. (1990). Extensions of the procrustes method for the optimal
superimposition of landmarks. Systematic Zoology, 39, 40–59.
Rose, B. (1982). Lizard home ranges: Methodology and functions. Journal of Herpetology, 16, 253–269.
– – Volume 12(4). 2014. -826- in spatial abilities: Data from 40 countries. Archives of Sexual Behavior, 36, 261– 268.
Silverman, I., and Eals, M. (1992). Sex differences in spatial abilities: Evolutionary theory and data. In J. H. Barkow, L. Cosmides, and J. Tooby (Eds.), The adapted mind: Evolutionary psychology and the generation of culture (pp. 531–549). New York: Oxford University Press.
Slice, D. E. (2009). Morpheus et al.: Software for morphometric research, Alpha Version. Department of Ecology and Evolution, State University of New York at Stony Brook.
Slice, D. E., Bookstein, F. L., Marcus, L. F., and Rohlf, F. J. (1996). A glossary for geometric morphometrics. In L. F. Marcus, M. Corti, A. Loy, G. J. P. Naylor, and D. E. Slice (Eds.), Advances in morphometrics (pp. 531–551). New York and London: Plenum Press, in cooperation with NATO Scientific Affairs Division. Swihart, R. K., and Slade, N. A. (1989). Differences in home-range size between sexes of
Microtus ochrogaster. Journal of Mammalogy, 70, 816–820.
Tobler, W. (1965). Computation of the corresponding of geographical patterns. Papers of the Regional Science Association, 15, 131–139.
Trivers, R. L. (1972). Parental investment and sexual selection. In B. Campbell (Ed.),
Sexual selection and the descent of man (pp. 136–179). Chicago: Aldine-Atherton. Vandenberg, S., and Kuse, A. R. (1978). Mental rotations: A group test of
three-dimensional spatial visualization. Perceptual and Motor Skills, 47, 599–604.
Voyer, D., Voyer, S., and Bryden, M. P. (1995). Magnitude of sex differences in spatial abilities: A meta-analysis and consideration of critical variables. Psychological Bulletin, 117, 250–270.