Submitted12 September 2015 Accepted 9 July 2016 Published4 August 2016
Corresponding authors Nicola S. Heckeberg,
[email protected] Gertrud E. Rössner,
Academic editor Sean Rogers
Additional Information and Declarations can be found on page 24
DOI10.7717/peerj.2307
Copyright 2016 Heckeberg et al.
Distributed under
Creative Commons CC-BY 4.0
OPEN ACCESS
Systematic relationships of five newly
sequenced cervid species
Nicola S. Heckeberg1,2,3, Dirk Erpenbeck1,4, Gert Wörheide1,2,4and
Gertrud E. Rössner1,2,4
1Department for Earth and Environmental Sciences, Palaeontology & Geobiology, Ludwig-Maximilians-Universität München, Munich, Germany
2SNSB-Bayerische Staatssammlung für Paläontologie und Geologie, Munich, Germany 3Department of Zoology, University of Cambridge, Cambridge, United Kingdom 4GeoBio-Center, Ludwig-Maximilians-Universität München, Munich, Germany
ABSTRACT
Cervid phylogenetics has been puzzling researchers for over 150 years. In recent decades, molecular systematics has provided new input for both the support and revision of the previous results from comparative anatomy but has led to only partial consensus. Despite all of the efforts to reach taxon-wide species sampling over the last two decades, a number of cervid species still lack molecular data because they are difficult to access in the wild. By extracting ancient DNA from museum specimens, in this study, we obtained partial mitochondrial cytochrome b gene sequences for Mazama bricenii, Mazama chunyi,Muntiacus atherodes,Pudu mephistophiles, andRusa marianna, including three holotypes. These new sequences were used to enrich the existing mitochondrial DNA alignments and yielded the most taxonomically complete data set for cervids to date. Phylogenetic analyses provide new insights into the evolutionary history of these five species. However, systematic uncertainties within Muntiacus persist and resolving phylogenetic relationships withinPuduandMazamaremain challenging.
SubjectsBiodiversity, Computational Biology, Evolutionary Studies, Taxonomy, Zoology
Keywords Cervidae, Phylogeny, Polyphyly, Cytochrome b,Pudu,Mazama,Muntiacus,Rusa
INTRODUCTION
Cervidae forms a subclade of ruminant artiodactyls and is the second most diverse group among terrestrial artiodactyls, with 55 extant species (IUCN, 2015), including one recently extinct species (Rucervus schomburgki;Duckworth, Robichaud & Timmins, 2008). Cervids natively inhabit Eurasia, the Americas, and potentially northernmost Africa (Mattioli, 2011). They are adapted to diverse climatic zones, ranging from the tropics to arctic regions, and to diverse habitats such as tundra, grasslands, swamps, forests, woodlands, and ecotones (Mattioli, 2011). Their unique phenotypic feature is a pair of antlers, which are osseous outgrowths of the frontal bone that are shed and rebuilt regularly. The current conservation status of cervids lists 29 species as ‘threatened’, nine species as ‘data deficient’, and 17 species as ‘least concern’ in the IUCN Red List of Threatened Species (IUCN, 2015). Samples and life history data are much more difficult to obtain from rare and threatened species than from more abundant species. Therefore, there is a discrepancy between the well-studied (e.g., Cervus elaphus, red deer;Odocoileus hemionus, mule deer;Rangifer
Figure 1 Overview of the current state of the art of cervid classification based on literature (e.g., Hassanin & Douzery, 2003;Pitra et al., 2004;Kuznetsova, Kholodova & Danilkin, 2005; Hernández-Fernández & Vrba, 2005;Hughes et al., 2006;Gilbert, Ropiquet & Hassanin, 2006;Marcot, 2007; Agnarsson & May-Collado, 2008;Duarte, González & Maldonado, 2008;Hassanin et al., 2012).The diagram shows the different clades, their geographical origination, and their current distribution.
tarandus, reindeer) and barely known species (e.g.,Mazamaspp., brocket deer;Puduspp., pudu;Muntiacusspp., muntjac). Consequently, data for the latter taxa are overdue.
Cervid phylogenetics has improved considerably in recent decades through molecular systematics (e.g.,Hassanin & Douzery, 2003;Pitra et al., 2004;Kuznetsova, Kholodova & Danilkin, 2005;Hernández-Fernández & Vrba, 2005;Hughes et al., 2006;Gilbert, Ropiquet & Hassanin, 2006;Marcot, 2007;Agnarsson & May-Collado, 2008; Duarte, González & Maldonado, 2008;Hassanin et al., 2012). However, several species are still underrepresented in molecular phylogenetic analyses because their current conservation status of threatened or data deficient negatively affects their sample collection.
Consensus has been reached for the monophyly of taxa Cervidae, Muntiacini, Cervini, Capreolini and Odocoileini. Muntiacini and Cervini form the clade Cervinae, which is a sister taxon to Capreolinae comprising Odocoileini, Rangiferini, Capreolini and Alceini (e.g.,Hernández-Fernández & Vrba, 2005;Gilbert, Ropiquet & Hassanin, 2006;Hassanin et al., 2012). The Capreolinae-Cervinae-split is commonly supported in previously published topologies and corresponds to the first (though not formally valid) morphological cervid classification by Brooke (1878), who differentiated Plesiometacarpi and Telemetacarpi
(Fig. 1). Systematic relationships within Cervinae appear to be largely resolved, whereas
Capreolinae systematics is more controversial (Pitra et al., 2004; Gilbert, Ropiquet & Hassanin, 2006;Duarte, González & Maldonado, 2008;Hassanin et al., 2012;Croitor, 2014). For an overview of current cervid classifications, seeFig. 1.
The mitochondrial cytochrome b (Cytb) gene is the best-sampled across cervids.Cytb
is a marker that is known to be highly variable in mammals, which makes it a suitable marker for resolving genus and species level relationships but less suitable for resolving deeper nodes (family level and above) or for population studies (Hofreiter et al., 2001a). In addition, because mitochondrial genomes are maternally inherited, they may not allow a full reconstruction of a species’ evolutionary history if there is no random mating.
However,Hassanin et al. (2012)sequenced and analysed mitochondrial genomes of 33 cervid species as part of a large Artiodactyla phylogenetic reconstruction and provided a robust phylogenetic framework for cervids. To date, sampling of mitochondrial genomes and individual partialCytbsequences cover 46 of the 55 cervid species.
Here, we present the results of phylogenetic analyses that include four species not previously sampled for molecular data: Mazama chunyi (Peruvian dwarf brocket),
Muntiacus atherodes(Bornean yellow muntjac; including holotype),Pudu mephistophiles
(Northern pudu; including holotype), andRusa marianna(Philippine brown deer), all of which were taken from museum specimens. We also sequenced threeMazama bricenii
museum specimens (Mérida brocket; including the holotype), of whichCytbsequences have been published recently and were sequenced contemporaneously with our study (Gutiérrez et al., 2015). Except forM. atherodes(least concern), all species have been assessed as vulnerable based on the IUCN Red List. Therefore, considering the threat of extinction, our approach of sequencing DNA from museum material is an important contribution to cervid systematics.
The specific aims of our study were (1) to reconstruct the systematic position ofM. bricenii andM. chunyiand further investigate the polyphyly of the genus Mazama, (2) to reconstruct the systematic position ofM. atherodes, (3) to test the monophyly of the PhilippineRusaspecies (R. alfrediandR. marianna) and their sister taxon position relative to the Indonesian and mainlandRusaspecies (R. timorensisandR. unicolor), and (4) to test the monophyly ofPudu.
To achieve these aims, we experimented with different matrix sizes and parameters to examine the reliability of the phylogenetic signal throughout different data sets.
MATERIAL & METHODS
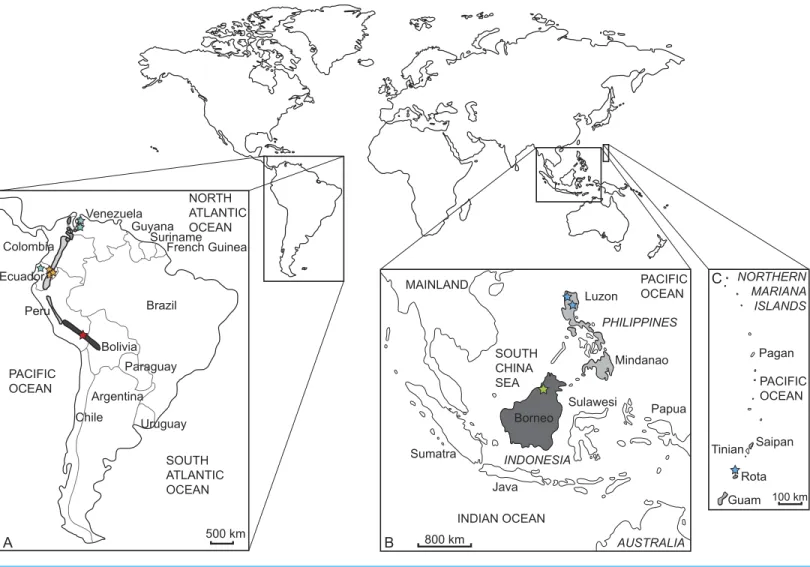
MaterialWe sampled and sequenced five species from which no molecular data were available previous to our study (but seeGutiérrez et al., 2015) (Tables 1and2). Samples were taken from thirteen museum specimens, nine from the Natural History Museum in London (BMNH) and four from the Museum für Naturkunde Berlin (ZMB). Three specimens represent holotypes (BMNH 1908.6.24.5Mazama bricenii, BMNH 1971.3088Muntiacus atherodes, BMNH 1896.1.28.6Pudu mephistophiles). One sample was derived from a wet specimen, one from a skin, and the remaining samples consisted of bone fragments or dried soft tissue remains of skulls (details inTable 2).Figure 2shows where the specimens originated and their currently known species distributions. The collection dates of each specimen are given inTable 2.
Figure 2 Current distribution of the sampled species and the approximate sampling localitions of the specimens.(A) Enlarged map of South America; dark grey/red star:Mazama chunyi, light grey/yellow stars:Pudu mephistophiles, medium grey/turquoise stars:Mazama bricenii. (B) En-larged map of Indonesian and Philippine Islands and (C) enEn-larged map of the Northern Mariana Islands; dark grey/green star:Muntiacus atherodes, light grey/blue stars:Rusa marianna.
We obtained completeCytb and/or mitochondrial genome sequences from NCBI GenBank (http://www.ncbi.nlm.nih.gov/genbank/) for 48 cervid species. These included the 45 extant cervids (full set of available extant cervid data excluding recently published
M. briceniisequences;Gutiérrez et al., 2015), one subspecies (Cervus elaphus canadensis), a questionableP. mephistophilessequence fromHassanin et al. (2012), and one fossil cervid species (Megaloceros giganteus). We also added six non-cervid ruminant taxa (Table 1). The resultingCytbdata set is the most taxonomically extensive for Cervidae to date.
Extraction
The challenges of sequencing ancient DNA are related to the degradation of DNA after an organism’s death triggered by exogenous processes such as oxidation and background radiation. These processes affect the sugar-phosphate backbone and nitrous bases of the DNA strand, whereas hydrolytic processes such as depurination and deamination cause
Table 1 GenBank and ENA accession numbers.Newly sequenced species are in bold.
Species Cytochrome b mtGenome
Alces alces AJ000026 JN632595
Alces americanus M98484 –
Axis axis AY607040 JN632599
Axis kuhlii HQ893538 –
Axis porcinus DQ379301 JN632600 JN632603
AY607038
Blastocerus dichotomus
NC_020682
JN632603
Capreolus capreolus AJ000024 JN632610
Capreolus pygargus AJ000025 –
AY044863
Cervus albirostris
AF423202
JN632690
AF423198
Cervus elaphus canadensis
EF139147
–
Cervus elaphus JF489133 NC_007704
Cervus nippon JF893484 NC_006993
Dama dama AJ000022 JN632629
Dama mesopotamica AY607034 JN632630
Elaphodus cephalophus NC_008749 NC_008749
Elaphurus davidianus AF423194 JN632632 JN632646
Hippocamelus antisensis1
NC_020711 DQ379307
Hippocamelus antisensis2
GU190862
JN632646
DQ789177 DQ789178
Hippocamelus bisulcus
GU190863
–
Hydropotes inermis AJ000028 JN632649 DQ789209
Mazama americana1
DQ789217
Mazama americana2 JN632657 DQ789221 JN632656
Mazama americana3
NC_020719 DQ789201
Mazama americana4
DQ789204
Mazama americana5 DQ789219
JN632656
DQ789187 DQ789231
Mazama bororo
DQ789228
–
(continued on next page)
Table 1(continued)
Species Cytochrome b mtGenome
LT546656 LT546657
Mazama bricenii
LT546658
–
Mazama chunyi LT546655 –
JN632658
Mazama gouazoubira1
NC_020720
Mazama gouazoubira2 DQ379308
JN632658 DQ789210 DQ789214 Mazama nana DQ789227 –
Mazama nemorivaga1 JN632660 DQ789205 DQ789206 DQ789226 JN632659
Mazama nemorivaga2
NC_024812 JN632660 KC146954 Mazama pandora KC146955 – JN632661 Mazama rufina NC_020721 JN632661 KC146956 KC146957 KC146958 Mazama temama KC146959 – AM182644 †Megaloceros giganteus
AM182645
–
Muntiacus atherodes LT546659 – NC_004577 AY239042 DQ445734 DQ445732 DQ445735 Muntiacus crinifrons DQ445733 NC_004577
Muntiacus feae AF042721 –
NC_004563
Muntiacus muntjak1
AY225986
Muntiacus muntjak2 AF042718
NC_004563 EF523665 EF523666 EF523667 EF523668 Muntiacus putaoensis EF523669 –
(continued on next page)
Table 1(continued)
Species Cytochrome b mtGenome
AF527537 Muntiacus reevesi NC_004069 NC_008491 KJ425278 KJ425279 KJ425281 Muntiacus rooseveltorum KJ425282 –
Muntiacus truongsonensis1 KJ425277
Muntiacus truongsonensis2 KJ425276
– FJ705435 AF042720 Muntiacus vuquangensis NC_016920 FJ705435
Odocoileus hemionus1 HM222707 FJ188783
Odocoileus hemionus2
FJ188870
JN632670
Odocoileus virginianus1 DQ379370
Odocoileus virginianus2 M98491
JN632671 DQ789190 DQ789193 DQ789195 Ozotoceros bezoarticus DQ789199 JN632681 JN632691 LT546651 LT546652 LT546653 Pudu mephistophiles LT546654 – JN632692 AY607039 Pudu puda NC_020740 JN632692 AB245426 AY726704 Rangifer tarandus KM506758 NC_007703
Rucervus duvaucelii AY607041 JN632696
Rucervus eldii AY157735 JN632697
Rucervus schomburgki AY607036 –
JN632698 Rusa alfredi NC_020744 JN632698 LT546647 LT546648 LT546649 Rusa marianna LT546650 –
Rusa timorensis AF423200 JN632699
Rusa unicolor FJ556575 NC_008414
(continued on next page)
Table 1(continued)
Species Cytochrome b mtGenome
Antilocapra americana JN632597 JN632597
Boselaphus tragocamelus EF536350 EF536350
Hyemoschus aquaticus JN632650 JN632650
Moschus moschiferus FJ469675 JN632662
Okapia johnstoni JN632674 JN632674
Tragelaphus scriptus AF022067 JN632706
breakage in the DNA molecules (Hofreiter et al., 2001b). Due to the large number of mitochondria per cell, mitochondrial gene sequences are more likely to be retrieved from ancient material than is nuclear DNA (Hofreiter et al., 2001a).
DNA was extracted using the Qiagen QIAamp DNA Micro Kit, including an overnight lysis step, following the manufacturer’s protocol. After lysis, 1µg dissolved carrier RNA was
added, as recommended in the protocol, 80µl elution buffer was used for the last elusion
step, and the last incubation step was set for five minutes instead of one minute. After the extraction, the DNA concentration was measured using a spectrometer (NanoDrop 1000; Peqlab Biotechnologie GmbH, software version ND 1000 v3.7.1) (Table 2).
PCR
Eight cervid-specificCytbprimers (Lister et al., 2005) were used to amplify a 747 base pair region from the 1140-base-pair-long mitochondrialCytb, from nucleotide position 64 to 810. Each primer pair amplified a 100–140-base-pair-long sequence with overlap to adjacent sequences (Lister et al., 2005;Table 2).
Polymerase chain reactions (PCR) were carried out using a TProfessional thermocycler (Biometra). Sequences amplified from each primer pair were validated against
contamination with a negative control. The specific PCR components are given inTable 3. The PCR programme was as follows: initial denaturation at 95 ◦
C for three minutes, then 35 cycles of denaturation at 95 ◦
C for 30 s, annealing at 55 ◦
C for 30 s, and extension at 72 ◦
C for 30 s, and a final extension at 72 ◦
C for five minutes. Amplification of target sequences was initially attempted using the components inTable 3, column (a) and an annealing temperature of 55 ◦
C. Some primer-sample combinations did not result in amplification products. Therefore, we experimented with the components, e.g., not adding Bovine Serum Albumin (BSA), changing the overall reaction volume, and/or increasing the concentration of magnesium chloride (Table 3). We also experimented with annealing temperatures ranging from 48 ◦
C to 52 ◦
C. These optimisations were successful in most cases; however, a few sections of the individual sequences for certain specimens could not be successfully amplified, which left gaps in theCytbsequence (Table 2).
Successfully amplified PCR products were sequenced in both directions using the amplification primers and the ABI BigDyeTerminator 3.1 chemistry following the manu-facturer’s protocol on a capillary sequencer (ABI 3730; AppliedBiosystems) in the Genomic Sequencing Unit, Faculty of Biology, LMU. After quality control, the approximately 100– 140-base-pair-long forward and reverse sequencing reads were assembled into contigs.
Table 2 Overview of sampled specimens.Specimens in bold are holotypes. The category ‘sample DNA’ provides the weight of the tissue sample in the tube prior to DNA extraction and DNA concentration after extraction.
Species Collection ID Accession
no.
Sample (mg)
DNA (ng/µl)
Gaps in alignment
Collection entry
Locality Material
Rusa marianna BMNH 1996.2 LT546647 15.5 93.65 – 1996 Philippines Soft tissue fragments*
Rusa marianna ZMB-MAM-75158 LT546648 15.1 60.97 – NA Philippines, Luzon
Soft tissue & bone fragments*
Rusa marianna ZMB-MAM-20409 LT546649 12.0 49.64 – 1915 Captive animal Soft tissue & bone fragments*
Rusa marianna ZMB-MAM-75146 LT546650 26.2 38.67 403–467 1905 US, Northern Mariana Islands
Soft tissue & bone fragments#
Pudu mephistophiles BMNH 1899.2.18.20 LT546651 30.5 97.35 64–118, 176–211
1899 Ecuador Soft tissue & bone
fragments*;
juvenile
Pudu mephistophiles BMNH 1896.1.28.6 LT546652 7.6 56.57 – 1896 Ecuador, Paramo of Papallacta
Snippet of skin, including hair; immature
Pudu mephistophiles BMNH 1899.2.18.21 LT546653 9.9 27.34 604–674, 784–810
1899 Ecuador Soft tissue &
bone fragments*;
juvenile
Pudu mephistophiles ZMB-MAM-61577 LT546654 165.8 325.57 – 1970 Captive animal Wet specimen; neonatal
Mazama chunyi BMNH 1967.1362 LT546655 15.6 56.22 – 1967 Peru, Chiquis
Soft tissue & bone fragments**
Mazama bricenii BMNH 1913.4.24.3 LT546656 36.0 74.17 – 1913 Venezuela, Merida
Soft tissue & bone fragments*
Mazama bricenii BMNH 1908.6.24.5 LT546657 2.4 7.07 288–394, 604–674
1908 Venezuela Soft tissue & bone fragments*
Mazama bricenii BMNH 1934.9.10.228 LT546658 10.2 77.08 – 1934 Ecuador, Pichincha
Soft tissue & bone fragments*
Muntiacus atherodes BMNH 1971.3088 LT546659 23.3 87.60 – 1971 Borneo, Brunei/ Indonesia/Malaysia
Soft tissue & bone fragments**
Notes.
BMNH, British Museum of Natural History London; ZMB, Zoological collections of the Museum für Naturkunde Berlin. *From skull.
**From skull & mandible. #From mandible.
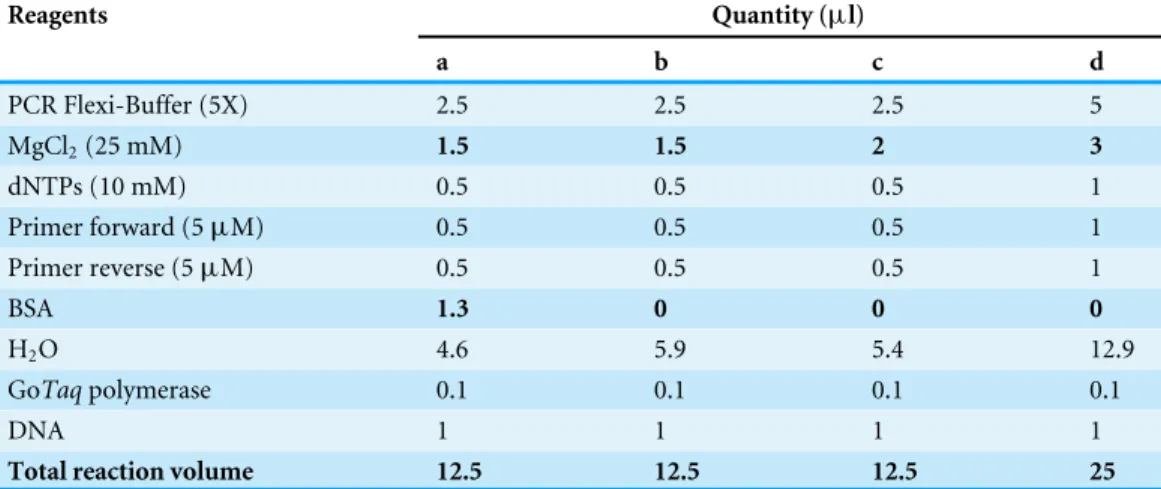
Table 3 PCR recipes.Initial PCRs were undertaken using recipe (a), for optimisation recipes (b)–(d) were used depending on fragment and sample. Reagents that were varied are in bold. Components of col-umn (a) in combination with an annealing temperature of 50 ◦
C worked better for primer pair 4, (d) worked well for primer pair 8, and (c) worked better for some samples in combination with primer pair 2 (Lister et al., 2005). Except for one case, varying the annealing temperature had no influence on the reac-tion.
Reagents Quantity (µl)
a b c d
PCR Flexi-Buffer (5X) 2.5 2.5 2.5 5
MgCl2(25 mM) 1.5 1.5 2 3
dNTPs (10 mM) 0.5 0.5 0.5 1
Primer forward (5µM) 0.5 0.5 0.5 1
Primer reverse (5µM) 0.5 0.5 0.5 1
BSA 1.3 0 0 0
H2O 4.6 5.9 5.4 12.9
GoTaqpolymerase 0.1 0.1 0.1 0.1
DNA 1 1 1 1
Total reaction volume 12.5 12.5 12.5 25
These individual contigs were then assembled into a contig with a maximum length of 747 base pairs using CodonCodeAligner v.3.7.1.1.
To ensure that a genuine cervidCytbfragment has been amplified, the forward and reverse pre-assembly sequences from each primer, the individual contigs of forward and reverse strands and the final 747-base-pair-long contigs were each BLASTed against NCBI GenBank entries. Only fragments returning a cervid in the first 50 BLAST search results were used. In almost all cases, where the BLAST result was different from the cervid result, the sequences were found to be most similar toBos taurus. This contamination is possibly caused by the BSA added to enhance PCR outcomes. Sequences were submitted to the European Nucleotide Archive under accession numbersLT546647–LT546659(Tables 1
and2).
Alignment
The concatenated consensus sequences of each specimen were added to the existingCytb
data set (NCBI GenBank) and pairwise aligned by eye using Mesquite v.2.75 (Maddison & Maddison, 2011) and Seaview 4.2 (Gouy, Guindon & Gascuel, 2010). The alignment was carefully checked for stop codons within the alignment and/or unusual nucleotide positions by translation into amino acids to ensure the absence of pseudogenes and sequencing errors. The IUPAC ambiguity code was used in few cases where character states could not be assessed unambiguously after a re-investigation of the raw sequence data. These ambiguities most likely represent misreads from the chromatogram due to the somewhat poor condition of the DNA. Because these ambiguous sites are not numerous, their impact on the phylogenetic signal is negligible.
In total, three different alignments were created. First, we aligned the new 747 base pair long sequences with the completeCytbsequences from GenBank to form a data set of 1140 base pairs. The final data set contained 130 taxa (124 cervids, six other ruminants). Second,
to test whether the newly sequenced, shorter fragments carried a sufficient phylogenetic signal, two further alignments were created. One alignment was exactly 747 base pairs long, which was the same length as the new sequences, including internal gaps. The other alignment excluded even the internal gaps and was 569 base pairs long. We also re-analysed the cervid subset (33 species) of the complete mitochondrial genome alignment available for Artiodactyla inHassanin et al. (2012)without the new sequences. The taxon sampling contained 39 cervid taxa and seven non-cervid ruminants.
Phylogenetic analyses
To test for the impact of alignment length on phylogenetic signal, we developed three align-ments with varying base pair lengths. For each alignment, we used PartitionFinder (Lanfear et al., 2012) to identify the optimal partitioning scheme and mutation model (Table 4).
A summary of all analyses undertaken including the models and partitioning scheme, is shown in Table 4. PartitionFinder analysis on the 1140Cytb data set resulted in a scheme with three different partitions for the individual codon positions using SYM for position 1, HKY for position 2, and GTR for position 3 for Bayesian inference analyses with MrBayes v.3.2.4 (Ronquist et al., 2012) (in the following referred to as BI-1140-part). For the maximum likelihood analyses with RAxML (Stamatakis, 2006), PartitionFinder suggested GTR for all codon positions (ML-1140). Alternatively, we undertook a Bayesian inference analysis without partitioning using the GTR model on the 1140-base-pair-long alignment (BI-1140-unpart). We also undertook a Bayesian analysis with theCytbalignment reduced to 747 base pairs (BI-747-part) using the partitioning scheme suggested by PartitionFinder and the models decribed above as well as one unpartitioned analysis (BI-747-unpart) using GTR. Further, we undertook another Bayesian analysis on the 569 base pair alignment (BI-569-unpart), excluding the internal gaps, representing the shortest sequence length of the newly sequenced taxa (Maz_bri_Q_BMNH_1908.6.24.5). This analysis was run using the GTR model and no partitioning because of the short alignment length. The Bayesian re-analysis of the complete mitochondrial genome sequences (BI-mtG; without the newly sequencedCytbsequences) was undertaken using GTR and divided the data set into seven partitions (Hassanin et al., 2012). The re-analysis was carried out because previous re-analyses of subsets of the complete mitochondrial genome resulted in different results than those found byHassanin et al. (2012).
Substitution models for all analyses were implemented with a gamma distribution (Ŵ) without a proportion of invariant sites (I), although PartitionFinder suggested using Ŵ+I for most partitions. It is known that the combinationŴ+I may create two areas of equal probability in the tree landscape, which can lead to convergence problems (Moyle et al., 2012). All Bayesian Inference analyses were run with MrBayes v.3.2.4 (Ronquist et al., 2012) using Metropolis-Coupled Markov Chain Monte Carlo (MC3); two separate
runs sampled the tree landscape at a temperature of 0.35 sampling every 1,000th tree. The mitochondrial genome analysis was run with MrBayes v.3.2.4 (Ronquist et al., 2012) using MC3with two separate runs sampling every 5,000th tree at a temperature of 0.35. All analyses automatically stopped when the standard deviation of split frequencies of posterior probabilities reached 0.01. From all post burn-in sampled trees, a consensus tree
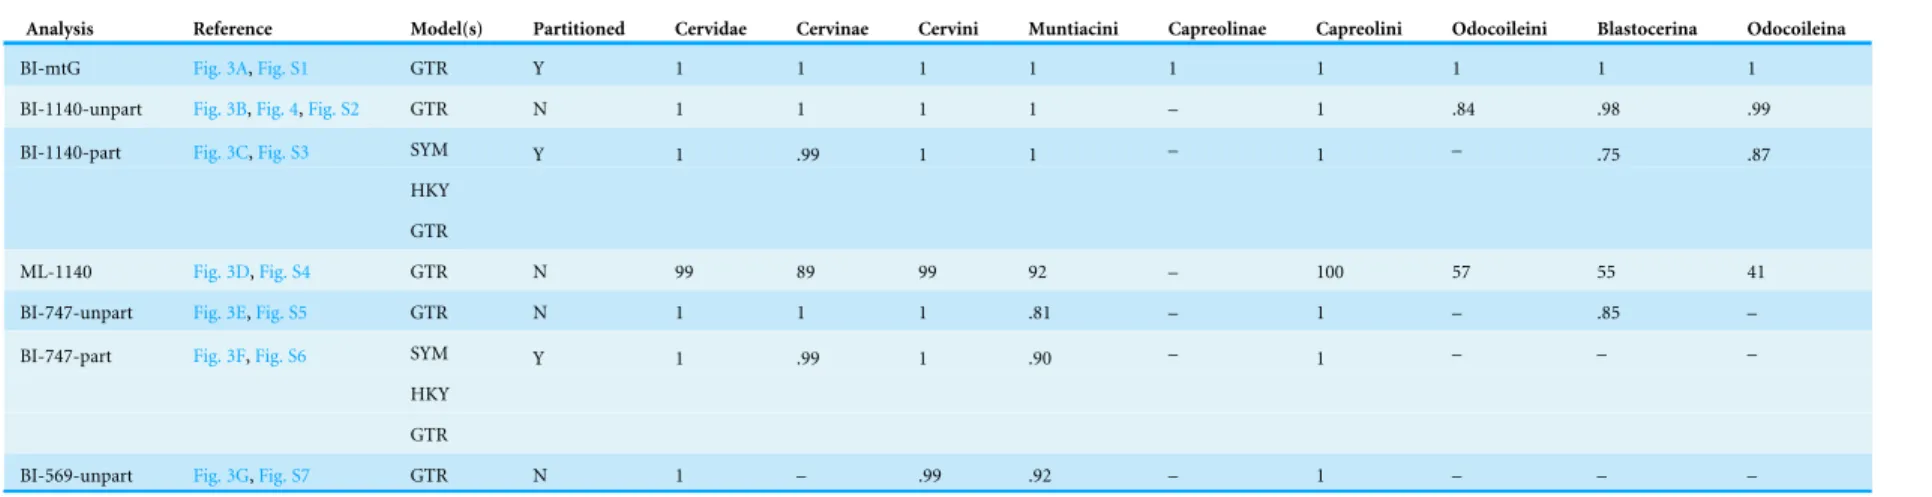
Table 4 Summary of analyses, model choice, partitioning, and support for major clades in the resulting topologies.
Analysis Reference Model(s) Partitioned Cervidae Cervinae Cervini Muntiacini Capreolinae Capreolini Odocoileini Blastocerina Odocoileina
BI-mtG Fig. 3A,Fig. S1 GTR Y 1 1 1 1 1 1 1 1 1
BI-1140-unpart Fig. 3B,Fig. 4,Fig. S2 GTR N 1 1 1 1 – 1 .84 .98 .99
SYM
HKY
BI-1140-part Fig. 3C,Fig. S3
GTR
Y 1 .99 1 1 – 1 – .75 .87
ML-1140 Fig. 3D,Fig. S4 GTR N 99 89 99 92 – 100 57 55 41
BI-747-unpart Fig. 3E,Fig. S5 GTR N 1 1 1 .81 – 1 – .85 –
SYM
HKY
BI-747-part Fig. 3F,Fig. S6
GTR
Y 1 .99 1 .90 – 1 – – –
BI-569-unpart Fig. 3G,Fig. S7 GTR N 1 – .99 .92 – 1 – – –
Notes.
Abbreviations:: BI, Bayesian Inference; ML, Maximum Likelihood, the number represents theCytbsequence length in the current alignment; Y, yes; N, no; part, partitioned; unpart, unpartitioned. The values within cells represent the node support for the respective split either as Bayesian posterior probabilities or as bootstrap support from maximum likelihood analyses; ‘‘–’’ indicates that the clade was not recovered in the respective analysis.
Hec
k
eberg
e
t
al.
(2016),
P
eerJ
,
DOI
10.7717/peerj.2307
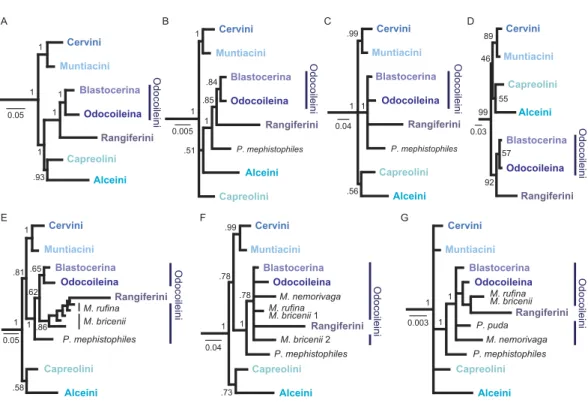
Figure 3 Overview of higher level topologies resulting from re-analysis of the complete mitochon-drial genome sequences (Hassanin et al., 2012) and six different analyses of our data set. (A) BI-mtG, (B) BI-1140-unpart, (C) BI-1140-part (D) ML-1140, (E) BI-747-unpart, (F) BI-747-part, (G) BI-569-unpart. Support values represent bootstrap values in D, all other support values are posterior probabili-ties. (A–D) show monophyly for all major cervid lineages, whereas in (E–G) resolution, particularly within Odocoileini is lost. PositioningP. mephistophilesproves to be difficult. Scale bars represent substitutions per site.
was generated (burn-in=25%). For the Maximum Likelihood analysis we used RAxML v.7.3.0 (Stamatakis, 2006) including a rapid bootstrap search with 100 replicates on the 1140 base pair long data set.
Hyemoschus aquaticus(Tragulidae, Artiodactyla), which is an extant representative of crown ruminants, was used as the outgroup. The original tree topologies from all seven analyses are provided inFigs. S1–S7, and an overview is given inFig. 3andTable 4.
RESULTS
Extraction, PCR, sequencing
The results from the DNA extraction, PCR, and sequencing processes are summarised in
Table 2. For some of the eightCytbfragments, DNA amplification was not sufficient, which
resulted in gaps in the sequence for a few specimens (Table 2). Upon checking the traces in CodonCodeAligner, we observed in our alignment that Y (C or T;n=50) and R (G or A;
n=19) are the most common ambiguities. These nucleotide substitutions are most likely caused by hydrolytic deamination. This is a process by which the deamination of cytosine residues to form uracil residues, 5-methyl-cytosine residues to form thymine residues, or adenine residues to form hypoxanthine residues in the template DNA strand will be misread during the PCR process when a new DNA strand is synthesised. In turn, this leads
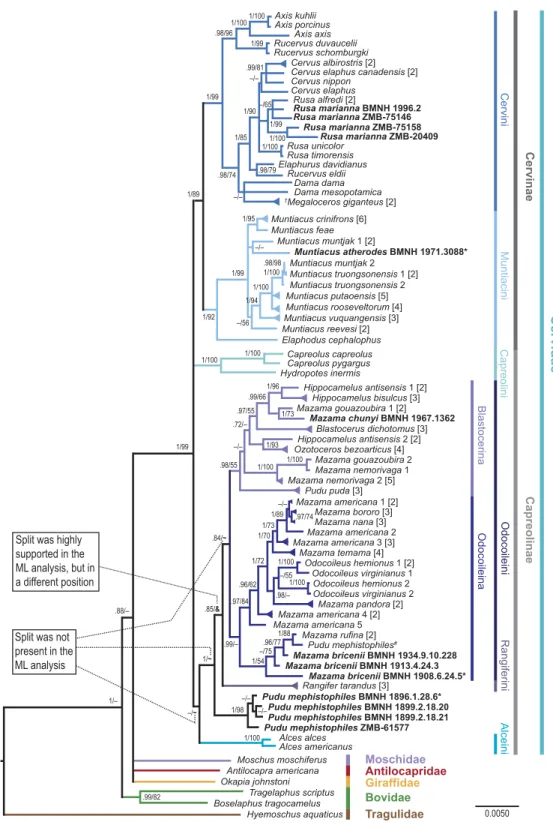
Figure 4 Consensus tree of the unpartitioned Bayesian Analyses (BI-1140-unpart).Values represent posterior probabilities (PP), and if applicable, bootstrap (BS) support from the ML analysis is shown. Only values larger than 70% (PP) and 50% (BS) are displayed. If the support was not above 70% or 50%, but the split was present in one of the analyses; this is indicated by an ‘‘–’’.(continued on next page. . . )
Figure 4 (...continued)
‘‘∼’’ indicates that the split was absent in the maximum likelihood analysis. ‘‘&’’ indicates that the split
was absent in the maximum likelihood topology, but highly supported in a different position; this is only represented in the node separatingRangiferfrom the majority of Odocoileini (seeFig. S4). The numbers in square brackets indicate the number of individual sequences representing the taxon in the present anal-ysis. If these multiple sequences representing one species were not identical, it is indicated by a triangu-lar shaped tip of the branch. Taxa in bold are the newly sequenced specimens, asterisks indicate holotypes, and the hash indicates the putatively wrongly assignedP. mephistophilessequence. Higher hierarchical taxa are shown on the right.
to evident C→T or G→A substitutions (Hofreiter et al., 2001a.;Pääbo et al., 2004;Briggs et al., 2007;Briggs et al., 2010). Across our samples, Y ambiguities occurred up to ten times per specimen, and R ambiguities occurred up to three times per specimen. These numbers represent a very small proportion of approximately 1% of the overall sequence length of 747 base pairs. We tested the impact of the ambiguities on the reconstruction and found that the ambiguities did not tremendously influence the phylogenetic signal of the samples. However, these ambiguities represent an additional uncertainty in the analyses.
Phylogenetic analyses
The results from seven analyses are summarised inTable 4andFig. 3. Of the full 1140-base-pair-longCytbdata set 593 characters are constant, 68 variable characters are parsimony-uninformative, and 479 characters are parsimony-informative. The analyses of the 1140-base-pair-longCytbrepresent our primary results and are shown inFig. 4. In addition to the Bayesian Inference analyses and the Maximum Likelihood analysis of the total Cytb
data set (including the new sequences), we tested the impact of reduced data sets (569 characters and 747 characters, Bayesian Inference) and different partitioning schemes on the phylogenetic signal (BI-1140-unpart, BI-1140-part, ML-1140, BI-569-unpart, BI-747-unpart, BI-747-part;Table 4,Fig. 3,Figs. S2–S7).
We next re-analysed the complete mitochondrial genome alignment fromHassanin et al. (2012)for the subset of cervids (14904 base pairs, Bayesian Inference; BI-mtG,Fig. S1), because the authors stated that some of the nodes are not robust, as proven by previous re-analyses (Bibi, 2014). The re-analysis presented here (BI-mtG,Fig. S1) resulted in the support of a fully resolved topology, which is congruent with the topology inHassanin et al. (2012).
Data partitioning of the 1140-base-pair-longCytbdata set and reduced data sets did not lead to contradictory results compared to unpartitioned analyses or larger data sets. Resolution and node supports generally decreased with decreasing alignment length
(Fig. 3). Cervid lineages above the genus level were almost always recovered with all matrix
sizes and partitioning schemes (Table 4). None of the topologies supportably contradicted each other; however, all topologies differed from each other to some extent at the tribe, genus, and/or species level. Compared to theCytb-only topologies, the mitochondrial genome topology showed generally higher posterior probabilities (Figs. 3and4).
The monophyly of superordinate clades, Cervidae, Cervini, Muntiacini, and Capreolini (includingHydropotes), was supported in all topologies (Figs. 3 and4, Figs. S1–S7,
Table 4). In all but one topology (BI-569-unpart;Fig. 3G,Fig. S7), the monophyly of
Cervinae, was consistently supported (Fig. 3,Table 4). Odocoileini was weakly supported in three topologies (ML-1140, BI-1140-unpart, BI-mtG;Figs. 3A,3B,3Dand4,Figs. S1,S2,
S4andTable 4). Capreolinae, however, was supported as a monophyly in only one topology
(BI-mtG,Fig. 3A,Fig. S1), and in the other topologies, the taxon splits unresolved into Odocoileini, Rangiferini (Rangifer), Alceini (Alces), and Capreolini (Capreolus,Hydropotes)
(Fig. 3). Alceini and Capreolini sometimes formed a clade (Figs. 3A,3C,3D,3Eand3F)
or were unresolved (Figs. 3Band3G). Systematic relationships of capreoline taxa showed marginal differences in each of our topologies.
The results at the genus and species levels are shown inFig. 4andFigs. S1–S7. The newly sequencedMuntiacus atherodesnested within Muntiacini, mostly polytomous, with two
Muntiacus-clades. One clade consisted ofM. muntjak, M. feae, andM. crinifrons, and the other consisted ofM. truongsonensis,M. putaoensis,M. rooseveltorum,M. reevesi, andM. vuquangensis. Two topologies (BI-1140-unpart, ML-1140) indicated a poorly supported sister taxon relationship betweenM. muntjakandM. atherodes(Fig. 4,Figs. S2andS4).
We found strong support in Cervini to place all fourRusa mariannaspecimens in a PhilippineRusa-clade, withRusa alfrediin all but one topology (BI-569-unpart;Fig. 4,
Figs. S1–S7).
The newly sequencedMazama chunyiis consistently placed as a sister taxon toM. goua-zoubira, whereas the threeM. briceniispecimens are primarily a sister taxon toM. rufina.
The fourP. mephistophilesspecimens always form a clade, which is either a sister taxon to or nested within Odocoileini. Interestingly, they are not placed in a sister position to the mitochondrial genome sequence labelledP. mephistophiles fromHassanin et al. (2012). In none of our topologies didP. mephistophilesandP. pudaform a sister taxon relationship, which makes the monophyly of the genus questionable.M. nemorivaga,M. rufina,M. bricenii,P. puda, and particularlyP. mephistophilesoccasionally take up positions outside the above proposed clades, thus underpinning their yet unsolved systematics.
Regardless of the controversies debated here and elsewhere regarding Odocoileini molecular systematics, topologies (in the literature and here,Figs. 3and4,Figs. S1–S7) show two consistently occurring subclades carrying phylogenetic signal within Odocoileini (e.g., Gilbert, Ropiquet & Hassanin, 2006;Duarte, González & Maldonado, 2008;Hassanin et al., 2012). One subclade consists ofHippocamelus,Blastocerus,Ozotoceros,M. gouazoubira,
M. chunyi,M. nemorivaga, andPudu puda. The other subclade consists ofOdocoileus,M. americana,M. bororo,M. nana,M. temama,M. pandora,M. rufina, andM. bricenii. Based on these results we establish two new subtribes Blastocerina and Odocoileina according to the rules of the ICZN (http://www.iczn.org/code). These two subtribes form the tribe Odocoileini and have Rangiferini as sister taxon.
Blastocerina subtribus nova
Type genus:BlastocerusWagner, 1844
Higher taxa: Odocoileini—Capreolinae—Cervidae
The subtribe Blastocerina consists of the following species: Blastocerus dichotomus,
Hippocamelus antisensis,Hippocamelus bisulcus,Mazama chunyi,Mazama gouazoubira,
Mazama nemorivaga,Ozotoceros bezoarticus, andPudu puda(Fig. 4). Blastocerina refers to the clade originating from the most recent common ancestor ofBlastocerus dichotomus
(Illiger, 1815) andPudu puda Molina, 1782.Pudu mephistophiles potentially falls within that clade, but more data are needed for a definite placement of this taxon.
Odocoileina subtribus nova
Type genus:OdocoileusRafinesque, 1832
Higher taxa: Odocoileini—Capreolinae—Cervidae
The subtribe Odocoileina consists of Mazama americana,Mazama bororo, Mazama bricenii,Mazama nana,Mazama pandora,Mazama rufina,Mazama temama,Odocoileus hemionus, andOdocoileus virginianus(Fig. 4). Odocoileina refers to the clade originating from the most recent common ancestor of Odocoileus virginianus(Von Zimmermann, 1778–1783) andMazama briceniiThomas, 1908.
DISCUSSION
Phylogenetic analyses
Our results represent the most complete compilation of molecular data in terms of taxon sample for cervids to date. The thorough sampling enabled us to place the de novo sequenced species in topologies representing overall cervid systematics. We were able to solve some relationships but also discovered previously unknown issues. The data set excludesMuntiacus gongshanensis, for which only a very short tRNA sequence is available, and Axis calamianensis, M. montanus,M. puhoatensis, andM. vaginalis, for which no molecular data are available.
Our experiments with different matrix sizes, partitioning schemes, and models revealed that the resulting topologies do not dramatically differ from each other. However, we could observe that the resolution decreased with decreasing sequence length. All seven analyses recovered major clades within Cervidae (Table 4andFig. 3). These experiments were undertaken to single out strong phylogenetic signal and the significance thereof, which is consistent regardless of the data set sizes and parameter changes. We observed that taxa, which are generally unstable across topologies from different studies (e.g.,Pitra et al., 2004;Gilbert, Ropiquet & Hassanin, 2006;Agnarsson & May-Collado, 2008;Hassanin et al., 2012), were the first to lose a supported systematic position with decreasing sequence length
(Fig. 3andTable 4). The partitioning scheme and model choice did not make as much
difference as did the matrix size. As expected, partitioning did not necessarily lead to better resolved topologies or significantly better supported clades. However, some differences were observed comparing maximum likelihood with Bayesian inference methods (Figs. 3and4). The topology resulting from re-analysis of the mitochondrial genome sequences (BI-mtG) representing the largest sequence length is fully resolved and has the highest overall support values. The shortest data set (BI-569-unpart), although less well resolved, recovered all higher-level lineages and is in most points congruent with the other topologies based on larger data sets (Table 4andFig. 3). These different analyses enabled us to examine the significance of the individual resulting topologies.
Muntiacus atherodes
The species diversity of Muntiacini is the least covered among cervid subclades in molecular phylogenetic analyses. Muntiacini comprises muntjacs (Muntiacus) and the tufted deer (Elaphodus), includes the smallest members of Cervinae (40 to 70 cm shoulder height), and inhabits Southeast Asia and Eastern China (Mattioli, 2011). The systematic relationships within Muntiacini in our topologies (Fig. 4) are largely congruent with most recent studies and are the least controversial in molecular cervid systematics (e.g.,Pitra et al., 2004;Gilbert, Ropiquet & Hassanin, 2006;Agnarsson & May-Collado, 2008;Hassanin et al., 2012). Here, M. crinifrons andM. feae are always sister taxa, and when the resolution is sufficiently high, M. muntjak is a sister taxon to both of them. In our topologies,
M. putaoensis,M. rooseveltorum,M. truongsonensis, andM. vuquangensisalways form a clade. Most often, withM. reevesiis a sister taxon to that clade, but occasionally,M. reevesi
is sister taxon to all other muntjacs (BI-747-part, BI-569-unpart). Due to the consistent position ofM. muntjak 2 (AF042718) as sister taxon toM. truongsonensis, we suggest re-confirming this sequence.
The monotypicElaphodus cephalophus, which is distributed in southeast China, is always a sister taxon to all muntjacs in both our topologies and previously published trees (Pitra et al., 2004;Gilbert, Ropiquet & Hassanin, 2006;Agnarsson & May-Collado, 2008;Hassanin et al., 2012).
Because of the presumed primitive antler morphology ofM. atherodes(Groves & Grubb, 1982), its systematic position was hypothesised to be betweenElaphodus cephalophusand theMuntiacus-clade, which is not supported by our results. The newly sequenced holotype specimen ofM. atherodesis nested within muntjacs, unresolved in a polytomy in most of our topologies. However, some results indicate a potential closer relationship to M. muntjak than to any other muntjac. The predominant separate placement from all other
Muntiacusspp. is an interesting outcome that strengthens the species status ofM. atherodes. Several authors assumed the sympatric existence of a second muntjac species on Borneo that was separate fromM. muntjak (Kohlbrugge, 1895;Lyon Jr, 1911;Van Bemmel, 1952; Hill, 1960) beforeGroves & Grubb (1982)eventually establishedM. atherodesbased on a skin and the holotype skull sampled for the present study. The endemicM. atherodesdiffers fromM. muntjakin colouration and has smaller, simpler antlers, and the latter has a much wider distribution across Southeast Asia and Southern China (Groves & Grubb, 1982).
Though unsupported, the potential close systematic relationship ofM. atherodesandM. muntjakwould be logical based on the endemic occurrence ofM. atherodeson Borneo.M. atherodesandM. muntjak could have diverged from a common ancestor on Borneo via sympatric speciation and with a later invasion ofM. muntjakto the mainland.
Alternatively,M. muntjakcould have invaded Borneo during the sea level fluctuations in the Plio-Pleistocene (Voris, 2000;Meijaard, 2003;Woodruff, 2003;Meijaard & Groves, 2004;Bibi & Métais, 2016), resulting in the allopatric speciation ofM. atherodesand its isolation from the mainland populations during the end-Pleistocene sea level rise.
The high sea levels in the early Pliocene split the Thai-Malayan Peninsula into two landmasses, which separated Indochinese from Sundaic faunas (Woodruff, 2003). This most likely had a large influence on the evolution of Southeast Asian cervids and probably
occurred again later during the Pliocene (Meijaard & Groves, 2004). Sea level changes in the Malay Archipelago were important for faunal dispersals. Low sea levels allowed species to spread to landmasses, which would become islands with rising sea levels, resulting in isolation of populations.
Detailed descriptions and maps for sea level changes of Southeast Asia can be viewed in Voris (2000)andMeijaard (2003).
Rusa marianna
In the literature, there is a broad consensus about the systematic relationships within Cervini. However, the taxonomy ofCervuss. l. is indeed complicated (Randi et al., 2001). The controversy primarily concerns delimitations of genera and/or subgenera. Rusa,
Rucervus,Przewalskium (=Cervus)albirostris, and Cervus are occasionally treated as subgenera of the genusCervus, whereasAxis,Elaphurus, andDamaare normally treated as separate genera (Groves & Grubb, 1987;Randi et al., 2001). Here, we refer toRucervusand
Rusaas individual genera and refer toPrzewalskium albirostrisasCervus albirostris. The four species ofRusa,R. alfredi,R. marianna,R. timorensis,R. unicolor, inhabit India, Indochina and the Malay-Archipelago (Grubb & Groves, 1983;Mattioli, 2011).R. unicolor
is the largest oriental deer and has a highly fragmentary distribution from southern Nepal, India and Sri Lanka along the southern Himalayas through to mainland Southeast Asia and many of the Greater Sunda islands (Timmins et al., 2008;Leslie, 2011).R. timorensisis endemic to the Indonesian islands Bali and Java (Hedges et al., 2008).Rusa alfrediis one of the rarest deer species according to the IUCN Red List (IUCN, 2015) and is endemic to Panay and Negros (Western Visayan Islands, Central Philippines) (Oliver et al., 2008). In contrast, Rusa marianna is more widely distributed across most of the Philippine Islands, with the exceptions of the Negros-Panay, Sulu and Palawan Faunal Region, the Babuyan/Batanes groups, and other isolated islets (MacKinnon, Ong & Gonzales, 2008).
The four newly sequenced individuals ofRusa mariannaare positioned to be closely related to each other in a distinct clade. Two of the individuals are in a polytomy with the other Philippine species,Rusa alfredi, and two form a clade, which is a sister taxon to the polytomy (Fig. 4). Our topology supports the hypothesis that the two PhilippineRusa
species are closely related and are sister taxon toR. timorensisandR. unicolor.
Investigations byGrubb & Groves (1983)showed that interpreted relationships within
Rusaare controversial.Rusa timorensisandR. unicolor are sister taxa supported in all our topologies (Fig. 4,Figs. S1–S7), and this clade is in a polytomy with theCervus-clade (includingC. albirostris) and theR. alfredi-R. marianna-clade. A close relationship between
RusaandC. albirostriswas already suggested byFlerov (1952)based on morphological evidence and a supposed divergence ofC. albirostrisfromRusain the Late Pliocene.
The evident phenotypic separation of spotted (R. alfredi) and non-spotted (R. marianna)
Rusadeer on the Philippines suggests two invasion events (Grubb & Groves, 1983), but the missing molecular data forR. mariannahave prohibited further explanations.Grubb & Groves (1983)suggested a Southeast Asian mainland common ancestor from which a peripheral population diverged by evolving into R. timorensis. Later, a population of those colonised the Philippines twice at early and later stages in diversification, evolving
intoR. alfrediandR. marianna.R. unicolor evolved there but failed a third colonisation on additional Philippine Islands and dispersed northwards to the mainland. Meijaard & Groves (2004)pointed to the likely high impact of Plio-Peistocene sea level fluctuations on Southeast Asian cervid dispersal and speciation.
However, the suggested speciation ofR. mariannaandR. alfrediis not clearly evident from our topologies, whereR. alfrediappears to be a subgroup ofR. mariannarather than a sister taxon. More data are needed to unambiguously solve their relationships.
Odocoileini
Odocoileini represents the most controversial subclade of extant cervids. They consistently split into two subclades in both our current results and previously published phylogenetic trees. For these two subclades we established the new subtribes Blastocerina and Odocoileina (see above). However, within each of these subclades, systematic relationships are not yet solved. The recent divergence of modern neotropical Odocoileini from extinct Eurasian Capreolinae and related insufficient genomic diversity available to solve systematic relationships could be the reason (Vislobokova, 1980). All genera except forOdocoileusare endemic to South America, and their ancestors reached the continent via the Panamanian Isthmus in the Pliocene (5–2.5 million years ago) (Webb, 2000; Gilbert, Ropiquet & Hassanin, 2006). The first fossil appearances are known from no longer than approximately 2.4 million years ago (Webb, 2000). The consistent split of Blastocerina and Odocoileina potentially represents an asynchronous dispersal history via two invasion events.
Furthermore, our study revealed dubious relationships between availableHippocamelus
sequences. All of our topologies (Fig. 4,Figs. S2–S7) show that twoH. antisensissequences (H. antisensis 1;JN632646, NC_020711 (Hassanin et al., 2012)) are a sister taxon to
H. bisulcus. However, the other two sequences (H. antisensis 2; DQ379307 (Gilbert, Ropiquet & Hassanin, 2006) andGU190862(Fuentes-Hurtado et al., 2011)), are a sister taxon toOzotocerosin all of our topologies (Fig. 4,Figs. S2–S7). This is a critical issue, although its resolution is beyond the scope of this study; however, we found it important to point to this drawback in the base data and suggest re-confirmation of all four sequences.
Systematics of the two dwarfed genera,MazamaandPudu, whose small body size and simplified antlers are interpreted as secondary adaptations to dense vegetation (Geist, 1998; Mattioli, 2011), are particularly uncertain. Their habitat use and their decline in individual numbers makes it increasingly difficult to obtain enough data to resolve systematic issues from some of the species (see below).
Pudu
Pudus are the smallest living deer (25 to 40 cm shoulder height) and the smallest New World hoofed mammals (Hershkovitz, 1982;Mattioli, 2011). It is difficult to distinguish bothpudu
species from sympatric small deer species (Mazama) based only on the phenotype, without direct comparison (Hershkovitz, 1982;Jiménez, 2011).PuduandMazamalikely represent divergent lineages of small odocoilein deer (Hershkovitz, 1982). Although the origin of pudus is unknown,Hershkovitz (1982)stated thatP. mephistophileshas more primitive phenotypical features thanP. puda.
Pudu was assumed to be polyphyletic (Hassanin et al., 2012). WhereasP. puda has been well-sampled and studied, information for P. mephistophiles is scarce. In all of our topologies (Fig. 4, Figs. S1–S7), the four newly sequenced specimens of Pudu mephistophiles, including the holotype, form a well-supported clade. However, the position of that clade is variable. In four topologies (BI-1140-unpart, BI-747-part, BI-747-unpart, BI-569-unpart; Fig. 4, Figs. S2,S5, S6andS7), the clade is a sister taxon to all other Odocoileini and Rangiferini; in one topology (ML-1140; Fig. S4), it is a sister taxon to all Blastocerina with poor support; and in one topology (BI-1140-part;Fig. 3C,Fig. S3), it is placed in an unresolved position with other Odocoileini clades and Rangiferini. The placement of the individualPudu mephistophilesspecimen published prior to our study in Hassanin et al. (2012)(JN632691) is not close to theP. mephistophiles-clade in our topologies. Instead, it is placed as a sister taxon toMazama rufina(Fig. 4,Figs. S1–S7) and confirms Hassanin et al.’s (2012) suspicion that it might in fact be a misidentified
Mazama rufina and is neglected for further interpretation. The holotype specimen included in the four newP. mephistophiles samples substantiates that suspicion. In all but one topology (BI-569-unpart),P. pudais a sister taxon to all other Blastocerina, which is congruent withHassanin et al. (2012)andAgnarsson & May-Collado (2008). InDuarte, González & Maldonado (2008), however, its position was unresolved. The placement of
P. mephistophilesseparate from its congenericP. pudain most topologies suggests polyphyly of the genus.
Mazama
The genusMazamacomprises several species of small- to medium-sized deer (40 to 80 cm shoulder height) (Hershkovitz, 1959;Hershkovitz, 1982;Mattioli, 2011). The current distribution of Mazamaranges from Southern Mexico to Argentina (IUCN Red List, Mattioli, 2011;González et al., 2009).
Since the first description of Mazama pitaRafinesque, 1817(=Moschus americanus Erxleben, 1777), the genus has been subject to taxonomic controversies.Allen (1915) recognised 18 species of Mazama;Cabrera (1960) reduced these to four species, i.e.,
M. chunyi, M. gouazoubira,M. nana, and M. rufina. Czernay (1987) established two more species,M. americanaandM. bricenii, whereasGroves & Grubb (1987)considered
M. temamaa possible separate species based on cytogenetic differences.Medellín, Gardner & Marelo Aranda (1998)revisedM. pandoraas a separate species based on differences in the skulls and skins.Rossi (2000)establishedM. nemorivagaas a fourth sympatric species in Brazil (together withM. americana,M. nana,M. gouazoubira).Duarte (1992)described
M. bororo based on karyotype differences, which adds up to tenMazamaspecies being widely accepted today (IUCN Red List, Mattioli, 2011; González et al., 2009). More recently,Abril & Duarte (2008)recognised only eight species (M. americana,M. bororo,
M. chunyi,M. gouazoubira,M. nana,M. nemorivaga,M. pandora, andM. rufina), whereas Groves & Grubb (2011)listed 24 different species ofMazama. Most of the species share phe-notypic similarities, which makes their discrimination almost impossible; however, there are differences in overall body size, coat colour, and/or karyotype (González et al., 2009).
Recently, polyphyly of Mazama was observed (Duarte, González & Maldonado, 2008;Hassanin et al., 2012). Within Odocoileina,Duarte, González & Maldonado (2008) found a separation of the genus into a mixed Mazama americana-clade that included
M. bororo and M. nana. M. americana appeared polyphyletic because there was an additional clade consisting exclusively ofM. americana as a sister taxon toOdocoileus
and the mixed M. americana-clade (Duarte, González & Maldonado, 2008).Hassanin et al. (2012) found M. americanato be monophyletic and a sister taxon to Odocoileus.
M. rufinais a sister taxon to theMazama-Odocoileus-clade (Hassanin et al., 2012). Within Blastocerina there were two clades: a Mazama gouazoubira-clade and a
M. nemorivaga-clade. Their position varies from study to study (Agnarsson & May-Collado, 2008;Duarte, González & Maldonado, 2008;Hassanin et al., 2012).
In our topologies, within Odocoileina, the mixed Mazama americana-clade that includes the sequences indicated as M. americana1–3 is supported (Fig. 4) and has the most stable position, forming the sister taxon to the Odocoileus-clade. The pure
M. americana-clade found byDuarte, González & Maldonado (2008) is represented in our topology by the sequences indicated asM. americana4 andM. americana5.
M. rufinais nested within Odocoileina and is a sister taxon to theMazama-Odocoileus -clade (BI-1140-unpart, BI-1140-part, ML-1140;Figs. 3and4,Figs. S2,S3andS4) or is placed in resolved or unresolved positions outside Odocoileina but within Odocoileini (BI-747-unpart, BI-747-part, BI-569-unpart;Fig. 3,Figs. S5,S6andS7).
M. gouazoubirais either a sister taxon to bothHippocamelusspecies (BI-747-unpart, BI-569-unpart;Fig. 4,Figs. S5andS7), orBlastocerusis placed betweenHippocamelusand
M. gouazoubira.M. gouazoubiraitself is polyphyletic in our topologies (Fig. 4), and a re-confirmation of theM. gouzoubira2 sequence (DQ379308(Gilbert, Ropiquet & Hassanin, 2006)) is suggested.
Finally, theM. nemorivaga-clade is mostly nested within Blastocerina or is placed unresolved within Odocoileini (BI-747-part, BI-569-unpart).
In our study,M. temamaandM. pandorawere included in a species-rich phylogenetic analysis of cervids with palaearctic and neotropical species for the first time. Similarly to recent results ofEscobedo-Morales et al., 2016, our results show thatM. temamais always within Odocoileina as a sister taxon to the mixedM. americana-clade. InEscobedo-Morales et al., 2016and in our topologies,M. pandorais consistently placed within Odocoileina as a sister taxon toOdocoileus.
This also indicates a critical issue concerning the dispersal history of South American cervids. The placement of theM. americana-splits inFig. 4can be alternatively interpreted as a paraphyletic M. americana-clade, within which all other species are nested, i.e.,
Odocoileussp.,M. pandora,M. temama,M. nana, andM. bororo. However, the placement ofM. temamadisrupts the continuous genealogy ofM. americana. Together with the clade consisting ofM. rufinaandM. bricenii(see below), Odocoileina is basically aMazama-clade, within whichOdocoileusdiverged andMazamadiversified into several species. This scenario would strongly question the long-held assumption thatOdocoileuswas the first cervid to immigrate to South America and diversify into the extant South American species (Anderson & Wallmo, 1984;Smith, 1991;Geist, 1998) (see alsoEscobedo-Morales et al., 2016).
Our results from sequencing M. chunyi show a sister taxon relationship with
M. gouazoubirawithin Blastocerina in all our topologies (Fig. 4). The newly sequenced
Mazama briceniispecimens are always placed in a sister taxon position toM. rufinain our topologies but exist as a monophyletic group in only one topology (BI-569-unpart;Fig. 3,
Fig. S7).
In two topologies, the specimen BMNH 1908.6.24.5 is placed isolated from the other two specimens (BMNH 1913.4.24.3, BMNH 1934.9.10.228), which remain sister taxa to
M. rufina. Specifically, in one topology, BMNH 1908.6.24.5 is in an unresolved position within Odocoileina (BI-747-part;Fig. 3,Fig. S6) and is positioned as a sister taxon toM. chunyiin the other topology (BI-1140-part;Fig. 3,Fig. S3).
Mattioli (2011)listedM. briceniiandM. chunyias subspecies ofM. rufina. TheMazama briceniispecimen BMNH 1934.9.10.228 was originally assigned toM. rufina. Additionally, its sampling locality in Ecuador is outside the assumed current distribution ofM. bricenii
(Fig. 2andTable 2) and thus makes the revised affiliation toM. briceniiquestionable.
M. briceniiis scarcely distributed in Northeast Colombia and West Venezuela, whereas
M. rufinais distributed along the Andes from central Colombia to Ecuador and North Peru (Weber & González, 2003;Lizcano, Álvarez & Delgado-V, 2010). This distribution is intermediate between the distribution ofM. briceniiandM. chunyi. The latter is certainly known from South Peru and North Bolivia based on isolated museum specimen localities and rare sightings in the wild. Equally scarce is information on the biology and ecology of these species (Rumiz & Pardo, 2010). The results of the most recent study on systematic relationships ofM. briceniibased onCytbconfirm our results and suggest thatM. bricenii
is a junior synonym ofM. rufina(Gutiérrez et al., 2015).
Despite the extensive taxonomic and phylogenetic interest in the genusMazamadue to unsolved questions, the taxon remains enigmatic (e.g.,Duarte & Merino, 1997;Medellín, Gardner & Marelo Aranda, 1998;Duarte & Jorge, 2003;Weber & González, 2003;Duarte, González & Maldonado, 2008;González et al., 2009). In particular, the high intraspecific variability in M. americana and M. gouazoubira stimulated additional taxonomic and genetic research on the genus (see Weber & González, 2003). The systematics of
M. americanais particularly problematic because even the species appears polyphyletic with possible cryptic species (Duarte, González & Maldonado, 2008; Abril et al., 2010). Abril et al. (2010)showed thatM. americanaexhibits an extensive karyotype variation and found two distinct clades withinM. americanasampled across Brazil. They also found that one clade is more closely related toM. bororoandM. nana, presumably corresponding toM. americana1–3 in our topology, than to the second (pure) clade ofM. americana
(Fig. 4). Additionally, the genetic distance between theM. americana-clades was higher
than that between M. nanaandM. bororo. This suggests two separation events in the two lineages of M. americana(Abril et al., 2010). There is the potential that even more species are hidden in both theM. americana-complex and theM. gouazoubira-complex (Weber & González, 2003). Cytogenetics seems to be the most reliable technique for distinguishing between sympatric species (Vogliotti & Duarte, 2009). Much more data and thorough research onMazamaare needed to shed additional light on their complex systematic relationships.
CONCLUSION
The taxonomically most extensive molecular phylogenetic data set for cervids compiled to date enabled us to undertake phylogenetic analyses to answer and test the initial questions and hypotheses: (1)Mazama briceniiis closely related toM. rufinaand is more closely related to the M. americana-clade than to theM. gouazoubira-clade. However, from our topology, we infer that M. rufinais a subclade ofM. bricenii. It cannot be excluded that these two taxa may represent the same species withM. rufinaas the senior synonym. Mazama chunyiforms a sister taxon relationship with M. gouazoubiraand can thus be assigned to the M. gouazoubira-clade. The discovery of a fifth clade (M. pandora) shows that the polyphyly and systematic relationships withinMazamaare even more complex than previously thought and remain a challenge to address in future research. (2)Muntiacus atherodesis supported to be a valid species distinct from other
Muntiacusspp. However, its systematic position cannot be resolved with certainty, but the maximum likelihood analysis indicates that it might be more closely related to the sympatric
M. muntjak than to any other muntjac. (3) The Philippine rusine deerR. mariannaand
R. alfrediform a monophyletic clade and are sister taxon to a clade containing the other rusine deer, R. timorensisandR. unicolor and to theCervus-clade. Our results indicate that R. alfredi forms a subclade of R. mariannarather than its sister taxon. (4) The genusPuduappears to be polyphyletic, withP. pudanested within the Blastocerina and
P. mephistophiles, thereby forming a monophyletic group in a yet-unresolved position. Based on our topologies and previous work, we established here the new subtribes Blastocerina and Odocoileina, which form Odocoileini. A revision of the current taxonomy based on comparison of phenotypic and genotypic traits is desirable for future research on cervid systematics.
ACKNOWLEDGEMENTS
We thank Richard Sabin at the Natural History Museum London (BMNH) for providing access to the collections and permission to sample from specimens, including type material, and Tracy Heath (BMNH) for mailing the samples to Munich. We are grateful to Frieder Mayer for permission to sample all requested specimens at the Museum für Naturkunde in Berlin (ZMB) and Nora Lange for sampling the specimens and mailing the samples. We thank Gabriele Büttner for assistance with laboratory work. We also thank Frank Zachos, Robert Asher and two anonymous reviewers for their constructive comments on the manuscript.
ADDITIONAL INFORMATION AND DECLARATIONS
Funding
This study was funded by the German Research Foundation (DFG) RO 1197/7-1. Additionally, NS Heckeberg was funded by the German Academic Exchange Service (DAAD) D/11/42358 and the Elitenetzwerk Bayern. The funders had no role in study design, data collection and analysis, decision to publish, or preparation of the manuscript.
Grant Disclosures
The following grant information was disclosed by the authors: German Research Foundation: RO 1197/7-1.
German Academic Exchange Service: D/11/42358. Elitenetzwerk Bayern.
Competing Interests
The authors declare there are no competing interests.
Author Contributions
• Nicola S. Heckeberg conceived and designed the experiments, performed the
experiments, analyzed the data, wrote the paper, prepared figures and/or tables, reviewed drafts of the paper.
• Dirk Erpenbeck, Gert Wörheide and Gertrud E. Rössner conceived and designed the
experiments, contributed reagents/materials/analysis tools, wrote the paper, reviewed drafts of the paper.
DNA Deposition
The following information was supplied regarding the deposition of DNA sequences: European Nucleotide Archive:LT546647–LT546659.
Data Availability
The following information was supplied regarding data availability:
All alignments and analyses information are deposited at Open Data LMU
doi:10.5282/ubm/data.96.
Supplemental Information
Supplemental information for this article can be found online athttp://dx.doi.org/10.7717/
peerj.2307#supplemental-information.
REFERENCES
Abril VV, Carnelossi EAG, González S, Duarte JMB. 2010.Elucidating the Evolution
of the red brocket deerMazama americanacomplex (Artiodactyla; Cervidae).
Cytogenetic Genome Research128:177–187 DOI 10.1159/000298819.
Abril VV, Duarte JMB. 2008.Chromosome polymorphism in the Brazilian dwarf
brocket deer,Mazama nana(Mammalia, Cervidae).Genetics and Molecular Biology
31(1):53–57.
Agnarsson I, May-Collado LJ. 2008.The phylogeny of Cetartiodactyla: the importance
of dense taxon sampling, missing data, and the remarkable promise of cytochrome b to provide reliable species-level phylogenies.Molecular Phylogenetics and Evolution
48:964–985DOI 10.1016/j.ympev.2008.05.046.
Allen GM. 1915.Notes on American deer of the genusMazama.Bulletin American
Museum of Natural History 34:521–553.
Anderson AE, Wallmo OC. 1984.Odocoileus hemionus.Mammalian Species219:1–9.
Bibi F. 2014.Assembling the ruminant tree: combining morphology, molecules, extant taxa, and fossils.Zitteliana B32:197–211.
Bibi F, Métais G. 2016. Evolutionary history of the large herbivorous of south and
southeast Asia (Indomalayan Realm). In: Areshtani FS, Sankaran M, eds.The ecology of large herbivores in south and southeast Asia. Dordrecht, Heidelberg, Berlin: Springer, 15–88.
Briggs AW, Stenzel U, Johnson P, Green RE, Kelso J, Prüfer K, Meyer M, Krause J,
Ronan MT, Lachmann M, Pääbo S. 2007.Patterns of damage in genomic DNA
sequences from a Neandertal.Proceedings of the National Academy of Sciences of the United States of America104(37):14616–14621DOI 10.1073/pnas.0704665104.
Briggs AW, Stenzel U, Meyer M, Krause J, Kircher M, Pääbo S. 2010.Removal of
deaminated cytosines and detection ofin vivomethylation in ancient DNA.Nucleic Acids Research38(6):e87DOI 10.1093/nar/gkp1163.
Brooke V. 1878.On the classification of the Cervidae, with a synopsis of the existing
species.Proceedings of the Zoological Society of London1878:883–928.
Cabrera A. 1960.Catálogo de los mamíferos de América del Sur.Revista Museo Argentino
Bernardino Rivadavia4:309–732.
Croitor R. 2014.Deer from Late Miocene to Pleistocene from Western Palearctic:
matching fossil record and molecular phylogeny data.Zitteliana B32:115-153.
Czernay S. 1987.Die Spiesshirsche und Pudus. Die neue Brehm-Büchereí 581. Wittenberg
Lutherstadt: Ziemsen Verlag.
Duarte JMB. 1992.Aspectos taxonômicos e citogenéticos de algumas espécies de
cervídeos brasileiros. MSc Thesis, Faculdade de Ciências Agrárias e Veterinárias, Universidade Estadual Paulista, Jaboticabal, Brazil.
Duarte JMB, González S, Maldonado JE. 2008.The surprising evolutionary history
of South American deer.Molecular Phylogenetics and Evolution49(1):17–22
DOI 10.1016/j.ympev.2008.07.009.
Duarte JMB, Jorge W. 2003.Morphologic and Cytogenetic Description of the small
red brocket (Mazama bororoDuarte,1996) in Brazil.Mammalia67(3):403–410
DOI 10.1515/mamm.2003.67.3.403.
Duarte JMB, Merino ML. 1997. Taxonomia e evolu¸cão. In: Duarte JMB, ed.Biologia
e conserva¸cão de cervídeos Sul-Americanos: Blastocerus, Ozotoceros e Mazama.
Jaboticabal: Fundacao de Estudos e Pesquisas em Agronomia, Medicina Veterinária e Zootecnia, 2–21.
Duckworth JW, Robichaud WG, Timmins RJ. 2008.Rucervus schomburgki. The IUCN
red list of threatened species. Version 2014.3.Available atwww.iucnredlist.org (accessed on 17 April 2015).
Erxleben JCP. 1777. Systema regni animalis per classes, ordines, genera, species, varietates,
cum synonymia et historia animalium. Classis I. Mammalia. Weygandianis, Lipsiae, 636 pp.
Escobedo-Morales LA, Mandujano S, Eguiarte LE, Rodriguez-Rodriguez MA,
Maldon-ado JE. 2016.First phylogenetic analysis of Mesoamerican brocket deerMazama
pandoraandMazama temama(Cetartiodactyla: Cervidae) based on mitochondrial