Article
Clinical Implications of Various Criteria for the
Biochemical Diagnosis of Insulinoma
Chang Ho Ahn, Lee-Kyung Kim, Jie Eun Lee, Chan-Hyeon Jung, Se-Hee Min, Kyong Soo Park, Seong Yeon Kim, Young Min Cho
Department of Internal Medicine, Seoul National University College of Medicine, Seoul, Korea
Background: Among the various diagnostic criteria for insulinoma, the ratio criteria have been controversial. However, the amended insulin-glucose ratio exhibited excellent diagnostic performance in a recent retrospective cohort study, although it has not yet been validated in other patient cohorts. We examined the diagnostic performance of the current criteria of the Endocrine Society, insulin-glucose ratio, C-peptide-glucose ratio, and amended ratios in terms of differentiating insulinomas.
Methods: We reviewed the medical records of patients who underwent evaluation for hypoglycemia from 2000 to 2013. Four-teen patients with histopathologically confirmed insulinoma and 18 patients without clinical evidence of insulinoma were includ-ed. The results of a prolonged fast test were analyzed according to the abovementioned criteria.
Results: Fulfilling all three Endocrine Society criteria—plasma levels of glucose (<3.0 mmol/L), insulin (≥18 pmol/L), and
C-peptide (≥0.2 nmol/L)—exhibited 100% sensitivity and 89% specificity. Fulfilling the glucose and C-peptide criteria showed
100% sensitivity and 83% specificity, while fulfilling the glucose and insulin criteria showed 100% sensitivity and 72%
specifici-ty. Among the ratio criteria, the insulin-glucose ratio [>24.0 (pmol/L)/(mmol/L)] gave the highest area under the receiver
operat-ing characteristic curve, with 93% sensitivity and 94% specificity.
Conclusion: Fulfilling the glucose, insulin, and C-peptide criteria of the Endocrine Society guidelines exhibited the best diagnos-tic performance for insulinoma. Nonetheless, the insulin-glucose ratio may still have a role in the biochemical diagnosis of insuli-noma.
Keywords: Insulinoma; Diagnostic criteria; Insulin; C-peptide
INTRODUCTION
Although insulinoma is a rare endocrine disease, it is the most common cause of hypoglycemia in apparently healthy adults if factitious hypoglycemia is excluded [1]. Because insulinoma occurs in the pancreas in the majority of patients, the pancreas is the first place where it is sought [2]. For this purpose, comput-ed tomography (CT), magnetic resonance imaging, or
endo-scopic ultrasonography is performed, with insulinoma detec-tion rates of approximately 70% to 80%, 85%, and 90%, respec-tively [1,3]. Even when insulinoma is not detected by imaging studies, the pancreas can be surgically explored if there is a strong clinical suspicion of insulinoma, or an invasive study, such as selective pancreatic arterial calcium injection with hepatic ve-nous sampling, can be performed to identify pancreatogeve-nous hypoglycemia before surgical exploration [2]. It is, therefore,
Received: 12 March 2014, Revised: 6 May 2014, Accepted: 2 June 2014
Corresponding author: Young Min Cho
Department of Internal Medicine, Seoul National University College of Medicine, 101 Daehak-ro, Jongno-gu, Seoul 110-744, Korea
Tel: +82-2-2072-1965, Fax: +82-2-762-9662, E-mail: ymchomd@snu.ac.kr
Copyright © 2014 Korean Endocrine Society
of paramount importance to diagnose insulinoma with bio-chemical methods.
The documentation of endogenous hyperinsulinemic hypo-glycemia is essential for the biochemical diagnosis of insulino-ma. A prolonged fast test of up to 72 hours is considered the standard test to document this condition when a spontaneous hypoglycemic event is not observed [4]. The Endocrine Society Clinical Practice Guidelines (ESCPG) for adult hypoglycemic disorders define endogenous hyperinsulinemic hypoglycemia as symptoms and signs of hypoglycemia with a plasma glucose
level of <3.0 mmol/L (55 mg/dL), an insulin level of ≥18
pmol/L (3.0 μU/mL), a C-peptide level of ≥0.2 nmol/L (0.6 ng/
mL), and a proinsulin level of ≥5.0 pmol/L [1]. In addition, a
glucagon stimulation test is recommended to reveal preserva-tion of hepatic glycogen stores, which is mediated by the acpreserva-tion of excess insulin or IGF-1 [1]. However, this definition has been criticized for not being clear regarding how many of these crite-ria should be met to confirm the diagnosis [5]. Each criterion of the ESCPG showed consistently high sensitivity of 90% to 100% but variable specificity in different studies [4-6]. Three recent studies that analyzed the diagnostic performance of the current criteria in cohorts including both patients and controls reported that the plasma insulin criteria had specificities of 15%, 19%, and 95% [4-6]. The diagnostic performance varies among populations and insulin and C-peptide assays. The ESCPG also stated that the insulin-glucose ratio has no diagnostic value for differentiating endogenous hyperinsulinism [1]. However, some experts still endorse use of the insulin-glucose ratio for diagno-sis of insulinoma, because it reflects the effect of glucose con-centration on insulin secretion [5,7,8].
Intriguingly, a retrospective German study reported that the amended insulin-glucose ratio exhibited excellent diagnostic value, with 98% sensitivity and 98% specificity, in insulinomas in 114 subjects who underwent the prolonged fast test for the evaluation of hypoglycemia [5]. The amended insulin-glucose ratio is the ratio of the plasma insulin concentration to the plas-ma glucose concentration minus 1.7 mmol/L. The subtraction of 1.7 mmol/L is based on the assumption that a negligible amount of insulin is secreted at plasma glucose concentrations below 1.7 mmol/L [9]. This ratio has a negative or infinite val-ue when the plasma glucose level is below or exactly 1.7 mmol/L. In these cases, in the German study [5], a value of 100 was assigned for the amended insulin-glucose ratio (personal communication with Nauck MA). However, the diagnostic ac-curacy of the amended insulin-glucose ratio has not yet been validated in other patient cohorts. To address this, we evaluated
the diagnostic performance of the current biochemical criteria of the ESCPG, insulin-glucose ratio, C-peptide-glucose ratio, amended insulin-glucose ratio, and amended C-peptide-glu-cose ratio for insulinomas.
METHODS
Study design and subjects
We reviewed the medical records of all consecutive patients who did not have diabetes but who presented with hypoglyce-mia at Seoul National University Hospital from January 1, 2000 to January 31, 2013. Patients with results for the prolonged fast test were identified and included in the analysis. The insulinoma group was defined as patients with histopathologically con-firmed insulinomas. The noninsulinoma group was defined as patients who had no clinical evidence of insulinoma. No patient had abnormal liver or renal function. This study protocol was approved by the Institutional Review Board at Seoul National University Hospital (registration number: 1307-113-506).
The prolonged fast test
Patients fasted under the supervision of health care profession-als. Capillary plasma glucose level was measured with a glu-cometer (OneTouch SureStep Hospital Meter, LifeScan, Milpi-tas, CA, USA) every 2 hours. When hypoglycemic symptoms developed or the capillary plasma glucose levels decreased to 3.3 mmol/L, we checked the capillary plasma glucose level on an hourly basis. The fasting test was terminated when one of the following conditions was met: (1) hypoglycemic symptoms
were present and the capillary plasma glucose level was <2.5
mmol/L; (2) intolerable hypoglycemic symptoms occurred; (3) no hypoglycemic symptoms were present, but the capillary
plasma glucose level was <2.5 mmol/L and the plasma glucose
level was checked immediately and verified to be <2.5 mmol/
L; and (4) 72 hours had elapsed since the last meal. At the time of discontinuation, venous blood was drawn for measurement of plasma glucose, insulin, and C-peptide levels. The capillary blood glucose level was only used to assist the decision to dis-continue the test. Plasma glucose level, measured by laboratory determination, was used to differentiate insulinomas.
Glucose, insulin, and C-peptide measurement
were provided by DIAsource (Brussels, Belgium; formerly BioSource) for 26 patients from January 2000 to April 2010, TFB (Tokyo, Japan) for five patients from April 2010 to April 2012, and IZOTOP (Budapest, Hungary) for one patient from April 2012 to January 2013. The detection limit was 7.4 pmol/
L (1 μU/mL) for the DIAsource assay and 3.6 pmol/L (0.6 μU/
mL) for the IZOTOP assay. Cross-reactivity with human proin-sulin was 0.3% for the DIAsource assay, 0.3% for the TFB as-say, and 40.0% for the IZOTOP assay. The C-peptide assays were provided by TFB (Tokyo, Japan) for 26 patients from January 2000 to April 2010 and IZOTOP (Budapest, Hungary) and for six patients from April 2010 to January 2013. The de-tection limit was 0.033 nmol/L (0.1 ng/mL) for the TFB assay and 0.0332 nmol/L (0.105 ng/mL) for the IZOTOP assay. Cross-reactivity with human proinsulin was 25.4% for the TFB assay and 27.1% for the IZOTOP assay.
Biochemical criteria
The insulin, C-peptide, and glucose levels at the end of the prolonged fast test were used for the biochemical diagnosis of insulinoma. The ESCPG criteria were applied, and diagnostic performance was analyzed for each component of the criteria and by determining the number of criteria met. We measured the diagnostic performance of each ratio based on the cut off values from previous studies and also based on new cutoff values derived from our current data (those with the highest Youden index [sensitivity+specificity–1]). The cutoff values from previous studies were 32.2 (pmol/L)/(mmol/L) for the insulin-glucose ratio [5,7,8], 53.6 (pmol/L)/(mmol/L) peptide-glucose ratio, and 0.61 (nmol/L)/(mmol/L) for the amended C-peptide-glucose ratio [5]. The amended insulin-glucose ratio is insulin (pmol/L)/[glucose (mmol/L)–1.7 nmol/L] and the amended C-peptide-glucose ratio is C-peptide (nmol/L)/[glu-cose (mmol/L)–1.7 nmol/L]. When the plasma glu(nmol/L)/[glu-cose level
was ≤1.7 mmol/L, we imputed 0.1 mmol/L for the
denomina-tor of the amended ratios to avoid generation of a negative or infinite value.
Statistical analysis
We present the results for continuous variables as means and
standard deviations or 95% confidence intervals. Fisher exact
test and the Mann-Whitney U test were used to compare the two
groups. Area under the receiver operating characteristic (ROC) curve, sensitivity, specificity, positive predictive value, and negative predictive value were calculated for each diagnostic criterion. Statistical analysis was performed using SPSS
ver-sion 18.0 (IBM Co., Armonk, NY, USA) and R verver-sion 3.0.1 (R Foundation for Statistical Computing, Vienna, Austria).
RESULTS
Thirty-nine patients who presented with hypoglycemia during the study period underwent the prolonged fast test. Of these patients, seven were excluded for the following reasons: no
follow-up data (n=2), insulin autoantibody syndrome (n=1),
and no available insulin data (n=4). Fourteen patients with
histopathologically confirmed insulinoma and eighteen pa-tients with no clinical evidence of insulinoma during a mean
follow-up of 47.4±43.0 months were finally included.
Clinical characteristics
The mean size of the tumors was 1.6±0.5 cm. Tumors were
located at the head (n=7), body (n=3), and tail (n=4) of the
pancreas. Preoperative localization was done with CT scans at
the time of presentation (n=12), a follow-up CT scan after 1
year (n=1), or selective pancreatic arterial calcium injection
with hepatic venous sampling (n=1).
In the noninsulinoma group, six patients were diagnosed with reactive hypoglycemia after a mixed meal test; two pa-tients were diagnosed with factitious hypoglycemia caused by erroneously taken sulfonylurea. In two patients, hypoglycemia was associated with either a herbal medication or an unknown diet pill. In the remaining eight patients, the possible cause of hypoglycemia was not identified.
Compared to the noninsulinoma group, BMI was
signifi-cantly higher (26.7±3.4 kg/m2
vs. 22.7±4.2 kg/m2
, P=0.003)
and hemoglobin A1c was significantly lower (4.8%±0.2% vs.
5.7%±0.5%, P<0.001) in the insulinoma group. The
propor-tion of patients who presented with neuroglycopenic symptoms such as loss of consciousness, seizure, and confusion was not significantly different between the insulinoma group and the
non-insulinoma group (78% vs. 56%, P=0.175) (Table 1).
Prolonged fast test
Most of the insulinoma patients (n=13, 93%) discontinued the
prolonged fast test because their glucose level was below 2.5
mmol/L, whereas most of the noninsulinoma patients (n=11,
Diagnostic performance of each criterion
We compared the plasma insulin, C-peptide, and glucose levels at the end of the prolonged fast test. The mean plasma glucose level was significantly lower in the insulinoma group than in the
noninsulinoma group (2.07±0.58 mmol/L vs. 3.34±0.89 mmol/
L, P<0.001). The mean insulin and C-peptide levels were
sig-nificantly higher in the insulinoma group than in the
non-insulin-oma group (123.3±79.9 pmol/L vs. 39.6±17.6 pmol/L, P<0.001
for insulin; 1.07±0.48 nmol/L vs. 0.28±0.35 nmol/L, P<0.001
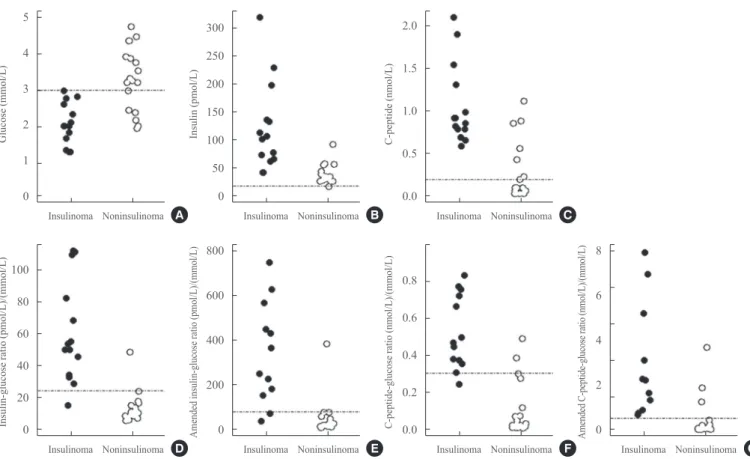
for C-peptide) (Table 1). However, the insulinoma and noninsu-linoma groups showed considerable overlap for each value (Fig. 2). All of the insulinoma patients met the plasma glucose
criteri-on (≤3.0 mmol/L) and six noninsulinoma patients (33%) also
met the plasma glucose criterion (Table 2).
On the basis of the ESCPG criteria, fulfilling the criteria for glucose, insulin, and C-peptide exhibited a sensitivity of 100% (95% confidence interval [CI], 73 to 100) and a specificity of 89% (95% CI, 64 to 98) (Table 2). Fulfilling the glucose and C-peptide criteria showed a sensitivity of 100% (95% CI, 73 to 100) and a specificity of 83% (95% CI, 58 to 96); fulfilling the glucose and insulin criteria showed a sensitivity of 100% (95% CI, 73 to 100) and a specificity of 72% (95% CI, 46 to 89). Among the ratio criteria, the insulin-glucose ratio demon-strated the highest area under the ROC curve (0.968; 95% CI, 0.918 to 1.00), although the difference compared to other ratio criteria was not statistically significant (Table 3) [10]. The cut-off value for insulglucose ratio with the highest Youden in-dex was 24.0 (pmol/L)/(mmol/L), lower than that in a previ-ous study [5]. Using this cutoff value, the sensitivity of the in-sulin-glucose ratio was 93% (95% CI, 64 to 100) and the speci-ficity was 94% (95% CI, 71 to 100). Although the insulin-glu-cose ratio showed the highest area under the ROC curve, other
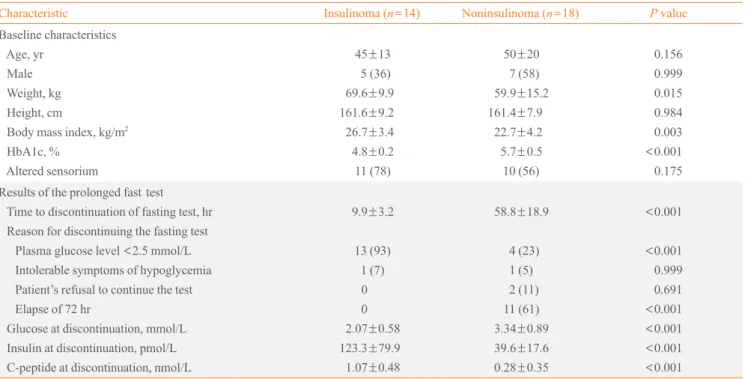
Table 1. Clinical Characteristics of the Patients
Characteristic Insulinoma (n=14) Noninsulinoma (n=18) P value
Baseline characteristics Age, yr
Male Weight, kg Height, cm
Body mass index, kg/m2
HbA1c, % Altered sensorium
45±13 5 (36) 69.6±9.9 161.6±9.2
26.7±3.4 4.8±0.2
11 (78)
50±20 7 (58) 59.9±15.2 161.4±7.9
22.7±4.2 5.7±0.5
10 (56)
0.156 0.999 0.015 0.984 0.003
<0.001
0.175
Results of the prolonged fast test Time to discontinuation of fasting test, hr Reason for discontinuing the fasting test Plasma glucose level <2.5 mmol/L Intolerable symptoms of hypoglycemia Patient’s refusal to continue the test Elapse of 72 hr
Glucose at discontinuation, mmol/L Insulin at discontinuation, pmol/L C-peptide at discontinuation, nmol/L
9.9±3.2
13 (93) 1 (7) 0 0 2.07±0.58 123.3±79.9
1.07±0.48
58.8±18.9
4 (23) 1 (5) 2 (11) 11 (61) 3.34±0.89 39.6±17.6
0.28±0.35
<0.001
<0.001
0.999 0.691
<0.001
<0.001
<0.001
<0.001
Values are expressed as mean±SD or number (%).
HbA1c, hemoglobin A1c.
1.0
0.8
0.6
0.4
0.2
0.0
Proportion continuin
g the test
End time of the prolonged fast test (hr)
0 10 20 30 40 50 60 70
Fig. 1. Proportion of patients by time to discontinuation of the prolonged fast test.
ratio criteria exhibited comparable sensitivity and specificity (Table 2).
DISCUSSION
In this study, we examined the diagnostic performances of various biochemical criteria for insulinomas. Among them, fulfilling the glucose, insulin, and C-peptide criteria of the ES-CPG demonstrated excellent sensitivity and specificity in dif-ferentiating insulinomas from other causes of spontaneous hy-poglycemia. Compared to simultaneously fulfilling the glu-cose, insulin, and C-peptide criteria of the ESCPG, each com-ponent of the ESCPG criteria, combined glucose and insulin criteria, and combined glucose and C-peptide criteria appeared to have less diagnostic value, with notably lower specificity. Among the ratio criteria, insulin-glucose ratio had the highest area under the ROC curve and exhibited a fair diagnostic per-formance, with both sensitivity and specificity over 90%.
Therefore, insulin-glucose ratio can perhaps still be used as a clinical indicator in the differential diagnosis of insulinomas. A recent German study rediscovered the diagnostic value of the amended insulin-glucose ratio for the biochemical diagno-sis of insulinomas [5]. However, in our study, the diagnostic performances of the various amended ratios were not superior to those of simple ratios in terms of sensitivity and specificity. Although our study evaluated a limited number of patients, we found no good reason to use the amended insulin-glucose ratio instead of the simple insulin-glucose ratio. In addition, as we previously indicated, calculating amended insulin-glucose ra-tio is tricky when the plasma glucose level is less than or equal to 1.7 mmol/L.
Fasting for 3 days is a major inconvenience and hardship for patients undergoing evaluation of hypoglycemia. In 170 pa-tients operated on for insulinoma who underwent prolonged fasts according to a standard protocol at the Mayo Clinic, it was reported that the fast was terminated within 12 hours in 5
4
3
2
1
0
100
80
60
40
20
0
300
250
200
150
100
50
0
800
600
400
200
0
2.0
1.5
1.0
0.5
0.0
0.8
0.6
0.4
0.2
0.0
8
6
4
2
0
Glucose (mmol/L)
Insulin-glucose
ratio
(pmol/L)/(mmol/L)
Insulin (pmol/L)
Amended insulin-glucose ratio (pmol/L)/(mmol/L)
C-peptide
(nmol/L)
C-peptide-glucose ratio (nmol/L)/(mmol/L)
Amended C-peptide-glucose ratio (nmol/L)/(mmol/L)
Insulinoma
Insulinoma
Insulinoma
Insulinoma
Insulinoma
Insulinoma Insulinoma Noninsulinoma
Noninsulinoma
Noninsulinoma
Noninsulinoma
Noninsulinoma
Noninsulinoma Noninsulinoma
Fig. 2. Distribution of glucose, insulin, C-peptide, insulin-glucose ratio, C-peptide-glucose ratio, amended insulin-glucose ratio, and amended C-peptide-glucose ratio at discontinuation of the prolonged fast test. Scatter plots show the distributions of plasma glucose (A), insulin (B), C-peptide (C), insulin-glucose ratio (D), amended insulin-glucose ratio (E), C-peptide-glucose ratio (F), and amended C-pep-tide-glucose ratio (G). Dashed lines indicate the cutoff value from the Endocrine Society Clinical Practice Guidelines (A-C) or the cutoff value showing the highest Youden index in the receiver operating characteristic curve analysis of our current data (D-G). Closed circles, in-sulinoma; open circles, noninsulinoma.
A
D
B
E
C
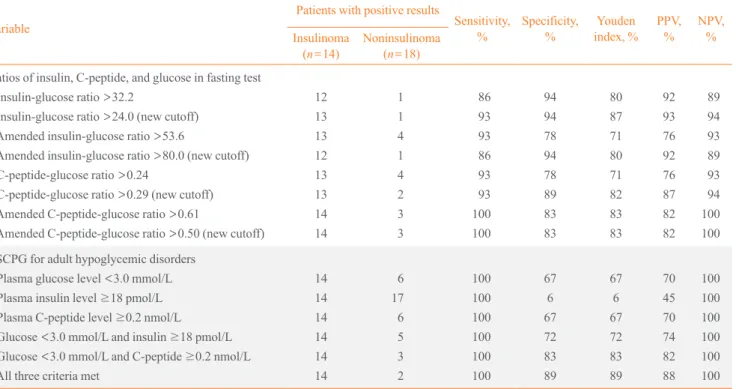
Table 2. Comparison of Diagnostic Performance for Differentiating Insulinomas from Other Causes of Spontaneous Hypoglycemia
Variable
Patients with positive results
Sensitivity, % Specificity, % Youden index, % PPV, % NPV, % Insulinoma
(n=14)
Noninsulinoma
(n=18)
Ratios of insulin, C-peptide, and glucose in fasting test Insulin-glucose ratio >32.2
Insulin-glucose ratio >24.0 (new cutoff)
Amended insulin-glucose ratio >53.6
Amended insulin-glucose ratio >80.0 (new cutoff)
C-peptide-glucose ratio >0.24
C-peptide-glucose ratio >0.29 (new cutoff)
Amended C-peptide-glucose ratio >0.61
Amended C-peptide-glucose ratio >0.50 (new cutoff)
12 13 13 12 13 13 14 14 1 1 4 1 4 2 3 3 86 93 93 86 93 93 100 100 94 94 78 94 78 89 83 83 80 87 71 80 71 82 83 83 92 93 76 92 76 87 82 82 89 94 93 89 93 94 100 100
ESCPG for adult hypoglycemic disorders Plasma glucose level <3.0 mmol/L
Plasma insulin level ≥18 pmol/L Plasma C-peptide level ≥0.2 nmol/L
Glucose <3.0 mmol/L and insulin ≥18 pmol/L
Glucose <3.0 mmol/L and C-peptide ≥0.2 nmol/L All three criteria met
14 14 14 14 14 14 6 17 6 5 3 2 100 100 100 100 100 100 67 6 67 72 83 89 67 6 67 72 83 89 70 45 70 74 82 88 100 100 100 100 100 100
Units for insulin-glucose ratio and amended insulin-glucose ratio: (pmol/L)/(mmol/L). Units for glucose ratio and amended C-peptide-glucose ratio: (nmol/L)/(mmol/L). Youden index=sensitivity+specificity–1.
PPV, positive predictive value; NPV, negative predictive value; ESCPG, Endocrine Society Clinical Practice Guideline.
Table 3. Area under the ROC Curve for Each Ratio Criterion
AUC for ROC (95% CI)
Insulin-glucose ratio 0.968 (0.918–1.000)
Amended insulin-glucose ratio 0.948 (0.878–1.000)
C-peptide-glucose ratio 0.944 (0.870–1.000)
Amended C-peptide-glucose ratio 0.937 (0.855–1.000)
Paired tests comparing any two ROC curves by the method described by DeLong et al. [10] showed no significant difference.
ROC, receiver operating characteristic; AUC, area under the curve; CI, confidence interval.
33% of patients, 24 hours in 65%, 36 hours in 84%, 48 hours in 93%, and 72 hours in 99% [11]. Therefore, the ESCPG recom-mend a prolonged fast test of up to 72 hours to evoke a hypo-glycemic episode [1]. However, all of the insulinoma patients ended the test within 48 hours in the abovementioned German study [5] and within 24 hours in our study. Although we cannot say that the duration of the prolonged fast test should be short-ened based on the limited number of cases in the current study, the fact that the majority of patients with insulinoma terminated
the test within 24 or 48 hours may help to guide patients who undergo evaluations for the causes of hypoglycemia.
Our study had several limitations. First, relatively few pa-tients were included in the analysis. Given the low incidence of insulinoma, there are limited numbers of insulinoma patients, even in a tertiary hospital like our institution. A prospective cohort of insulinoma patients with a standardized protocol is needed for more comprehensive analysis. Second, the insulin and C-peptide assays were changed during the study period. However, because the detection limits of the insulin and C-peptide assays were similar and most of the patients were test-ed with specific insulin assays that are not reactive to human proinsulin, the potential effect of using different assays is probably minor.
CONFLICTS OF INTEREST
No potential conflict of interest relevant to this article was re-ported.
REFERENCES
1. Cryer PE, Axelrod L, Grossman AB, Heller SR, Montori VM,
Seaquist ER, Service FJ; Endocrine Society. Evaluation and management of adult hypoglycemic disorders: an Endo-crine Society Clinical Practice Guideline. J Clin Endocrinol Metab 2009;94:709-28.
2. Grant CS. Insulinoma. Best Pract Res Clin Gastroenterol
2005;19:783-98.
3. McAuley G, Delaney H, Colville J, Lyburn I, Worsley D,
Govender P, Torreggiani WC. Multimodality preoperative imaging of pancreatic insulinomas. Clin Radiol 2005;60: 1039-50.
4. Placzkowski KA, Vella A, Thompson GB, Grant CS,
Read-ing CC, Charboneau JW, Andrews JC, Lloyd RV, Service FJ. Secular trends in the presentation and management of func-tioning insulinoma at the Mayo Clinic, 1987-2007. J Clin
Endocrinol Metab 2009;94:1069-73.
5. Nauck MA, Meier JJ. Diagnostic accuracy of an
“amend-ed” insulin-glucose ratio for the biochemical diagnosis of insulinomas. Ann Intern Med 2012;157:767-75.
6. Vezzosi D, Bennet A, Fauvel J, Caron P. Insulin, C-peptide
and proinsulin for the biochemical diagnosis of hypogly-caemia related to endogenous hyperinsulinism. Eur J Endo-crinol 2007;157:75-83.
7. Longo DL, Fauci AS, Kasper DL, Hauser SL, Jameson JL,
Loscalzo J. Harrison’s principles of internal medicine. 18th ed. New York: McGraw-Hill; 2012.
8. Gardner DG, Shoback DM. Greenspan’s basic and clinical
endocrinology. 9th ed. New York: McGraw-Hill; 2011.
9. Turner RC, Oakley NW, Nabarro JD. Control of basal
in-sulin secretion, with special reference to the diagnosis of insulinomas. Br Med J 1971;2:132-5.
10. DeLong ER, DeLong DM, Clarke-Pearson DL. Comparing
the areas under two or more correlated receiver operating characteristic curves: a nonparametric approach. Biomet-rics 1988;44:837-45.
11. Service FJ, Natt N. The prolonged fast. J Clin Endocrinol