Hemoglobin A1c for Diagnosis of Postpartum Abnormal
Glucose Tolerance among Women with Gestational
Diabetes Mellitus: Diagnostic Meta-Analysis
Xudong Su1., Zhaoyan Zhang2., Xinye Qu2
, Yaqiang Tian1, Guangzhen Zhang1*
1Department of Endocrinology, Liaocheng People’s Hospital, Liaocheng, China,2Department of Gynaecology and Obstetrics, Women and Children Hospital, Liaocheng, China
Abstract
Objective:To evaluate the accuracy of glycosylated hemoglobin A1c (HbA1c) for the diagnosis of postpartum abnormal glucose tolerance among women with gestational diabetes mellitus (GDM).
Methods:After a systematic review of related studies, the sensitivity, specificity, positive likelihood ratio (PLR), negative likelihood ratio (NLR), diagnostic odds ratio (DOR), and other measures about the accuracy of HbA1c in the diagnosis of postpartum abnormal glucose tolerance were pooled using random-effects models. The summary receiver operating characteristic (SROC) curve was used to summarize the overall test performance.
Results:Six studies met our inclusion criteria. The pooled results on SEN, SPE, PLR, NLR, and DOR were 0.36 (95% CI 0.23– 0.52), 0.85 (95% CI 0.73–0.92), 2.4 (95% CI 1.6–3.6), 0.75 (95% CI 0.63–0.88) and 3 (95% CI 2–5). The area under the summary receiver operating characteristic (SROC) curve was 0.67 with a Q value of 0.63.
Conclusions:Measurement of HbA1c alone is not a sensitive test to detect abnormal glucose tolerance in women with prior GDM.
Citation:Su X, Zhang Z, Qu X, Tian Y, Zhang G (2014) Hemoglobin A1c for Diagnosis of Postpartum Abnormal Glucose Tolerance among Women with Gestational Diabetes Mellitus: Diagnostic Meta-Analysis. PLoS ONE 9(7): e102144. doi:10.1371/journal.pone.0102144
Editor:Irun R. Cohen, Weizmann Institute of Science, Israel
ReceivedApril 23, 2014;AcceptedJune 14, 2014;PublishedJuly 11, 2014
Copyright:ß2014 Su et al. This is an open-access article distributed under the terms of the Creative Commons Attribution License, which permits unrestricted use, distribution, and reproduction in any medium, provided the original author and source are credited.
Data Availability:The authors confirm that all data underlying the findings are fully available without restriction. All relevant data are within the paper and its Supporting Information files.
Funding:The authors have no support or funding to report.
Competing Interests:The authors have declared that no competing interests exist.
* Email: [email protected]
.These authors contributed equally to this work.
Introduction
Gestational diabetes mellitus (GDM) is described as any degree of glucose intolerance with on set or first recognition during pregnancy [1]. Up to 60% of women with a history of GDM will develop type2 diabetes mellitus (DM) within 5–10 years postpar-tum [2]. It is recommended that women with a history of GDM undergo a 2-hour oral glucose tolerance test (OGTT) within six months following pregnancy, and, if this is normal, assay of fasting plasma glucose or OGTT should be performed every three years [1]. Unfortunately, the rates of Postpartum evaluation are low [3– 5]. HbA1c has been proposed as a diagnostic tool to identify people with undiagnosed diabetes, or who are at risk of diabetes [1]. HbA1c does not require fasting, it has better pre-analytical stability and reflects long-term glycaemic exposure better than current diagnostic tests based on fasting or post-load glucose measures. So using of HbA1c could improve postpartum testing rates for women with recent GDM. But the usefulness of HbA1c for the reassessment of carbohydrate metabolism status in postpartum women with a history of GDM remains controversial. The present meta-analysis was performed to establish the accuracy
of HbA1c for diagnosis of postpartum abnormal glucose tolerance among women with gestational diabetes mellitus.
Methods
Search strategy and study selection
MEDLINE and EMBASE databases were searched, using the terms (postpartum.mp) AND (Gestational diabetes mellitus.mp OR GDM.mp) AND (hba1c.mp OR hemoglobin.mp) from 1985 to February 2014. We also reviewed the Cochrane Library to find relevant articles. We contacted experts in the specialty, and searched the reference lists from primary and reviewed articles. Although no language restrictions were imposed initially, for the full-text review and final analysis our resources only permitted the review of articles published in English. Conference abstracts and letters to the journal editors were excluded because of the limited data presented in them.
dot-plot form, allowing test result to be extracted for individual study subject. Two reviewers (Z.Y.Z and X.D.S) independently judged study eligibility while screening the citations. Disagree-ments were resolved by consensus.
Data extraction and quality assessment
Data extraction was carried out independently by two authors (Z.Y.Z and X.D.S). Disagreements were resolved by discussion between the two reviewing authors. Data retrieved from the reports included the author, publication year, participant charac-teristics, cutoff value, true-positive (TP), negative (FN), false-positive (FP), and true-negative data (TN).
The methodological quality of selected papers was evaluated using QUADAS-2, a tool for the quality assessment of studies of diagnostic accuracy [6]. This checklist consists of four key domains: patient selection, index test, reference standard and flow and timing. Within each study, the domains are assessed in terms of risk of bias and the first three of these domains are assessed in terms of concerns about applicability. Signalling questions as specified in the QUADAS-2 tool enable the reviewer to give each domain a rating of high, low or unclear.
Statistical analysis
Standard methods recommended for meta-analyses of diagnos-tic test evaluations were used. The following measures of test accuracy were computed for each study: the sensitivity, specificity, positive likelihood ratio (PLR), negative likelihood ratio (NLR), and diagnostic odds ratio (DOR). The analysis was based on a summary receiver operating characteristic (SROC) curve [7]. The sensitivity and specificity for the single test threshold identified for each study were used to plot an SROC curve. A bivariate mixed effects model was used to calculate the average sensitivity, specificity, and the other measures across studies [8], and this analyses was performed using STATA version 12.0.
The heterogeneity of the results between studies was assessed statistically using the quantityI2, which describes the percentage of total variation across studies that is attributable to heterogeneity rather than chance [9]. Subgroup analyses was intended for investigation of operator experience and algorithm method however there was an insufficient number of studies. The relative
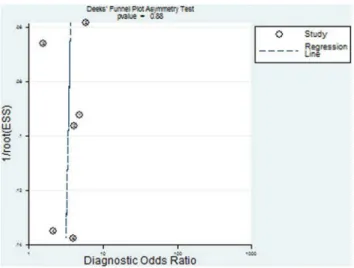
DOR (RDOR) was calculated according to standard methods to analyze the change in diagnostic accuracy in the study per unit increase in the covariate. Since publication bias is of concern for meta-analyses of diagnostic studies, We tested for the potential presence of publication bias using Deeks funnel plots [10].
All analyses were undertaken using Review Manager 5.2 (The Cochrane Collaboration), Meta-DiSc statistical software 1.4 (Ramo’n y Cajal Hospital, Madrid, Spain) and STATA software, version 12.0 (Stata Corporation, College Station, TX).
Results
Study characteristics and quality
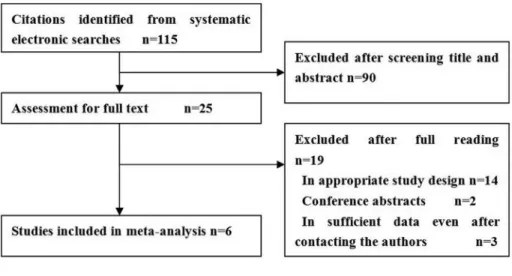
Figure 1 summaries the process of literature in identification and study selection. A total of 115 abstracts that met the inclusion criteria were retrieved. Two reviewers selected the relevant studies in dependently. After communicating with the authors, 6 reports offered sufficient data to build a two-by-two table and thus were included in the final meta-analysis [11–16]. The 6 included studies involving 435 patients with abnormal glucose tolerance (including impaired fasting glycemia or impaired glucose tolerance or type 2 diabetes) and 651 controls. All these studies were published from 2012 to 2013 and varied in sample size (from 54 to 364).
In all studies, the Reference standard was 75 g OGTT and HbA1c was corrected in accordance with the recommendations of the National Glycohemoglobin Standardization Program (NGSP), based on the Diabetes Control and Complication Trial (DCCT) and the UK Prospective Diabetes Study (UKPDS). The clinical characteristics of these studies are outlined in Table 1. The results on the methodological quality of the included studies are presented in Figure 2.
Diagnostic accuracy
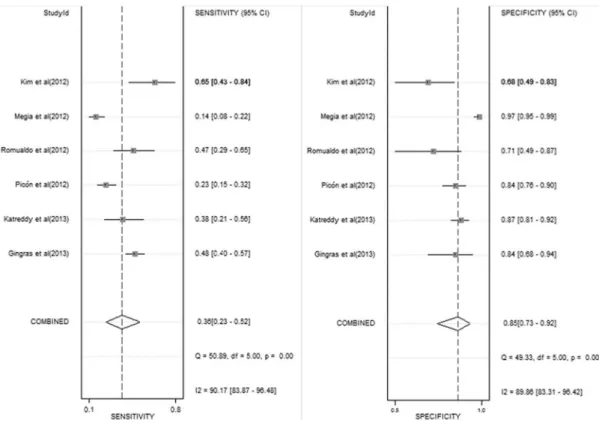
Figure 3 shows the forest plot of sensitivity and specificity for HbA1c in the diagnosis of postpartum abnormal glucose tolerance. The sensitivity ranged from 0.14 to 0.65 (0.36, 95% confidence interval [CI] 0.23–0.52), while the specificity ranged from 0.71 to 0.97 (0.85, 95% CI 0.73–0.92). The PLR was 2.4 (95% CI 1.6– 3.6), the NLR was 0.75 (95% CI 0.63–0.88) and the DOR was 3 Figure 1. Flowchart of study selection and specific reasons for exclusion from the meta-analysis.
(95% CI 2–5). TheI2value of all measures was 97%, indicating a significant heterogeneity across the included studies.
The SROC cure presents a global summary of test perfor-mance, and shows the tradeoff between sensitivity and specificity. A graph of the SROC curve for the HbA1c showing ture-positive rates vs false-positive rates from individual studies is shown in Figure 4. The area under the curve (AUC) and an index Q value are discussed as useful summaries of the curve. Use of Q value as the summary measure assumes implicitly that false negative and false positive test results are of equal value. [17]. Our data showed
that area under curve (AUC) was 0.67 (SE = 0.0712) with a Q value of 0.63 (SE = 0.0557), indicating a low level of accuracy.
Given the low number of studies included in the review, statistical subgroup analysis and covariate hierarchical modeling for investigation of heterogeneity were not performed due to low statistical power.
Publication bias
The Deeks fuunel plot asymmetry test showed insignificant publication bias (p = 0.88, Figure 5).
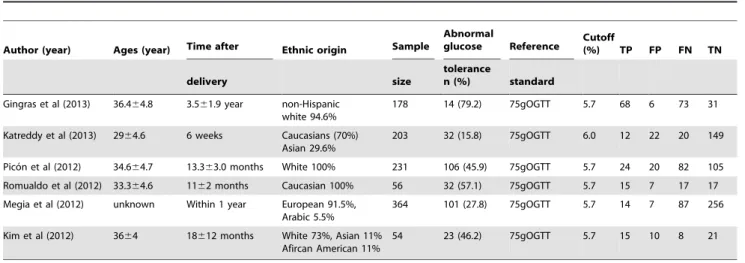
Table 1.Summary of the studies included in the meta-analysis.
Author (year) Ages (year) Time after Ethnic origin Sample
Abnormal
glucose Reference Cutoff(%) TP FP FN TN
delivery size
tolerance
n (%) standard
Gingras et al (2013) 36.464.8 3.561.9 year non-Hispanic white 94.6%
178 14 (79.2) 75gOGTT 5.7 68 6 73 31
Katreddy et al (2013) 2964.6 6 weeks Caucasians (70%) Asian 29.6%
203 32 (15.8) 75gOGTT 6.0 12 22 20 149
Pico´n et al (2012) 34.664.7 13.363.0 months White 100% 231 106 (45.9) 75gOGTT 5.7 24 20 82 105
Romualdo et al (2012) 33.364.6 1162 months Caucasian 100% 56 32 (57.1) 75gOGTT 5.7 15 7 17 17
Megia et al (2012) unknown Within 1 year European 91.5%, Arabic 5.5%
364 101 (27.8) 75gOGTT 5.7 14 7 87 256
Kim et al (2012) 3664 18612 months White 73%, Asian 11% Afircan American 11%
54 23 (46.2) 75gOGTT 5.7 15 10 8 21
TP: true-positive; FN: false-negative; FP: false-positive; TN: true-negative; OGTT: oral glucose tolerance test. doi:10.1371/journal.pone.0102144.t001
Figure 2. QUADAS-2 Risk of bias assessment. doi:10.1371/journal.pone.0102144.g002
Figure 3. Forest plot of sensitivity and specificity for HbA1c in the diagnosis of postpartum abnormal glucose tolerance. doi:10.1371/journal.pone.0102144.g003
Figure 4. Summary receiver operating characteristic cure (SROC) for HbA1c.Each solid circle represents each study in the meta-analysis. AUC: area under curve.
Discussion
Postpartum testing is recommended for women with histories of GDM to diagnose diabetes and to stratify women for risk of future diabetes. The ADA [1] as well as the WHO consistently added HbA1c levels.6.5% (48 mmol/mol) to their diagnostic recom-mendations of overt diabetes. But the usefulness of HbA1c for the reassessment of carbohydrate metabolism status in postpartum women with a history of GDM remains controversial. To the best of our knowledge, this is the first meta-analysis designed to evaluate accuracy of HbA1c for diagnosis of postpartum abnormal glucose tolerance among women with gestational diabetes mellitus. From this meta-analysis we can find that 40% (435/1086) of women with a history of GDM had abnormal glucose tolerance. Gingras et al [11] reported that the prevalence of abnormal glucose tolerance was 79.2% while Katreddy et al [12] reported only 15.8%. This difference may partly caused by the different test time after their most recent pregnancy.
The SROC curve is a technique for fitting a mathematical model to the scatter plot of sensitivity against (1-specificity). The area under the SROC curve (AUC) can summarize the inherent capacity of a test to discriminate the participant with disease from those without it. If a test has an AUC close to 1, it means that is a perfect test. The poor test usually has AUC close to 0.5. In our meta-analysis, we can find that the AUC was 0.67, it indicated that the HbA1c is not a suitable diagnostic tool for postpartum abnormal glucose tolerance.
The DOR is a single indicator of test accuracy that combines the data from sensitivity and specificity into a single number. The DOR is the ratio of the odds of positive test results in the patient with disease relative to the odds of positive test results in the patient without disease. The value of a DOR ranges from 0 to infinity, with higher values indicating the higher accuracy test performed. In the present meta-analysis, we found that the mean DOR was 3, also indicating a low level of overall accuracy.
The SROC curve and the DOR can’t explain the clinical situation, while the likelihood ratios are considered to be more clinically meaningful. A likelihood ratio describes how many times a participant with disease is more likely to receive a particular test result than those without disease [18]. In our present meta-analysis, a PLR of 2.4 suggests that patients with postpartum abnormal glucose tolerance with previous GDM have an approximately 2.4-fold higher chance of being HbA1c test-positive compared with patients with normal glucose tolerance. While the NLR was 0.75, all of these suggest HbA1c alone did not appear to be a sensitive test to detect pre-diabetes in women with prior GDM.
However, Gingras et al [11] found that the combination of HbA1c and waist circumference$88 cm had a higher sensitivity (79% vs. 48%) and a lower specificity (62% vs. 84%) for the ability to detect any glucose intolerance than HbA1C alone. Pico´n et al [13] also found the HbA1c test criterion had 22.64% sensitivity and 84% specificity to detect abnormal carbohydrate metabolism, but combination of HbA1c and fasting glucose$5.56 mmol/L had a higher sensitivity (83.02%) and a equal specificity. These studies suggested that the combination of HbA1c and other simple test could offer a sensitive test for the detection of abnormal carbohydrate metabolism in women with prior GDM.
An exploration of the reasons for heterogeneity rather than the computation of a single summary measure is an important goal of meta-analysis. In our meta-analysis, we found significant hetero-geneity for sensitivity, specificity and NLR. The sources of heterogeneity might be different study population, ages and time after delivery. To assess the sources of heterogeneity in the studies, the meta-regression analysis was needed. However, only 6 studies included in the review, statistical subgroup analysis was not suitable due to the low statistical power.
The limitations of this meta-analysis are as follow. First, the exclusion of conference abstracts, letters to the editors and did not search for unpublished data, which probably caused publication bias. Second, because of the linguistic abilities of our study team, we only included English articles, and that might led to language bias. Third, HbA1c for diagnosis of postpartum abnormal glucose tolerance among women with prior GDM was concerned only in recent years. Our meta-analysis only included 6 studies and the sample size was small.
In conclusion, evidence suggests that HbA1c alone did not appear to be a sensitive test to detect abnormal glucose tolerance in women with prior GDM. The findings from our meta-anlysis should be confirmed in future research.
Supporting Information
Checklist S1 PRISMA Checklist.
(DOC)
Author Contributions
Conceived and designed the experiments: XDS GZZ. Performed the experiments: XDS ZYZ. Analyzed the data: XYQ YQT. Contributed reagents/materials/analysis tools: XDS YQT. Contributed to the writing of the manuscript: ZYZ.
References
1. American Diabetes Association (2014) Standards of medical care in diabetes-2014. Diabetes Care 37 Suppl 1: S14–80.
2. Kim C, Newton KM, Knopp RH (2002) Gestational diabetes and the incidence of type 2 diabetes: a systematic review. Diabetes Care 25: 1862–1868. 3. Russell MA, Phipps MG, Olson CL, Welch HG, Carpenter MW (2006) Rates of
postpartum glucose testing after gestational diabetes mellitus. Obstet Gynecol 108: 1456–1462.
4. Ferrara A, Peng T, Kim C (2009) Trends in postpartum diabetes screening and subsequent diabetes and impaired fasting glucose among women with histories of gestational diabetes mellitus: A report from the Translating Research Into Action for Diabetes (TRIAD) Study. Diabetes Care 32: 269–274.
5. Shah BR, Lipscombe LL, Feig DS, Lowe JM (2011) Missed opportunities for type 2 diabetes testing following gestational diabetes: a population-based cohort study. BJOG 118: 1484–1490.
Figure 5. Deeks funnel plot asymmetry test of publication bias. doi:10.1371/journal.pone.0102144.g005
6. Whiting PF, Rutjes AW, Westwood ME, Mallett S, Deeks JJ, et al. (2011) QUADAS-2: a revised tool for the quality assessment of diagnostic accuracy studies. Ann Intern Med 155: 529–536.
7. Deville´ WL, Buntinx F, Bouter LM, Montori VM, de Vet HC, et al. (2002) Conducting systematic reviews of diagnostic studies: didactic guidelines. BMC Med Res Methodol 2: 9.
8. Reitsma JB, Glas AS, Rutjes AW, Scholten RJ, Bossuyt PM, et al. (2005) Bivariate analysis of sensitivity and specificity produces informative summary measures in diagnostic reviews. Journal of Clinical Epidemiology 58: 982–990. 9. Higgins JP, Thompson SG, Deeks JJ, Altman DG (2003) Measuring
inconsistency in meta-analyses. BMJ 327: 557–560.
10. Deeks JJ, Macaskill P, Irwig L (2005) The performance of tests of publication bias and other sample size effects in systematic reviews of diagnostic test accuracy was assessed. J Clin Epidemiol 58: 882–893.
11. Gingras V, Tchernof A, Weisnagel SJ, Robitaille J (2013) Use of glycated hemoglobin and waist circumference for diabetic screening in women with a history of gestational diabetes. J Obstet Gynaecol Can 35: 810–815. 12. Katreddy MV, Pappachan JM, Taylor SE, Nevill AM, Indusekhar R, et al.
(2013) Hemoglobin A1c in early postpartum screening of women with gestational diabetes. World J Diabetes 154: 76–81.
13. Pico´n MJ, Murri M, Mun˜oz A, Ferna´ndez-Garcı´a JC, Gomez-Huelgas R, et al. (2012) Hemoglobin A1c versus oral glucose tolerance test in postpartum diabetes screening. Diabetes Care 35: 1648–1653.
14. Megia A, Na¨f S, Herranz L, Serrat N, Yan˜ez RE, et al. (2012) The usefulness of HbA1c in postpartum reclassification of gestational diabetes. BJOG 119: 891– 894.
15. Garcı´a de Guadiana Romualdo L, Gonza´lez Morales M, Albaladejo Oto´n MD, Martı´n Garcı´a E, Martı´n-Ondarza Gonza´lez Mdel C, et al. (2012) The value of hemoglobin A1c for diagnosis of diabetes mellitus and other changes in carbohydrate metabolism in women with recent gestational diabetes mellitus. Endocrinol Nutr 59: 362–366.
16. Kim C, Herman WH, Cheung NW, Gunderson EP, Richardson C (2011) Comparison of hemoglobin A1c with fasting plasma glucose and 2-h postchallenge glucose for risk stratification among women with recent gestational diabetes mellitus. Diabetes Care 34: 1949–1951.
17. Walter SD (2002) Properties of the summary receiver operating characteristic (SROC) curve for diagnostic test data. Statistics in medicine 21: 1237–1256. 18. Akobeng AK (2007) Understanding diagnostic tests 2: likelihood ratios, pre- and