Federal University of the State of São Paulo - “Escola Paulista de Medicina” Mail address: Bráulio Luna Fº Laboratório de Cardiologia Experimental -Disciplina de Cardiologia - UNIFESP-EPM - Rua Leandro Dupré, 317 - 04025-011 - Sao Paulo, SP - Brasil
Bráulio Luna Fº
São Paulo, SP - Brazil
Rational Utilization of Diagnostic Tests in Cardiology
“The problems of disease are more complicated and difficult than any others with which the trained mind has to grapple... Variability is the law of life. As no two faces are the same, so no two bodies are alike, and no two individuals react alike and behave alike under the abnormal conditions which we know as disease. This is the fundamental difficulty in the education of the physician, and one which he or she may never grasp... Probability is the guide of life”.
William Osler 1, 1921
Medical practice combines art with science. In the past, the art of medicine was a source of prestige because of the individual talent of those who practiced it; today, howe-ver, it requires its activities to be also based on scientific research. Though such evolution has taken place in a natu-ral way, without generating much conflict, physicians often feel some discomfort when urged to justify their diagnoses. By virtue of their training and daily experience, physi-cians learn how to estimate degrees of diagnostic certitude in most diverse clinical situations. Nonetheless, only occa-sionally are they thoroughly aware of the complex chain of events underlying a clinical conclusion. They begin by reaching it almost intuitively and gradually learn how to come to their conclusions in a progressively more efficient manner. What, indeed, few of them recognize is that, all the time, they are using a probabilistic approach to quantify the information leading to diagnoses. The immediate conse-quence is that, certain as one may be of the appropriateness of one’s opinion, there is always a possibility of being wrong. One might even wonder how most of the time the diagnostic results generally are right, even not knowing exactly how that really happens.
Although it is not the purpose of this article to deci-pher the hermeneutics of clinical rationale, it has been our aim, while studying the logic of diagnostic tests, to assist physicians in effectively utilizing these important instru-ments of the modern medical science.
Clinical context - Take the following situation: a 48-year-old man suffering from an atypical thoracic pain goes to his doctor. His clinical history does not reveal any other manifestations or risk factors, and his physical examination is uneventful. The requested electrocardiogram (ECG) is normal, but the ergometric test (ET) is positive. Because this patient may have coronary artery disease (CAD), a coronary angiography study is recommended. After talking the matter over with his family, the patient decides to see another physician, who refers him for a stress thallium scintigraphy (STS).
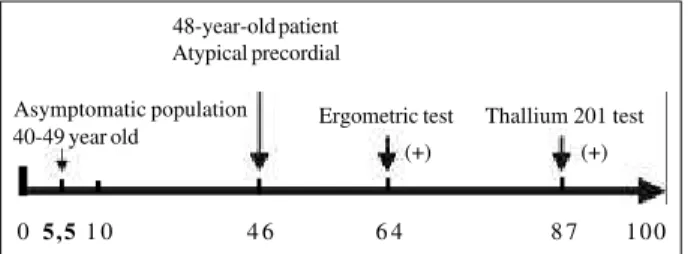
Clinical rationale - It has already been mentioned that the process of clinical decision-making consciously or unconsciously rests upon probability. In the case of the patient described above, for example, the probability of his having atherosclerosis in the coronary arteries would be estimated at 46% before the result of the ET is known. The positive ET result raises this chance to 64%. This might constitute enough evidence for the first physician to justify his request for an invasive test - the coronary angiography. The second physician, however, might have considered the possibility of a false-positive result of the ET, and would rather make certain before recommending an invasive procedure. As far as the latter situation is concerned, the chance of a false-positive ET is 36% - which some clinicians might deem too high. A stress test with a positive STS result, in such circumstances, would raise the probability of coronary disease to 87% and in this case it would be imperative to proceed with the diagnostic investigation. On the other hand, should the STS have a negative result, the chance of the patient having CAD would be reduced to around 10%. Though higher than the 5% expected for individuals in the patient’s age bracket, the coronary angiographic study would not be indicated by most physicians 2 (fig. 1).
Basic principles of diagnostic tests - Establishing a diagnosis is an imperfect process that results in a probabi-lity of certainty rather than in certainty itself. Not only clinical practice but also clinical research often involve the assessment of diagnostic tests. For instance: is the determi-nation of protein-C level useful for the prognostic evalua-tion of patients with coronary diseases? Among patients with arterial hypertension, is the renin level in the blood useful for the diagnosis of renovascular disease?
Diagnostic tests are important tools that facilitate deci-sions that physicians are required to make as an intrinsic part of their activity. Usually, they abide by several types of decision-making, such as, for instance 4: 1) confirming the
presence of a disease; 2) evaluating the seriousness of the clinical features; 3) estimating the prognosis of a disease; 4) monitoring the response to therapeutic conduct.
Internal logic of the diagnostic tests - The ideal diag-nostic test would always purvey correct answers - positive for the presence of a disease; negative for its absence. It would be rapid, safe, bloodless, reliable, and cheap. In practice, therefore, there is no ideal test. The studies of diagnostic tests utilize research designs very similar to those of observational studies, but their object and their statistical procedures are different, as we will see.
Two models should be used by researchers whenever they analyze or design a study of diagnostic tests: first, a randomized double-blinded clinical trial should be used. The high quality of this design, used successfully in clinical trials, has already been well established. Second, studies should reflect clinical practice.
Certain circumstances should be verified when a study based on these two models is implemented: first, have the patients been chosen at random for the new test versus the usual test; second, have the patients undergoing the new test obtained better results; third, as a consequence of the new test, has the patient had a shorter hospital stay, a longer survival, or simply a bigger hospital bill. And last, but not least, has the test been assessed in conditions similar to those in which it will be applied in the future? These are the kinds of questions we must routinely ask ourselves 5.
Basic structure - The basic structure of a study about diagnostic tests is similar to that of other observational studies: it is designed to determine how well a test distin-guishes between the presence or absence of a disease. The result of the test is a predictive variable. The presence or absence of disease is an outcome variable.
Categorical or continuous as it may be, the predictive variable of the test is usually dichotomized, defining the criteria that confirm or disavow the presence of disease (cut off point). The outcome variable in the diagnostic tests is the presence or absence of a disease, confirmed by a test considered the gold standard.
Sensitivity and specificity (fig. 2) - Whenever a diag-nostic test is assessed, four situations are possible: a) the test is positive, and the patient has the disease - true posi-tive (TP); b) - the test is posiposi-tive, but the patient does not have the disease - false positive (FP); c) the test is negative, and the patient has the disease - false negative (FN); d) the test is negative, and the patient does not have the disease -true negative (TN). The best tests, obviously, are those affording few false-positive or false-negative results.
The assessment of the accuracy of a test will depend on the way the effective presence or absence of a disease is as-certained. It is therefore necessary to select the test that can be used as a referential standard of the truth - the gold stan-dard. Once this standard test is selected, its results should be considered as the true ones. A classic example of an uncontested referential test is the biopsy in the case of chro-nic hepatitis. Also accepted, but with some restrictions, is the coronary angiographic analysis of the degree of coronary artery obstruction in the case of angina pectoris, or the enzymatic increase of myocardial muscle creatine kinase isoenzyme (CK-MB) in the case of acute myocardial infar-ction (AMI). Sometimes, for lack of a better option, the re-searcher may have to use questionable reference tests, such as Jones’s criteria for the assessment of rheumatic fever.
It is worth noting that the gold standard test may be simple or complex, expensive, hazardous and even, as it often proves to be, not true. There will be situations in whi-ch only the patient’s follow-up can confirm the presence or absence of the disease. Another aspect that has not recei-ved enough attention is that the negative results of
diag-0 5,51 0 4 6 6 4 8 7 1 0 0
48-year-old patient Atypical precordial
Asymptomatic population 40-49 year old
Ergometric test
(+)
Thallium 201 test
(+)
Fig. 1 - Coronary-artery disease (CAD) likelihood (%).
Fig. 2 - Characteristics and definitions of the main indices used in the analysis of diagnostic tests: SEM = sensitivity; SPE = specificity; PPV = positive predictive value; NPV = negative predictive value; PLR = positive likelihood ratio; NLR = negative likelihood ratio.
Status of disease
Present Absent
True False
positive positive
Test Positive (A) (B) A+B
Diag. Negative False- True-negative negative
(C) (D) C+D
A+C B+D
Sen = A = A/A+C Spe = D/B+D
Prevalence = A+C/A+B+C+D Accuracy = A+D/A+B+C+D
PPV = A/A+B NPV = D/C+D
PLR = A/A+C NLR = C/A+C
nostic tests (false-negative and false-positive) are not always investigated in depth. It is difficult to determine from the literature either the frequency or the main causes. Who does not remember that instance when, for lack of an appropriate criterion of truth, there was an exaggeration in the diagnosis of mitral valve prolapse?
The gold standard test being imperfect, a paradox may occur when a new method is introduced : the diagnostic test to be evaluated may display a bad result even if, in fact, it is a better test. A classic example of this phenomenon occur-red with the evaluation of an abdominal ultrasound used for diagnosis of cholelithiasis, with the cholecystography as the referential exam.
We can now add that the performance of diagnostic tests is assessed by estimation of their sensitivity (SEN) and specificity (SPE).
The SEN of a test is defined by the proportion of per-sons having the disease at issue who are given a test and have positive results. SEN indicates how good a test is in identifying affected individuals: Sen = a/a+c or TP/TP+FN. The SPE of a test is defined by the proportion of people not having the disease at issue who have a test with a negative result. It indicates how good a test is in identi-fying unaffected individuals: Spe = d/d+bor TN/T N+ FP.
Coming back to our first example, the patient with an atypical chest pain, who undergoes several diagnostic tests, both the sensitivity and the specificity of the ET have been calculated in relation to the diagnosis of coronary disease as obtained by coronary angiography, within that clinical context, according to the general logic of diagnostic tests 4,5 (fig. 3).
Choosing the diagnostic threshold of the test
The diagnostic test may present a continuous varia-bles, such as the ST-segment depression in the ECG, serum levels of CK-MB, left ventricle ejection fraction, etc. In this circumstance, it will be necessary to define the alteration level of the continuous variable that will bring about the positive results of the test. Such a choice implies a decision either to raise the sensitivity at the cost of reducing the specificity or vice versa. Most researchers should carefully evaluate the relative importance of SEN and SPE of the test to establish the most adequate point of transition as far as
diagnosis is concerned. The general strategy for that purpose would be to establish a priority 4: a) if the main
objective is to avoid a false-positive result, (the test might lead to unnecessary surgery); then the cut off point should aim at maximum specificity; b) if the main objective is to avoid a false-negative result (as the result of a test when the patient is suspected of having AIDS), then the cut off point should aim at maximum SEN.
With respect to ET, most authors prefer to use 1.0mm ST- segment depression 6. Consequently, a lowering of this
positive threshold to 0.5mm will increase SEN and signifi-cantly decrease SPE. The contrary will occur if the threshold is raised to 2.0mm. What is then the best choice of a turning point (cut off) for a positive test?
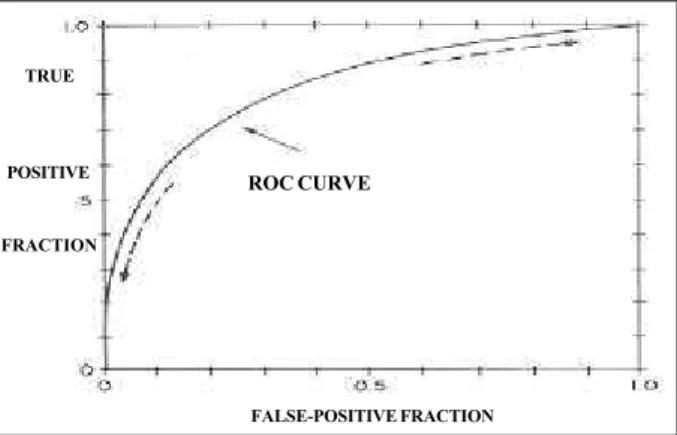
ROC Curve - The Receiver Operating Characteris-tics Curve (ROC) is the best way to determine the cut off point improving the SEN and SPE of the diagnostic test. The researcher should select several points or levels for test alteration and determine the SEN and specificity at each point. A SEN chart will then be made according to the proportion of false-positive results. In the ideal test, the curve will reach the upper left end of the chart. One of the advantages provided by this method is that curves originated by different diagnostic tests can be compared: the better the test, the closer will be its curve to the upper left corner of the chart 4 (fig. 4).
Prevalence, prior likelihood and predictive values
-The value of the diagnostic test depends not only on the SEN and SPE but also on the prevalence of the disease upon the population where it is being tested. Thus, the rarer the illness, the more specific a test will have to be in order to become useful. If, on the contrary, the disease is frequent (coronary disease in middle-aged smokers with typical angi-na), the test has to be very sensitive to become useful to physicians. Otherwise, the negative result will express a false-negative outcome.
For each patient, the prevalence of the disease is gene-rally described as a prior likelihood, is based on
demogra-Fig. 3 - Performance analysis of the ergometric test (ET) as compared to coronary angiography. Diamond GA, Forrester JS 2.
Coronary angiography
Present Absent Total
Ergometric Positive 605 340 945 Test (ET) Negative 284 702 986
Total 889 1042 1931
Prevalência - A+C/A+B+C+D = 889/1931 = 46%; SEN - 605/889 = 68%; SPE - 802/1042 = 77%; PPV - 605/ 945 = 64%; NPV - 702/ 986 = 71%; PLR - 605/889 ÷ 340/1042 = 2,1; NLR - 284/889 ÷ 702/1042 = 0,48.
Fig. 4 - Typical ROC curve. The ideal test is the one that reaches the topmost left quadrant (100% sensitivity and specificity)
ROC CURVE
TRUE
POSITIVE
FRACTION
phic data and clinic characteristics that a particular patient must have concerning a disease, and it should be estimated before a diagnostic test is performed. The prior likelihood of CAD, for example, may be very low - around 1% - among young army recruits, but very high - around 90% - among middle-aged people with hypertension and typical angina. The relation between SEN and SPE of a diagnostic test and the prior likelihood of a disease may be formally ex-pressed by the theorem of Bayes 7. After the decision to
perform a test is finally made, the most important step for a physician is to estimate whether its result is reliable. Such information, the positive and negative predictive value, can be easily obtained from the same table used for the calculation of SEN and SPE (fig. 3).
The positive predictive value (PPV) of the diagnostic test, therefore, is the probability of the disease occurring in a person whose result was positive (PPV = A/A+B).
The negative predictive value (NPV) of the test is the probability of the disease not occurring in a person whose test result was negative (NPV = D/C+D).
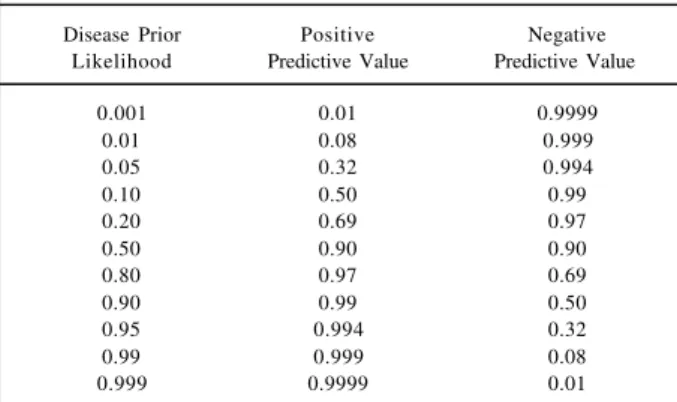
The predictive value is also called posterior likelihood. Because it incorporates information, not only in the test but also from the population being assessed, the predictive value is a good measurement of the overall clinical utility of the test. For example, assuming the sensitivity and speci-ficity of CAD by STS to be 90%, the meaning of a positive test will depend on the prior likelihood of the person being assessed having CAD. For a prior likelihood of 1% (young army recruit), the PPV will be 8%. It is, therefore, most probable that the positive result of the test will be a false positive. On the other hand, for a 90% prior likelihood of CAD in a middle-aged male patient with a typical history of angina and hypertension, the positive test will result in a 99% probability of CAD. Nonetheless, CAD will not be excluded by a negative test, because the odds will still be 50% for the same patient to have the disease 2 ,4 (table I).
We thus highlight the fact that the main determinant in estimating the test result is the prevalence or prior likelihood of the disease at issue. Even when the diagnostic test has high sensitivity and specificity values, if the disease prevalence for that patient is low, the test with a positive
result will not be very significant because there is a great chance of the result being false-positive. On the other hand, where the prevalence of the disease is high and the test results negative, there is a great chance of the results also being false-negative. Consequently, the major utility of diagnostic tests occurs in situations of intermediate prevalence (between 25% and 65%) 5,8.
Likelihood ratio - This is another way to evaluate the result of a diagnostic test. Likelihood ratio (LR) is simply the likelihood that a person with a disease would have a particu-lar test result, divided by the likelihood that a person without the disease would have the same result 4,5.
When combined with information on the prior likeli-hood of a disease, the LR can be used to determine the pre-dictive value of a test result, which requires the prior likeli-hood to be expressed in prior odds of that disease. The odds of a disease are simply the ratio between the proportion of people with that disease and the proportion of people without the same disease. (odds = p/1-p). A 25% prior likelihood, for instance, corresponds to 1:3 (25%/75%) odds. 5:1 odds would correspond to 5/6 = 83% probability.
The prior odds of a disease, when multiplied by the LR, determine the posterior odds of that disease. Thus, the pri-or odds of AMI fpri-or a 45-year-old male patient with a complaint of precordial pain for more than 1h, is 4:1 (80% prior likelihood). In the hypothesis, for example, the asparaginase kinase (AK) level was 150 UI/dL, and multi-plying the prior odds (4:1) by LR of AMI for this level of AK of 5:4 (table II), the posterior odds will be 20:4 or 5:1 (poste-rior probability of 83%).
Advantages of the likelihood ratio - 1) The likelihood ratio permits expressing the result of the diagnostic test at several cut-off levels; 2) The likelihood ratios for a sequen-ce of different tests can be multiplied together if tests are independent, thereby providing an overall LR for a given set of test results.
Limitations of diagnostic tests - As it happens with so many other observational studies, also diagnostic tests are liable to random and systematic errors.
Random errors - Some patients with the disease will have normal diagnostic test results, just as a matter of chance. This kind of error, though inevitable, can be quantified. The way to estimate it is building confidence intervals (CI) for the diagnostic test values of SEN, SPE,
Table I - Predictive value of the test 90% sensitivity and specificity variable: prior likelihood of disease (prevalence).
Disease Prior Positive Negative Likelihood Predictive Value Predictive Value
0.001 0.01 0.9999
0.01 0.08 0.999
0.05 0.32 0.994
0.10 0.50 0.99
0.20 0.69 0.97
0.50 0.90 0.90
0.80 0.97 0.69
0.90 0.99 0.50
0.95 0.994 0.32
0.99 0.999 0.08
0.999 0.9999 0.01
Table II - Likelihood Ratio for the level of serum asparaginase-kinase in the diagnosis of acute myocardial infarction (AMI).
Asparaginase Kinase Patients Likelihood
(UI/dL) AMI No AMI Ratio
0 - 99 15 150 15/100÷150/200 = 1:5 100 - 199 25 40 25/100÷40/200 = 5:4 > 200 60 10 60/100÷10/200 = 12:1
NPV, and PPV. The CI allows the reader to see the variation of values in relation to related results and compare them with the variation presented by the other diagnostic tests. For example, a test applied to 100 people presents 80% SEN and 70% SPE. A new diagnostic test results positive in all five individuals with the disease who constituted the sample (100% SEN) and negative in 9 of the 10 individuals without the disease (90% SPE). Though expressive, these results have been obtained from a small sample, which means that considering a 95% CI, the SEN and SPE of the new test range from 57% to 100% and from 60% to 98%, respectively. These values supersede those of the former tests. From this standpoint, it is not so clear that the new test will represent a real improvement - in fact it may be even worse 5,8.
This problem could have been avoided by a previous estimation of how large the sample should be in order to reach the desired level of sensitivity and specificity.
Systematic errors - The most common errors are those involving sampling, measurement and publication biases 7.
The sampling bias occurs when the sample studied is not representative of the target population the test will be applied to. Such studies are carried out in tertiary reference centers where samples of serious cases are concentrated. Similarly, if specificity is tested on a volunteering population consisting of normal individuals, the values obtained will be too high. It is well known that volunteering individuals are more normal than the general population. The best strategy to tackle such problems is applying the test to populations similar to those the test is destined for. Another effect of sampling is that the prevalence of disease in the sample being studied is generally much higher than the prevalence found in the clinical practice, a fact that leads to overestima-tion of the values predicted in the test.
Measurement bias is what happens when the exami-ner knows the diagnosis of the case when analyzing the test result. It is particularly important in borderline situations, when there are doubts with respect to interpretation of the test. The best strategy is to perform a blinded test interpre-tation concerning both the patient’s condition and the reference test result.
Publication bias - Tests that do not offer promising re-sults are usually unpublished. Alternatively, authors should carry out diagnostic tests with representative samples. Thus, even if negative, the result may be significant and stand a greater chance of being accepted for publication.
Conclusion
Last, but not least, perhaps as a response to Lord Kel-vin’s curse (Kelvin did not take medicine seriously because he did not believe in a science that could not measure its phenomena), physicians are resorting more and more often
to probabilistic reasoning in their daily practice. Very soon, with the continuing speed medicine is incorporating statis-tical and methodological techniques, we will perhaps be vying with the physics of subatomic particles - the state-of-the-art field of knowledge that carries in the essence of its theoretical body the laws of statistical probability.
Apart from any exaggeration, and irrespective of the evolution we can descry in the future, it is unquestionable that medicine is becoming a more and more scientific enter-prise demanding from its scholars a commitment to have in-dividual qualities of physicians, who hold themselves res-ponsible for an appropriate reading of their patients’ com-plaints, and manifestations supplemented by the best infor-mation available regarding the situation at issue. Because there are no definitive rules or laws to that effect, a good cli-nical assessment will still have to guide and humanize medi-cal practice for a long time to come.
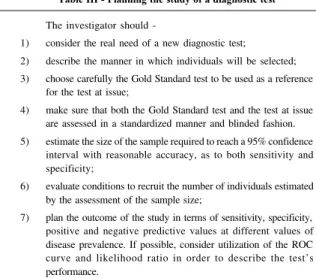
The explosion of new and expensive diagnostic tests demands from doctors more than simple common sense: they have to learn and use in an effective way the strategy summarized in table III. Prevalence, sensitivity, specificity, predictive values and likelihood ratios are useful tools for evaluating dozens of diagnostic tests that are reported daily in medical journals and used daily in clinics. It is up to the physician to decide if they are worth using or not. In such analyses, clinical benefits should be weighed against medical risks, economic burdens; advantages and disad-vantages vis-à-vis the other examinations should also be considered. Albeit it is no easy task, it is the doctor’s duty to know the techniques for validation and interpretation of diagnostic tests in order to decide on a scientific basis about the real usefulness thereof .
Table III - Planning the study of a diagnostic test
The investigator should
-1) consider the real need of a new diagnostic test;
2) describe the manner in which individuals will be selected; 3) choose carefully the Gold Standard test to be used as a reference
for the test at issue;
4) make sure that both the Gold Standard test and the test at issue are assessed in a standardized manner and blinded fashion. 5) estimate the size of the sample required to reach a 95% confidence
interval with reasonable accuracy, as to both sensitivity and specificity;
6) evaluate conditions to recruit the number of individuals estimated by the assessment of the sample size;
1. Osler W -Medical Education. In: Counsels and Ideals, 2nd ed. (cidade ???): Houghton Mifflin,1921.
2. Diamond GA, Forrester JS - Analysis of probability as an aid in the clinical diagnosis of coronary-artery disease. N Engl J Med 1979; 300:1350-8. 3. Patterson RE, Horowitz SF - Importance of epidemiology and biostatistics in
deciding clinical strategies for using diagnostic tests: a simplified approach using examples from coronary artery disease. J Am Coll Cardiol 1989; 13: 1653-65. 4. Sackett DL, Haynes RB, Tugwell P - Clinical Epidemiology: A Basic Science for
Clinical Medicine. 2nd ed. Boston: Litlle, Brown, 1991: 370.
References
5. Sackett DL A primer on precision and accuracy of the clinical examination -JAMA 1992; 267: 2638-44.
6. Gianrossi R, Detrano R, Mulvihil D et al - Exercise-induced St depression in the diagnosis of coronary artery disease: a meta-analysis. Circulation 1989; 80: 87-95.
7. Wagner HN - Bayes’s theorem: an idea whose time has come? Am J Cardiol 1982; 49: 875-7.