Predrag M. Živković1, Mladen A. Tomić1, Gradimir S. Ilić1, Mića V. Vukić1, Žana Ž. Stevanović2
1University of Niš, Faculty of Mechanical Engineering, Niš, Serbia
2University of Belgrade, Institute for Nuclear Sciences Vinča, Laboratory for Thermal Engineering and Energy, Belgrade,
Serbia
Abstract
Rapid industry development as well as increase of traffic volume across the world have resulted in air quality becoming one of the most important factors of everyday life. Air quality monitoring is the necessary factor for proper decision making regarding air pol-lution. An integral part of such investigations is the measurement of wind characteristics, as the wind is the most influential factor in turbulent pollution diffusion into the atmos-phere. The most of the air pollution originates from combustion processes, so it is impor-tant to make quantitative, as well as qualitative analysis, as the sources of pollution can be very distant. In this paper, specific methodology for continuous wind, temperature and air quality data acquisition is presented. Comparison of the measured results is given, as well as the detailed presentation of the characteristics of the acquisition software used.
Keywords: air quality, atmospheric conditions, acquisition software, wind data, CO2.
SCIENTIFIC PAPER
UDC 502.3.681.5.08
Hem. Ind.66 (1) 85–93 (2012)
doi: 10.2298/HEMIND110525066Z
Available online at the Journal website: http://www.ache.org.rs/HI/
Since the Industrial Revolution, the mankind is dealing with increasing pollution problems. The main pollution sources are the side effects of manufacturing, mining, transportation, and power production. The ef-fects on the human standard of living, number of people affected and the applied technology [1] are usually taken as the measure the pollutant emissions impacts to the environment. As the air pollution increases, the effort to understand the related phenomena conse-quentially increases. Extensive research is being done on some of the pollution aspects.
Many authors are giving their contribution by using different measuring techniques. Researchers always have on their mind that equipment needed for air pol-lution is relatively expensive, and as such not easily available to everyone. It is possible to conduct the re-search by monitoring multiple pollution components [2–8,11], or a single one but with multiple instruments and measuring locations [5,6,9,12]. Some research is done through long-term measurements [11,12], and some with relatively short-therm, but with high fre-quency [9,10]. A number of studies has been done on CO2 level monitoring, which is expected, considering
growing global warming problems [6,7,9–11]. A lot of studies compare measured and model or numerical data [3–5,8]. A number of authors apply detailed statis-tical analysis [10]. As the locations of the sources are very important, it was shown that it is possible to
Correspondence: P.M. Živković, Faculty of Mechanical Engineering, Aleksandra Medvedeva 14, 18000 Niš, Serbia.
E-mail: [email protected] Paper received: 25 May, 2011 Paper accepted: 20 September, 2011
tect the sources of pollution, if the wind data are known [8].
It is obvious that proper estimation of the pollutant emission level is of vital importance. As the refference component for the measurements, concentration of CO2 was chosen. Reasons for such decision were the
chemical inertiality and the relatively high concentra-tion of CO2 in the atmosphere, which allows it to be
used as the tracer gas. Although CO2 is denser than air,
it can be assumed that all other components of the flue gasses will be distributed similarly. The fact is that for simulations of urban pollution distribution usually SF6
was used, and its density is 6.12 kg/m3, which is con-siderably higher than 1.98 kg/m3 for CO2 (both for
at-mospheric pressure and 0 °C). As of January 1st 2006, SF6 was banned as the tracer gas, some other solution
had to be found. Under such conditions, it can be ac-cepted that CO2 as a main flue gas component can
indi-cate the distribution of all the other components.
MONITORING EQUIPMENT
As can be seen in Figure 1, the District Heating Plant „Krivi Vir“ is located in the center of the City of Niš. It is surronded with high buildings, mostly over 7 floors high. This means that there are about 50,000 people directly and highly influenced by the plant. The plant power is 130 MW. The situation was much improved when fuel was changed from heavy oil to natural gas in 2006. Recent measurements shows that flue gasses on the exhaust collector contain 0–1 ppm CO, 1–2 ppm NO and about 50 ppm NO2 and NOx. This indicates that the
main components are CO2 and H2O, which justifies the
P.M. ŽIVKOVIĆ et al.: SPECIFIC APPROACH FOR CONTINUOUS AIR QUALITY MONITORING Hem. ind. 66 (1) 85–93 (2012)
The district heating plant is located near to the Ni-šava river, so the monitoring sites were chosen also to be located near to the river. Monitoring Site 1 is lo-cated on the upstream, and Monitoring Site 2 on the downstream side of the plant. It is supposed that this arrangement can assure the separation of CO2 imission
from the plant and the rest of the sources (individual heating, road traffic, organic waste etc.), which were treated separately.
Figure 1. Monitoring sites and district heating plant disposition.
Monitoring Sites were chosen in order to determine specific conditions of pollutant emission in the City of Niš. Monitoring Site 1 represents individual heating, as being positioned in the suburbia. Monitoring Site 2 represents influence of the traffic, as being located nearby crossroad with very high traffic intensity. Con-trol monitoring site, located in the city fortress, repre-sent green area, as being mostly forested. This is also the location of the main meteorological station. River Nišava flows through the centre of the domain. All measuring positions were used to determine the in-fluence of the District Heating Plant „Krivi Vir“, as one
of the largest pollution sources in the city (also 31.3% of total CO2 emission) [6].
CO2 measurement
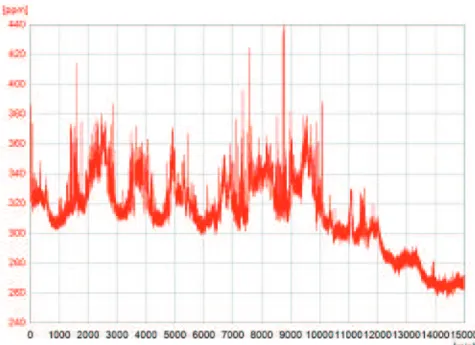
Measurements were performed from december 2008 to december 2010. The validation of the data measured on the Monitoring Sites 1 and 2 was done by measuring CO2 imission in the control measuring
posi-tion, which is presented in Figures 2 and 3. These con-trol measurements were done by TESTO 454 gas ana-lyser. The measurements are slightly different (diffe-rence is constant and can be removed statistically). Yet, it is important that both measurements shows the significant decrease of CO2 concentration at the end of
the heating season (marked with circle on both dia-grams). This shows that the start predictions are cor-rect, and that these measurements, after thorough analysis, can indicate the CO2 distribution into the
at-mosphere.
In the Table 1, properties of the used CO2 sensor
module are presented.
Wind speed and direction measurement
As all the processes in the atmospheric boundary layer are highly influenced by the wind, basic moni-toring data are the wind speed and direction. Usually, cup anemometers are used. For the reason of com-paring measured data on chosen locations with the long-term, stable measured data from the main meteo-rological station, 10 m mast for cup anemometer posi-tioning was used. In Table 2 the properties of the used cup anemometer are presented.
Temperature sensors and data logger data
Temperature measurements were performed in or-der to assess the atmospheric stability. In cooperation with the Ecoterra company, the Akvi Data logger and
appropriate software were developed. The properties of the used temperature sensors and Akvi data logger are given in Table 3.
Table 1. CO2 sensor technical data (concentration
measu-rement)
Measuring range 350–10000 ppm CO2
Accuracy ±20% at 1000 ppm CO2
Temperature range –10–50 °C Rel. humidity range 5–95% RH
Acquisition speed 1sample/s
Table 2. Cup anemometer technical data
Parameter Wind speed
measurement
Wind direction measurement Measuring range 0.5–50m/s 0–360°
Accuracy ±0.1m/s ±0.1°
Temperature range –40–80 °C –40–80 °C Relative humidity range 0–100% RH 0–100% RH Acquisition speed 2 samples/s 2 samples/s
Acquisition software
A multi-channel program package DSD8csIP v1.0s was developed in cooperation with the Digital Smart Devices company. The software package consists of two parts: Server (computer connected to the logger) and Client (any computer that can access the Server via local and/or global network).
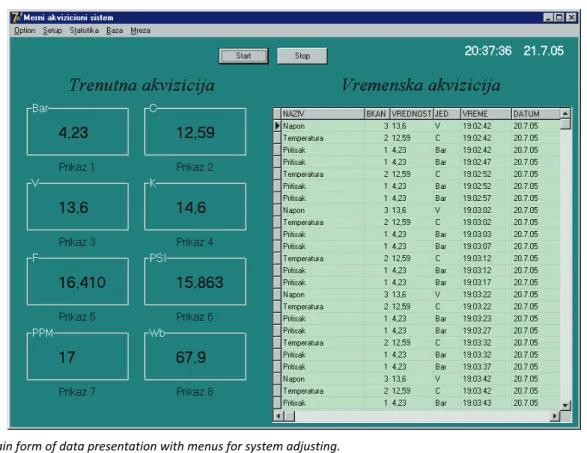
The server application is shown in Figure 4. Two ty-pes of data are presented: simultaneous monitoring of all measuring channels (on the left side, part Trenutna
akvizicija), and presentation of previous mesurements
(on the right side, part Vremenska akvizicija).
Table 3. Manufacturer’s specifications for the temperature sensors and Akvi data logger (sensor type and position: as needed; direct coupling with PSI: data logger; application software: author)
Property Temperature sensor type TP 11, DREV 1F TP 21, DREV 2F Basic data
Operating range –40–125 °C –50–150 °C
Resolution 0.06 °C
Accuracy 0.05 °C 0.1 °C
Responce 1 s 20 s
Electronic routing compatibility Communication Differential, 4 wire
Voltage 12 V
Communication type Serial Power supply 20 mA per driver Driver connecting Paralel
Max. No. of drivers 32
Channels per driver 8 4
Channel adjusting is possible from the client, as well as from the server side. Client part of the ensures safe and immediate insight into the measured environment. In Figure 5, table presentation of all channel configu-ration is shown.
For the purposes of wind speed and direction, CO2
concentration and temperature, a modification of the Client part of the software package was made. It was more suitable for the real case, considering that there
P.M. ŽIVKOVIĆ et al.: SPECIFIC APPROACH FOR CONTINUOUS AIR QUALITY MONITORING Hem. ind. 66 (1) 85–93 (2012)
was a need for operating partially in PC Logger mode, and partially in Data Logger mode. The modification was named PCLOG v.1 (Figure 6).
This modification calls all available sensors in RS232-RS485 network. Measured data are saved into the database. Instantenous values, as well as the values from the current database, are showed graphically.
Single channel adjusting is possible, as the sampling time is a very important parameter. Also, channel des-cription is possible, if change in data collected is needed (namely, if concentration of CO instead of CO2 is needed,
etc.). Channel position is also changeable, if needed.
MEASURED DATA
The methodology presented was part of the re-search on the Thermal Engineering Department at the
Faculty of Mechanical Engineering, University of Niš. The basic idea was increasing the knowledge database, and improving atmospheric conditions monitoring and simulation. The usual procedure involves sampling air on a single location in the city, and then distributing the results according to, usually, very simple and often in-sufficient models.
In order to improve atmospheric conditions model-ling, a specific system was developed. The model size, presented in Figure 1, is 16 km2, and represents the ur-ban core of the city of Niš. Main wind directions are North-West and East, following Morava and Nišava ri-ver valleys. Data on Monitoring Sites 1 and 2 will be compared for the start of the heating season 2009/ /2010. All the data will be used for validation of the numerical simulations.
Figure 4. Main form of data presentation with menus for system adjusting.
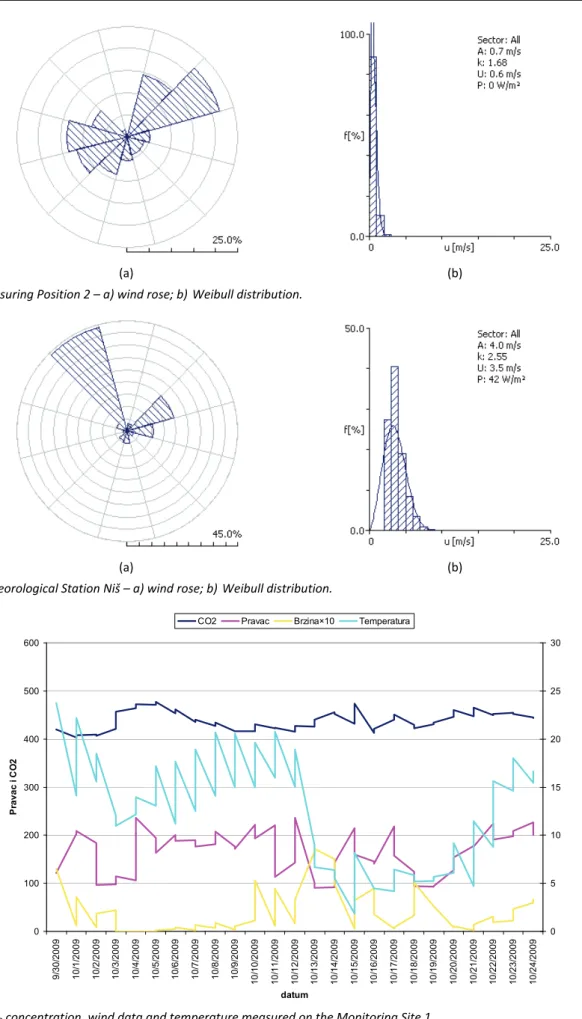
As can be seen in Figures 7–9, it is obvious that there are differences in wind frequency and direction. The reason for this is that the Main Meteorological Station Niš is less influenced by the surrounding objects than Monitoring Sites 1 and 2. Figure 9 clearly shows the main wind directions in Niš. As Monitoring Sites 1 and 2 are very close to the river, the larger influence of the East–West wind directions is obvious.
DISCUSSION OF THE MEASURED RESULTS
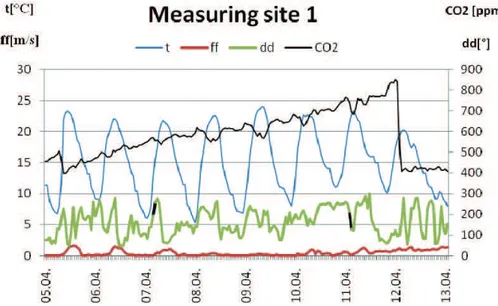
Figures 10 and 11 show results for CO2
concen-tration, wind direction and speed and temperature measurements on Monitoring Sites 1 and 2 are shown
for the period 30.09.2009–24.10.2009, which includes the start of the heating season, October 15th. The dif-ferences in the shape of the data presented are a result of the different sampling procedures.
Results shown in Figure 10 are obtained by samp-ling all data in 10 s intervals. Results shown in Figure 11 are sampled in 1 s intervals, and then averaged over 300 s (5 min) intervals. As it is obvious that the latter methodology gives a much more precise represen-tation of the atmospheric conditions, it was adopted for the later work.
On the other hand, both groups of results indicate the same behaviour for all measured quantities,
al-Figure 6. Main data presentation form with menus for system adjusting in PCLOG v.1 mode.
(a) (b)
P.M. ŽIVKOVIĆ et al.: SPECIFIC APPROACH FOR CONTINUOUS AIR QUALITY MONITORING Hem. ind. 66 (1) 85–93 (2012)
(a) (b)
Figure 8. Measuring Position 2 – a) wind rose; b)Weibull distribution.
(a) (b)
Figure 9. Meteorological Station Niš – a) wind rose; b)Weibull distribution.
0 100 200 300 400 500 600 9/ 30 /2 009 10 /1 /2 009 10 /2 /2 009 10 /3 /2 009 10 /4 /2 009 10 /5 /2 009 10 /6 /2 009 10 /7 /2 009 10 /8 /2 009 10 /9 /2 009 10 /1 0/ 20 09 10 /1 1/ 20 09 10 /1 2/ 20 09 10 /1 3/ 20 09 10 /1 4/ 20 09 10 /1 5/ 20 09 10 /1 6/ 20 09 10 /1 7/ 20 09 10 /1 8/ 20 09 10 /1 9/ 20 09 10 /2 0/ 20 09 10 /2 1/ 20 09 10 /2 2/ 20 09 10 /2 3/ 20 09 10 /2 4/ 20 09 datum P r av ac i C O 2 0 5 10 15 20 25 30 CO2 Pravac Brzina×10 Temperatura
0 100 200 300 400 500 600 700 800 900 28: 0 9: 09 29: 0 9: 09 30: 0 9: 09 1: 10: 09 1: 10: 09 2: 10: 09 3: 10: 09 4: 10: 09 5: 10: 09 6: 10: 09 7: 10: 09 8: 10: 09 9: 10: 09 9: 10: 09 10: 1 0: 09 11: 1 0: 09 12: 1 0: 09 13: 1 0: 09 14: 1 0: 09 15: 1 0: 09 16: 1 0: 09 17: 1 0: 09 17: 1 0: 09 18: 1 0: 09 19: 1 0: 09 20: 1 0: 09 21: 1 0: 09 22: 1 0: 09 23: 1 0: 09 24: 1 0: 09 datum P r avac i C O 2 0 5 10 15 20 25 30 35 40 45
CO2 Pravac Brzina×10 Temperatura
Figure 11. CO2 concentration, wind data and temperature measured on the Monitoring Site 2.
though in much more detail for the Monitoring Site 2. One can observe the dependence of the CO2
concen-trations on the time of day (due to the traffic, before the start of the heating season), as well as on the mean temperature (start of the heating, which leads to a sharp increase of the mean daily concentration levels).
It can be clearly noticed in Figure 11 that the CO2
concentration level varies between 440 and 590 ppm until the beginning of October. The observed tempera-tures vary between 12 and 30 °C. Then, in the night between October 2nd and October 3rd the temperature drops to 10 °C, and daily maximum to 18 °C. In res-ponse, the individual heating started, which leaded to sharp increase of the CO2 concentration level, which
stabilized between 600 and 800 ppm. On the other hand, from October 5th, the temperature returned to the previous level, but the heating obviously continued, which led to the highest CO2 concentration value of 820
ppm on October 8th, when the temperature maximum of 33 °C was reached. Thereafter, the CO2
concentra-tion returns to the previous level, and starts increasing slowly from October 15th, which is the official start of the heating season.
The reason for such a sharp increase in CO2
concen-tration is the occurrence of thermal inversion due to the sharp temperature drop, and the low driving force in the atmosphere, which led to the CO2 deposition in
the ground level of the atmosphere. As the area of interest is only a few meters above the ground (house-hold level, except for the buildings around the District Heating Plant, which are directly influenced by the plume), it can be assumed that the rest of pollutants will follow the CO2 behaviour. This assumption should
be verified by monitoring of the chosen pollutants.
CONCLUSION
In this paper, a specific methodology for atmos-pheric conditions monitoring by measuring of wind speed and direction, temperature and CO2
concentra-tion is presented. The proposed methodology shows large possibilities for quantitative estimation of the air quality. As concentration levels of CO2 are easily and
precisely measured, the proposed methodology gives a relatively cheap and very precise system of quantitative air quality monitoring. The results obtained shows that it is possible to track the plum from the District Heating Plant chimney (56 m high) and to assess its influence on the surrounding buildings and households, which are only few hundred meters away and up to 50 m high.
As the wind is the most influential parameter for pollution diffusion processes, it is possible to combine continuous CO2 measurements with the sampling
tech-niques for different pollutants in order to obtain real time monitoring of the areas in which the pollution sources originate mostly from combustion processes (which is almost everywhere, except near the large chemical plants). Such methodology should improve our knowledge of the air quality in, primary, highly po-pulated areas.
P.M. ŽIVKOVIĆ et al.: SPECIFIC APPROACH FOR CONTINUOUS AIR QUALITY MONITORING Hem. ind. 66 (1) 85–93 (2012)
The developed data logger with original software allows easy implementation of the proposed metho-dology, considering the relatively low price of the ins-trumentation combined with high quality sensors used. The system is very flexible and can be extended for measuring various air pollutants (CO, H2O, SOx, NOx,
VOC, etc.), which makes it useful for validation of nu-merical simulations. Such data are very valuable for indoor air quality studies, as the outdoor and indoor environment inevitably influence each other.
Hopefully, beter understanding of atmospheric phe-nomena, as well as the pollution dispersion, will lead to understanding of necesity to keep, and even improve the quality of the entire environment.
REFERENCES
[1] Urban Air Pollution – European Aspects, J. Fenger, O. Hertel, F. Palmgren (Eds.), Kluwer Academic Publishers, Dordrecht, 1998.
[2] C. Wood, Planning Pollution Prevention, Heinemann Newnes, Oxford, 1989.
[3] W.J. Coirier, S. Kim, CFD Modeling for Urban Area Con-taminant Transport and Dispersion: Model Description and Data Requirements, Sixth Symposium on the Urban Environment, The 86th AMS annual meeting, Atlanta, USA, 2006.
[4] S.R. Hanna, J.C. Chang, D.G. Strimaitis, Hazardous gas model evaluation with field observations. Atmos. Environ. 27A (1993) 2265–2285.
[5] R.G. Izarra, Second moment modeling for the numerical simulation of passive scalar dispersion in urban
environ-ments, PhD Thesis, Fachbereich Maschinenbau der Uni-versität Siegen, 2009.
[6] P. Živković, G. Ilić, M. Tomić, M. Vukić, M.Ž. Stevanović, Ž.Ž. Stevanović, O. Ogrizović, Procena zagađenja vaz-duha na teritoriji Grada Niša, International Symposium Power Plants 2010, Vrnjačka Banja, Serbia, 2010 (pub-lished on CD, ISBN: 978-86-7877-020-3).
[7] P. Živković, G. Ilić, M. Vukić, Measurements of CO2
dis-tribution in free atmosphere, Proceedings of the 5th Dubrovnik Conference on Sustainable Development of Energy, Water and Environment Systems, Dubrovnik, Croatia, 2009 (published on CD: ISBN: 978-953-6313-98-3).
[8] Y.-C. Chan, O. Hawas, D. Hawker, P. Vowles, D.D. Cohen, E.D. Stelcer, R. Simpson, G. Golding, E. Christensen, Using multiple type composition data and wind data in PMF analysis to apportion and locate sources of air pol-lutants, Atmos. Environ. 45 (2011) 439–449.
[9] M.B. Selsted, P. Ambus, A. Michelsen, L. van der Linden, K.S. Larsen, P. Kim, T.N. Mikkelsen, C. Beier, Measure-ment of carbon dioxide fluxes in a free-air carbon di-oxide enrichment experiment using the closed flux chamber technique, Atmos. Environ. 45 (2011) 208–214. [10] N. Sparks, R. Toumi, Remote sampling of a CO2 point
source in an urban setting, Atmos. Environ. 44 (2010) 5287–5294.
[11] Y. Lei, Q. Zhang, C. Nielsen, K. He Beier, An inventory of primary air pollutants and CO2 emissions from cement
production in China, 1990-2020, Atmosp. Environ. 45
(2011) 147–154.
IZVOD
SPECIFIČNI PRISTUP KONTINUALNOM PRAĆENJU KVALITETA VAZDUHA
Predrag M. Živković1, Mladen A. Tomić1, Gradimir S. Ilić1, Mića V. Vukić1, Žana Ž. Stevanović2
1
Univerzitet u Nišu, Mašinski fakultet, Niš, Srbija
2
Univerzitet u Beogradu, Institut za nuklearne nauke Vinča, Laboratorija za termotehniku i energetiku, Beograd, Srbija
(Naučni rad)
Nagli razvoj industrije u dvadesetom veku uz nagli porast intenziteta
saobra-ćaja od sedamdesetih godina prošlog veka doveo je probleme zagađenja vazduha na vrh prioriteta vezanih za kvalitet života. Poznato je da su procesi sagorevanja, kako u saobraćajnim sredstvima, tako i u energetskim i ložištima u domać ins-tvima, oni koji čine veliku većinu zagađenja vazduha. Gradska toplana „Krivi Vir“ nalazi se u samom gradskom jezgru Niša, u visoko urbanizovanoj zoni u kojoj živi oko 50.000 ljudi. Najbliže zgrade se nalaze na par stotina metara od toplane i slične su visine kao i dimnjak, tako da su izložene direktnom uticaju perjanice, što je bilo veoma uočljivo u periodu dok je kao energent korišćen mazut. Imajući sve ovo u vidu, neizbežno se nameće potreba za što jednostavnijim, jevtinijim, a isto-vremeno i dovoljno preciznim sistemom kontinualnog praćenja stanja vazduha. Kako je trenutna praksa prikupljanje uzoraka na jednom mestu u gradu, jednom ili dva puta dnevno, to se ne može sa sigurnošću utvrditi na koji način će polutanti difundovati u okolinu, a pogotovo ne u realnom vremenu. Ranija praksa je bila upotreba SF6 kao markera, ali je on zabranjen od početka 2006. Kako je CO2
naj-zastupljeniji i inertni produkt sagorevanja većine gorivih materija, a njegova kon-centracija u atmosferi (preko 390 ppm) omogućava relativno jednostavno, jevtino i precizno merenje, a i zbog relativno malih dimenzija posmatrane oblasti (16 km2 gradskog jezgra Niša), to je on izabran kao reprezent difuzije polutanata, prvens-tveno iz Gradske toplane. Postojeći podaci govore da je Gradska toplana izvor oko 31% CO2 u Nišu, saobraćaj oko 38%, a ostatak je pojedinačno loženje i drugi izvori.
Jasno je da se posebna pažnja mora posvetiti samoj Gradskoj toplani. U ovom radu je prikazana specifična metodologija za kontinualno praćenje podataka o brzini i pravcu vetra, temperaturi i koncentraciji CO2. Dat je opis eksperimentalne
instalacije, sa karakteristikama korišćenih senzora i softvera razvijenog za prikup-ljanje podataka. Na kraju je dat uporedni prikaz rezultata merenja sa dva merna mesta, kao i njihova analiza. Dati merni sistem je pokazao da je sposoban da kontinualno prati stanje atmosfere. U sklopu sa pratećim softverom primenljiv je za detaljnije praćanje stanja atmosfere, u zavisnosti od potrebe. Analizom po-dataka je utvrđeno da su dobijeni rezultati realni i da se ponašaju u skladu sa dnevnim i sezonskim promenama u atmosferi. Oformljena baza podataka se može upotrebiti za validaciju numeričkih eksperimenata, kao osnova za analizu stanja atmosfere, uticaja na kvalitet vazduha u prostorijama, kao i na životnu sredinu.