ORIGINAL ARTICLE
J of Evidence Based Med & Hlthcare, pISSN- 2349-2562, eISSN- 2349-2570/ Vol. 2/Issue 22/June 01, 2015 Page 3315
A STUDY OF OXIDATIVE STRESS IN DIABETES
Babu Rao Rentapalli1, Santhoshi Sammeta2, Sridhar V. Maddikunta3, Souris Kondaveti4,
Margaret Viola5
HOW TO CITE THIS ARTICLE:
Babu Rao Rentapalli, Santhoshi Sammeta, Sridhar V. Maddikunta, Souris Kondaveti, Margaret Viola. ”A Study of Oxidative Stress in Diabetes”. Journal of Evidence based Medicine and Healthcare; Volume 2, Issue 22, June 01, 2015; Page: 3315-3328.
ABSTRACT: Non-enzymatic free radical mediated oxidation of biological molecules, membranes and tissues is associated with a variety of pathological events such as cancer, aging and diabetes mellitus.[1] Increased oxidative stress is seen in both types of diabetes mellitus namely type 1 and
type 2, irrespective of duration, complications and treatment. In diabetes mellitus, oxidative stress seems primarily due to both an increased plasma free radical concentration and a sharp decline in antioxidant defences.[1] Among the causes of enhanced free radical production,
hyperglycemia and hyper insulinemia seem to play a major role,[2,3] Hyperglycemia is the more
easily modifiable factor among the two and good glycemic control can reduce the oxidative stress. Controversy persists regarding the other possible mechanisms of increased oxidative stress in diabetes and whether oxidative stress normalizes with adequate metabolic control alone. The role of oxidative stress and diabetic complications has been extensively investigated. Oxidative stress has been suggested to be involved in the genesis of both macro and micro angiopathy[4,5] Prospective trials are now underway addressing the controversial issues of possible
role of pharmacological antioxidants in preventing or at least delaying the onset of diabetic complications.
KEYWORDS: Diabetes mellitus, BMI = Body mass index, W/H Ratio = Waist/hip ratio, FPG = Fasting plasma glucose. FRUC = Fructosamine (glycosylated albumin), MDA = Malonaldehyde CAT = Catalase.
INTRODUCTION: AIM OF THE STUDY:
To compare the oxidative stress as measured by malonaldehyde and catalase between diabetics with non-diabetic controls.
To compare the oxidative stress between diabetic subjects with good glycemic control with those with unsatisfactory glycemic control.
To compare the oxidative stress among type 1 diabetic subjects with that of type 2 diabetic subjects.
ORIGINAL ARTICLE
J of Evidence Based Med & Hlthcare, pISSN- 2349-2562, eISSN- 2349-2570/ Vol. 2/Issue 22/June 01, 2015 Page 3316 INCLUSION CRITERIA FOR CASES:
Diabetic subjects of either sex.
No acute or chronic complications of diabetes. Age <50 years.
INCLUSION CRITERIA FOR CONTROLS: Non diabetic healthy subjects of either sex. Age<50 years.
EXCLUSION CRITERIA FOR CASES AND CONTROLS: Hypertension.
Smoking.
Chronic alcohol intake.
Any other acute or chronic illness. (Infections, inflammatory disorders, neoplasia, degenerative disorders and ischemic heart disease).
Taking pro-oxidants or anti-oxidants.
Taking drugs other than oral hypoglycemic agents or insulin. Diabetic complications.
Age> 50years.
STUDY PROTOCOL: An informed consent was taken from all selected subjects. A detailed history and physical examination were performed on all test subjects so as to exclude overt diabetic complications i, e. neuropathy nephropathy, retinopathy and vasculopathy, as well as any other illness, which would make them ineligible for participating in the study. The patients with complications were excluded in order to obviate the plausible effect of diabetic complications on oxidative stress and vice versa.
History elicited from subjects included: Duration of diabetes.
Details of treatment. Smoking history.
Details of alcohol/recreational drug consumption.
History pertaining to the macrovascular disease- angina, myocardial infarction, TIA, stroke, claudication or amputation.
History suggestive of nephropathy: polyurea, nocturia, oliguria and pedal edema.
History suggestive of neuropathy: sensory symptoms, motor symptoms and autonomic symptoms including impotence, giddiness and palpitations.
Visual disturbances.
History of fever (to exclude infections).
ORIGINAL ARTICLE
J of Evidence Based Med & Hlthcare, pISSN- 2349-2562, eISSN- 2349-2570/ Vol. 2/Issue 22/June 01, 2015 Page 3317
(Note: The measurement for waist is taken at the midpoint between iliac crest and costal margin. The measurement for hip is taken at the level of greater trochanter of the femur.)
Supine and standing pulse rate and blood pressure recording (to exclude autonomic neuropathy).
Palpation of all peripheral pulses to exclude peripheral vascular disease. A detailed neurological examination to detect neuropathy.
Examination of other systems to detect evidence of other overt diseases. All patients were subjected to investigations. The investigations included: FPG (fasting plasma glucose), Fructosamine, Malonaldehyde, Catalase, CUE, ECG, Serum Creatinine.
The blood sample for estimation of malonaldehyde and catalase was drawn in a fasting state (it has been shown that eating food increases oxidative stress). All test subjects underwent post mydriatic fundus examination to detect retinopathy. The presence of other latent diabetic complications was not specifically investigated. The test subjects included a heterogenous group of patients, with varying duration of illness, varying degrees of glycemic control and compliance with the treatment. The social, educational and financial background of patients was vastly different among the test subjects themselves and between the test subjects and control group.
The subjects included in control group were similarly evaluated. Only subjects who are <50years old, non-smokers, non-alcoholics, with no hypertension, diabetes mellitus or other acute/chronic illnesses and not taking any drugs were included.
The procedures adopted for biochemical investigations are described below:
ESTIMATION OF PLASMA GLUCOSE: Trinder’s method is used. (Trinder’s P, Ann. of clin. Biochem 6, 24, 1969)
Principle: The aldehyde group of D-glucose is oxidized by glucose oxidase to give gluconic acid and hydrogen peroxide.
D-glucose + H20 + 02-> Gluconic acid + H202
H202 + Phenol + 4-amino antipyrine -> Red dye + 2H20
The intensity of the red colour formed is proportional to the glucose concentration and can be measured photometrically between 460 and 560 nm.
Reagent composition:
ORIGINAL ARTICLE
J of Evidence Based Med & Hlthcare, pISSN- 2349-2562, eISSN- 2349-2570/ Vol. 2/Issue 22/June 01, 2015 Page 3318 Stability of glucose: Glucose is stable in serum or plasma for 24h at 4*C and 4h at 30*C. For long-term storage samples should be placed in sealed containers and frozen at -10*C.
ASSAY PROCEDURE:
Pipette into the tubes marked Blank Standard Test 1. Working reagent 1000µl 1000 µl 1000 µl
2. Distilled water 10 µl
3. Standard 10 µl
4. Sample 10 µl
Mix well and incubate for 15min. at 37*C. Read the absorbance of standard and each sample against reagent blank at 510nm (500-540) or at 510/630nm for biochromic instruments.
Calculation: Glucose (mg/dl) = absorbance of sample x concentration of standard +absorbance of standard.
Linearity: The assay is linear up to 500 mg/dl. For higher concentrations it is recommended to dilute the samples with normal saline and repeat the assay. Multiply the results with the dilution factor.
Precautions: of 1. Avoiding direct sunlight was taken and 2. The readings were taken within l hr as the colour is stable for l hr.
Normal values: Fasting 65-110mg/dl Post prandial 90-130mg/dl.
DETERMINATION OF SERUM CATALASE ACTIVITY: Ref: Goth L, Clinica Chemica Acta, 196, 143-152, 1991.
Principle: A spectrophotometric assay for serum catalase activity was developed. It is a combination of optimized enzymatic conditions and spectophotometric assay of hydrogen peroxide based on the formation of its stable complex with ammonium molybdate.
Reagents:
Sodium potassium phosphate buffer (pH 7.4). Hydrogen peroxide substrate (30% H2O2). Ammonium molybdate (32.4mmol/l).
Procedure:
Pipette into tubes marked Test Blank 1 Blank2 Blank3
1. Serum 0.2ml 0.2ml - -
2. H202 substrate 1ml 1ml 1ml 1ml
3. Ammonium molybdate 1ml 1ml 1ml 1ml
4. Buffer _ _ 0.2ml 0.2ml
ORIGINAL ARTICLE
J of Evidence Based Med & Hlthcare, pISSN- 2349-2562, eISSN- 2349-2570/ Vol. 2/Issue 22/June 01, 2015 Page 3319
The yellow complex of molybdate and hydrogen peroxide is measured at 405nm against blank 3.
Calculation: Serum catalase activity (KU/1) = A (Test sample) - A (blank 1) x 271 -HA (blank2)- A (blank3) Note: A= absorbance.
The serum samples were stored at 4*C for 2h, or in a frozen state at -15*C to be processed within 2 days.
Precautions: Hemolysis was avoided since serum hemoglobin causes increase in absorbance and very high concentration of catalase in erythrocytes.
Normal range: 50.5±18.1 KU/I
ESTIMATION OF MALONALDEHYDE:
METHODOLOGY: Thiobarbituric acid reactive substance assay (TBRAS)
Principle: The malonaldehyde in the serum reacts with thiobarbituric acid in acidic medium and gives rise to colour complex (pink) which is measured at 532 nm against distilled water in a spectrophotometer (Bird, et al, 1983).
Reagents:
Thiobarbituric acid: (TBA) 0.67%. 0.9% saline
20% trichloracetic acid (TCA)
Procedure: Stepl: 0.5ml of serum and 0.5ml of 0.9%saline and 1.0ml of 20%TCA are mixed and centrifuged at 3000rpm for 30minutes.
Step 2: 1ml of the supernatant from stepl is added to 0.25ml of 0.67% TBA and kept in boiling water bath for 1 hour. Cool immediately in ice cold water. Absorbance taken at 530nm against distilled water.
Calculation: Malonaldehyde is calculated from its molar extinction coefficient (Malifouz et al 1986). Molar extinction coefficient of MDA in a 1cm cuvettle is 1.5 x 10⁵ m.
1mole of MDA gives 1.5xl05 O.D.
1millimole of MDA gives 1.5 x 10s O.D.
1micromole of MDA gives 1.5 x 10 -1 O.D.
1micromole solution contains 1 nanomole of MDA.
If 1 mole of solution gives 0.15 D., it has 1 nanomole of MDA.
In the test only 0.5ml of serum is taken, diluted to 2 mol out of which only 1ml was taken. So 0.25ml of serum was used in the test. Thus to express in nanomole% multiply the O.D. by (4 x 100)/0.15 of the O.D. of test x 4 x 100/0.15nanomoles%.
Precautions:
Care was taken to avoid haemolysis as intracellular MDA is very high. The test was performed within 24h as MDA in serum may disintegrate. Heating was being done precisely.
The reading of the colour was done within l hour though it is stable.
ORIGINAL ARTICLE
J of Evidence Based Med & Hlthcare, pISSN- 2349-2562, eISSN- 2349-2570/ Vol. 2/Issue 22/June 01, 2015 Page 3320 ESTIMATION OF SERUM FRUCTOSAMINE:
Method:Modified Winzler’s procedure.[47]
Principle: Proteins are precipitated from serum by perchloric acid. Protein bound hexose is estimated by the reaction of carbohydrate in phenol sulphuric acid reagent. Carbohydrates are dehydrated by concentrated sulphuric acid forming furfural or hydroxymethyl furfural. The later condenses readily with phenol to give coloured compound. Pentoses also get condensed to furfurals. All these give coloured compounds with phenol. However, since pentoses bound to proteins are negligible, the phenol-sulphuric acid reaction of serum protein bound sugar is taken as near approximation, as the amount of hexoses, which are protein, bound.
Reagents:
Stock standard galactose: 500mg/dl.
Working standard galactose solution: 1/20 dilution. 5% phenol (W/V).
0.l NaOH.
5% perchloric acid.
Concentrated sulphuric acid.
Procedure: 0.1ml of serum was mixed with 0.4ml of 5%perchloric acid and centrifuged for l0min at 3000rpm. Supernatant is decanted and the precipitate is washed in another.
1.5ml PCA, re centrifuged and decanted. The precipitate is then dissolved in 2ml of 0.1 NaOH. Then the following tubes ware set:
Reagent Test Blank
1. Test solution 0.4ml -
(Precipitate dissolved in 0.1NaOH)
2. 0.lNaOH - 0.4ml
3. 5% phenol 0.4ml 0.4ml
4. Concentrated H2S04 2ml 2ml
The reaction mixture is vortexed after full development of color which takes 40 minutes. The O.D. readings were recorded at 490nm in a spectrophotometer. Serum fructosamine is calculated from the standard curve.
Calculation: Fructosamine in mg% = O.D. Test/ O.D. Standard x strength of standard x 100/ volume of test.
(O.D. readings= optical density readings). Normal range; 187±30 mg/dl.
OBSERVATIONS, RESULTS AND DATA ANALYSIS: The data available after the work up of patients and controls was analysed as per the aim of the study. The subjects were divided into two major groups namely, the test group and the control group. The test group is further categorized into:
ORIGINAL ARTICLE
J of Evidence Based Med & Hlthcare, pISSN- 2349-2562, eISSN- 2349-2570/ Vol. 2/Issue 22/June 01, 2015 Page 3321
Well-controlled and poorly controlled diabetics based on the adequacy of glycemic control as assessed by fasting plasma glucose value. Subjects with fasting plasma glucose < 1 l0mg/dl arc included in the well-controlled group and those with fasting plasma glucose > 1 l0mg/dl are included in the poorly-controlled group. According to the above mentioned criteria, type l and type2 diabetic subjects are further divided into those with good glycemic control and those with
inadequate glycemic control. The data was analysed by using Duncan’s multiple range test for
analysis of variance. The probability is assessed, among the groups showing significant difference, using Mann-Whitney-U-Wilcoxon Rank Sum W test. Mann-Whitney U test is a non- parametric alternative to ‘t’ test, and is used to compare the data of 2 independent samples.
Parameter Test group Control Group P1 value
NUMBER OF SUBJECTS 52 31
AGE 28.23(+or-13.28) 25.77(+or-11.09)
MALE 19 15
FEMALE 33 16
BMI 20.01 (+or-4.65) 20.54(+or-2.01)
W/H RATIO 0.856(+or-0.072) 0.805(+or-0.057)
FRUCTOSAMINE 211.15(+or-75.45) 147.09(+or-26.39) 0.0000 MALONALDEHYDE 389.82(+or-150.77) 179.97(+or-21.06) 0.0000 CATALASE 31.17(+or-11.82) 41 (+or-8.69) 0.0000
FPG 130.75(+or-91.57) 72.58(+or-9.26) 0.0002
Table 1: Comparison of oxidative stress between diabetic subjects and controls
The test group in table 1 consisted of 52 subjects and included type 1 and type 2 diabetics as well as well-controlled and poorly controlled diabetics. The average age and the proportion of subjects who are females are more in test subjects when compared to controls. Table 1 show that FPG, fructosamine and parameters of oxidative stress namely malonaldehyde and catalase are significantly different among diabetics and controls. Whereas malonaldehyde, fructosamine and FPG are significantly higher in the diabetics compared to controls, catalase activity is significantly lower.
PARAMETER NIDDM IDDM P' VALUE
NUMBER OF 28 24
SUBJECTS MALE 15 4
FEMALE 13 20
AGE 39.21 (+or-5.57) 15.42(+or-6.06)
BMI 23.26(+or-3.46) 16.23(+or-2.49)
W/H RATIO 0.88(+or-0.067) 0.83(+or-0.07)
FPG 118.93(+or-67.48) 144.54(+or- 0.8832
ORIGINAL ARTICLE
J of Evidence Based Med & Hlthcare, pISSN- 2349-2562, eISSN- 2349-2570/ Vol. 2/Issue 22/June 01, 2015 Page 3322
MALONALDEHYDE 320.32(+or-99.59) 471.17(+or- 0.0001 CATALASE 161.16) 28.93(+or-5.10) 33.79(+or-16.30) 0.5181
Table 2: Comparison of oxidative stress between type 1 and type 2 diabetes mellitus
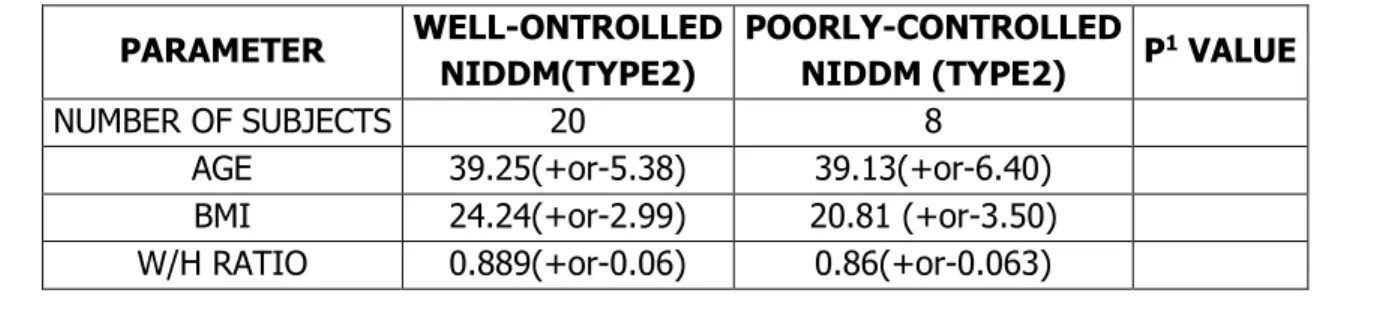
The average age, BMI, waist-hip ratio and the proportion of males is more in type2 diabetic group compared to type l diabetic subjects. More than 80% of the type l diabetics included in the study are females, whereas sex ratio is nearly equal in type2 diabetics. Table 2 shows that serum malonaldehyde level is more in type l diabetics than in type2 diabetics, while catalase activity is not significantly different among the two groups. As type l diabetics as a group had higher FPG and fructosamine levels, the increase in oxidative stress probably is because of poor glycemic control.
PARAMETER WELL-
CONTROLLED
POORLY-
CONTROLLED P' VALUE
NUMBER OF SUBJECTS 32 20
AGE 30.90(+or-12.13) 23.95(+or-14.21) BMI 21.32(+or-4.84) 17.93(+or-3.50) W/H RATIO 0.85(+or-0.07) 0.87(+or-0.06)
FPG 77.93(+or-22.99) 216.25(+or-95.63) 0.0000 MALONALDEHYDE 320.75(+or-98.34) 500.65(+or-155.79) 0.0000 CATALASE 32.53(+or-10.31) 29(+or-13.89) 0.0459
Table 3: Comparison of oxidative stress between well-controlled and poorly-controlled diabetics (FPG-based classification)
Table 3 illustrates the significantly increased malonaldehyde and significantly reduced catalase in poorly-controlled diabetics compared to diabetics with good glycemic control.
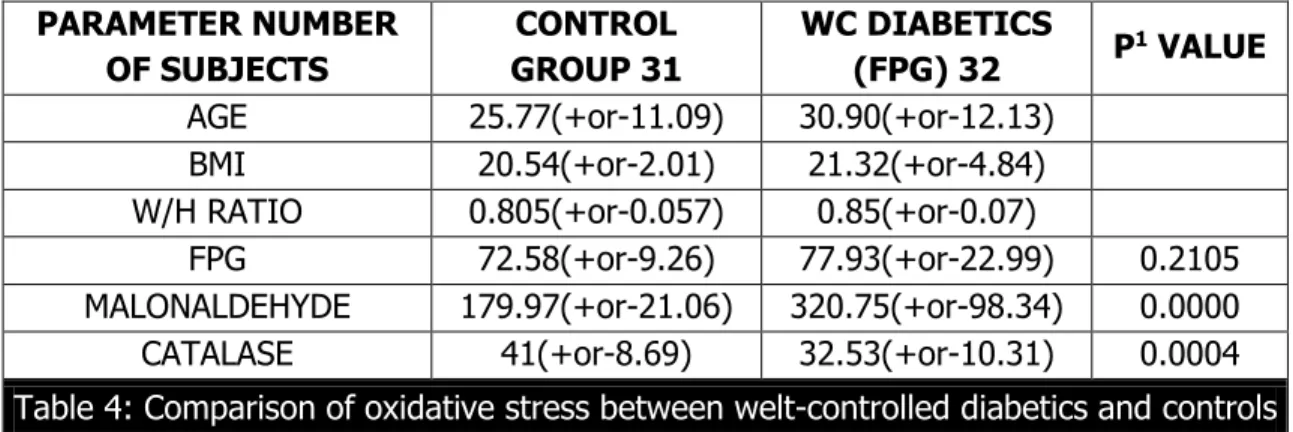
PARAMETER NUMBER OF SUBJECTS
CONTROL GROUP 31
WC DIABETICS
(FPG) 32 P
1 VALUE
AGE 25.77(+or-11.09) 30.90(+or-12.13)
BMI 20.54(+or-2.01) 21.32(+or-4.84)
W/H RATIO 0.805(+or-0.057) 0.85(+or-0.07)
FPG 72.58(+or-9.26) 77.93(+or-22.99) 0.2105 MALONALDEHYDE 179.97(+or-21.06) 320.75(+or-98.34) 0.0000 CATALASE 41(+or-8.69) 32.53(+or-10.31) 0.0004
Table 4: Comparison of oxidative stress between welt-controlled diabetics and controls
ORIGINAL ARTICLE
J of Evidence Based Med & Hlthcare, pISSN- 2349-2562, eISSN- 2349-2570/ Vol. 2/Issue 22/June 01, 2015 Page 3323
PARAMETER CONTROL GROUP POORLY-
CONTROLLED P' VALUE
NUMBER OF SUBJECTS 31 20
AGE 25.77(+or-11.09) 23.95(+or-14.21) BM1 20.54(+or-2.01) 17.93(+or-3.50) W/H RATIO 0.805(+or-0.057) 0.87(+or-0.06)
FPG 72.58(+or-9.26) 216.25(+or-95.63) 0.0000 FRUCTOSAMINE 147.09(+or-26.39) 217.75(+or-78.96) 0.0006 MALONALDEHYDE 179.97(+or-21.06) 500.65(+or-155.79) 0.0000 CATALASE 41 (+or-8.69) 29(+or-13.89) 0.0001
Table 5: Comparison of oxidative stress between controls and poorly-controlled diabetics (based on FPG)
Table 5 shows that the malonaldehyde is significantly higher and catalase significantly lowers in poorly controlled diabetics compared to the controls.
PARAMETER CONTROL
GROUP
WELL-CONTROLLED
NIDDM(type2) P
1 VALUE
NUMBER OF SUBJECTS 31 20
AGE 25.77(+or-11.09) 39.25(+or-5.38) BMI 20.54(+or-2.01) 24.24(+or-2.99) W/H RATIO 0.805(+or-0.057) 0.889(+or-0.06)
FPG 72.58(+or-9.26) 89.1 (+or-15.06) 0.0001 MALONALDEHYDE 179.97(+or-21.06) 283.80(+or-54.17) 0.0000 CATALASE 41(+or-8.69) 30.45(+or-4.67) 0.0000
Table 6: Comparison of oxidative stress between
well-controlled (FPG based) type2 diabetic subjects and controls
Table 6 shows that malonaldehyde is significantly higher and catalase is significantly lower in well-controlled type2 diabetics compared to controls.
PARAMETER CONTROL
GROUP
WELL-CONTROLLED
IDDM(TYPEI) P
1 VALUE
NUMBER OF SUBJECTS 31 12
AGE 25.77(+or-11.09) 17(+or-5.24) BMI 20.54(+or-2.01) 16.46(+or-3.09) W/H RATIO 0.805(+or-0.057) 0.79(+or-0.04)
FPG 72.58(+or-9.26) 57.67(+or-20.58) 0.0042 MALONALDEHYDE 179.97(+or-21.06) 382.33(+or-124.77) 0.0000 CATALASE 41 (+or-8.69) 36(+or-15.53) 0.3425
Table 7: Comparison of oxidative stress between well-controlled type1 diabetic subjects with controls
ORIGINAL ARTICLE
J of Evidence Based Med & Hlthcare, pISSN- 2349-2562, eISSN- 2349-2570/ Vol. 2/Issue 22/June 01, 2015 Page 3324
activity of the two groups is not significantly different. This observation contrasts with a significant decrease in catalase activity in well-controlled type l diabetics compared to controls.
PARAMETER CONTROL
GROUP
POORLY-CONTROLLED
NIDDM(TYPE2) P' VALUE
NUMBER OF SUBJECTS 31 8
AGE 25.77(+or-11.09) 39.13(+or-6.40) BMI 20.54(+or-2.01) 20.81 (+or-3.50) W/H RATIO 0.805(+or-0.057) 0.86(+or-0.063)
FPG 72.58(+or-9.26) 193.5(+or-89.75) 0.0000 MALONALDEHYDE 179.97(+or-21.06) 411.62(+or-130.23) 0.0000 CATALASE 41 (+or-8.69) 25.13(+or-4.26) 0.0000
Table 8: Comparison of oxidative stress between poorly-controlled type 2 diabetic subjects with controls
Table 8 shows that malonaldehyde is significantly higher and catalase activity significantly lower in poorly-controlled type2 diabetics vis a vis control group.
PARAMETER CONTROL
GROUP
POORLY-CONTROLLED
IDDM (TYPEI) P
1 VALUE
NUMBER OF SUBJECTS 31 12
AGE 25.77(+or-11.09) 13.83(+or-6.62) BMI 20.54(+or-2.01) 16.0(+or-1.82) W/H RATIO 0.805(+or-0.057) 0.87(+or-0.06)
FPG 72.58(+or-9.26) 231.42(+or-100.22) 0.0000 MALONALDEHYDE 179.97(+or-21.06) 560(+or-146.71) 0.0000 CATALASE 41 (+or-8.69) 31.58(+or-17.43) 0.0253
Table 9: Comparison of oxidative stress between poorly-controlled type1 diabetic subjects and controls
Table 9 shows that malonaldehyde is significantly higher and catalases significantly lower in poorly-controlled type l diabetics compared to controls. This contrasts with table 7 which showed that catalase activity is not significantly lower in well- controlled type l diabetics compared to controls.
PARAMETER WELL-ONTROLLED
NIDDM(TYPE2)
POORLY-CONTROLLED
NIDDM (TYPE2) P
1 VALUE
NUMBER OF SUBJECTS 20 8
AGE 39.25(+or-5.38) 39.13(+or-6.40)
ORIGINAL ARTICLE
J of Evidence Based Med & Hlthcare, pISSN- 2349-2562, eISSN- 2349-2570/ Vol. 2/Issue 22/June 01, 2015 Page 3325
FPG 89.1 (+or-15.06) 193.5(+or-89.75) 0.0000
MALONALDEHYDE 283.80(+or-54.17) 411,62(+or-130.23) 0.0038 CATALASE 30.45(+or-4.67) 25.13(+or-4.26) 0.0123
Table 10: Comparison of oxidative stress between well-controlled and poorly controlled NIDDM subjects
Table 10 shows that poorly-controlled type2 diabetics have significantly higher malonaldehyde and significantly lower fructosamine compared to the well-controlled type2 diabetic subjects, illustrating the role of glycemic control in determining the oxidative stress.
PARA METER
WELL- CONTROLLED IDDM (TYPE l)
POORLY- CONTROLLED IDDM(TYPE l)
P' VALUE
NUMBER OF SUBJECTS 12 12
AGE 17(+or-5.24) 13.83(+or-6.62)
BMI 16.46(+or-3.09) 16.0(+or-1.82) W/H RATIO 0.79(+or-0.04) 0.87(+or-0.06)
FPG 57.67(+or-20.58) 231.42(+or-100.22) 0.0000 MALONALDEHYDE 382.33(+or-124.77) 560(+or-146.71) 0.0000 CATALASE 36(+or-15.53) 31.58(+or-17.43) 0.0253
Table 11: Comparison of oxidative stress between well-controlled and poorly-controlled type1 diabetic subjects
Table 11 shows that the serum malonaldehyde levels are significantly higher and the catalase activity significantly lower in poorly controlled type l diabetics compared to well-controlled type l diabetics. Thus illustrating the role of glycemic control in influencing the oxidative stress
DISCUSSION: The measurement of oxidative stress of an individual should ideally involve estimation of concentration of all the oxidants and antioxidants.
In-vivo measurement of free radicals is difficult because of their high reactivity, "short half-life and very low concentration.[6] Thus indirect methods are usually used for measuring the
secondary products of oxidative stress viz. TBARs (Thiobarbituric acid reactive substances). TBAR assay[7] is the method used to estimate malonaldehyde, which is a marker of lipid peroxidation.
The malonaldehyde production and hence its serum concentration increases with increased oxidative stress.
ORIGINAL ARTICLE
J of Evidence Based Med & Hlthcare, pISSN- 2349-2562, eISSN- 2349-2570/ Vol. 2/Issue 22/June 01, 2015 Page 3326
patient. Various studies have shown conflicting results pertaining to the concentrations of antioxidant enzymes and chain breaking antioxidants in patients with diabetes.
In our study we have estimated serum malonaldehyde and serum catalase activity in diabetic patients as well as in non-diabetics. We wished to test the hypothesis that diabetics have increased oxidative stress and hence are expected to have higher levels of serum malonaldehyde and lower level of serum catalase activity compared to matched non-diabetics. The study results are consistent with our assumption.
The average serum malonaldehyde in control group is 179.97nmol/l, in test group it is 389.82nmol/l, in well-controlled diabetics it is 320.75nmol/l and in poorly-controlled diabetics it is 500.65nmol/l. The data analysis revealed a significantly higher MDA level in poorly controlled diabetics compared to controls (p,0.0000) and well- controlled diabetics (p,0.0000). The MDA concentration in well-controlled diabetics is also significantly higher than in controls (p,0.0000). Several other studies have shown increased MDA in diabetes.
Altomere E, Vandemiale G, Chicco D, Procacci V and Cirelli F(8) have shown a significant
increase in plasma malonaldehyde concentration in poorly-controlled diabetics when compared to well-controlled diabetics (p< 0.001) and healthy normoglycemic subjects(p<0.001). No significant difference was observed between well-controlled diabetics and controls which contrasts with our study as well as a study by S.N. Chugh. This group has shown a positive correlation between plasma malonaldehyde concentration and mean daily blood glucose (p<0.01), plasma fructosamine (p<0.001) and HbAl(p<0.05). They have also shown normalized plasma lipid peroxide values 72h after restoration of glycemic control.
In a recent study, S.N. Chugh, R. Kakkar, S. Kalra and Anjali Sharma[9] have measured
malonaldehyde in uncontrolled diabetics and repeated the measurement in the same patients after achieving acceptable control. This study showed a decrease in the concentration of malonaldehyde level after achieving control (p<0.001), but normalization of oxidative stress was not achieved. They did not include controls in the study design. Our results are similar to this study. Other studies whose design is not similar to our study have also shown increased oxidative stress in diabetes mellitus.[10,11]
In general, antioxidant enzymes such as catalase, superoxide dismutase and glutathione peroxidase have been reported to be decreased, increased or unaltered in various tissues of diabetic animals, with wide variations from one tissue to another [12,13,14] These discrepancies may
depend on variations in enzyme activity over time (compensatory increases in enzyme activity to face raised oxidative stress), as well as the type of tissue under examination. Thus, depending on the particular moment of the analysis and the particular tissue examined, one could obtain divergent results.
ORIGINAL ARTICLE
J of Evidence Based Med & Hlthcare, pISSN- 2349-2562, eISSN- 2349-2570/ Vol. 2/Issue 22/June 01, 2015 Page 3327
The catalase activity is shown to be increased in vascular beds (Pieper GM, Jordan M, Dondlinger LA, Adams MB, Roza AM, and cardiac tissue (Wohaiaeb SA, Godin DV [14]) of
experimental animals.
Controversy persists as to whether good control of diabetes normalizes the oxidative stress or only decreases oxidative stress without normalizing it, suggesting that there are other mediators of oxidative stress apart from hyperglycemia. We did not study patients before and after control but there is evidence suggesting normalization of oxidative stress (Altomere et al.), as well as persistent oxidative stress (S. N. Chugh et al.) after adequate control.
Although the theoretical basis exists to reduce oxidative stress in diabetic patients, there are no reported studies examining the effects of antioxidants on the cardiovascular events and mortality in diabetics. However the results of short term clinical trials evaluating the effects of antioxidants on surrogate end points (protein glycation, glucose and lipid metabolism, hemorheology, blood pressure) seem promising.[10,11] It is unclear whether these short-term
beneficial effects of antioxidants will ameliorate the poor cardiovascular outlook for diabetic patients. The data is preliminary to support/suggest routine prescription of antioxidants to diabetics. Antioxidants are rather large and actively cooperating family of chemical substances and it is probably wrong to concentrate on any one antioxidant. Although, an antioxidant mixture, yet to be defined, to optimize the antioxidant potential would probably be the best choice, only population based randomized intervention trails will tell us whether this novel therapeutic approach is of value in the prevention and treatment of diabetic complications. In the mean-time a balanced diet rich in fruits and vegetables and avoidance of smoking are suitable mechanism to reduce oxidative stress.
CONCLUSION: The oxidative stress, as measured by malonaldehyde (a lipid peroxidation product) and catalase (an antioxidant enzyme), is more in diabetic patients compared to the controls. The oxidative stress in poorly-controlled diabetics is significantly more than that in well-controlled diabetics. Though the oxidative stress in well-well-controlled diabetics is less than in poorly controlled diabetics, it still is significantly higher than oxidative stress in controls.
Acknowledgement: I am much honored to thank my institution for granting this work. I want to thank also the participants for their willingness to participate in the study.
REFERENCES:
1. Cross CE, Halliwell B, Borish ET et al. Oxygen radicals and human disease. Ann Intern Med 1987; 107: 526-45.
2. Giugliano D, Paolisso G, Giugliano D. Oxidative stress and diabetic vascular complications. Diabetes Care 1996; 19: 258-67.
3. Paolissa G, Giugliano D. Oxidative stress and insulin action: is there a relationship? Diabetologia 1996; 39: 357-63.
4. Cohen RA. Dysfunction of vascular endothelium in diabetes mellitus. Circulation 1993; 87(suppl5): 67-76.
ORIGINAL ARTICLE
J of Evidence Based Med & Hlthcare, pISSN- 2349-2562, eISSN- 2349-2570/ Vol. 2/Issue 22/June 01, 2015 Page 3328
6. Asayama K, Uchida N, Nakane T, etal. Antioxidants in the serum of children with IDDM. Free Rad Biol Med 15: 597-602, 1993.
7. Paolisso G, D’Amore A, Guigliano D et al. Daily Vitamin E supplements improve metabolic control but not insulin secretion in elderly type2 diabetic patients. Diabetes Care 16: 1433-1437, 1993.
8. Tsai EC, Hirsch IB, Brunzell JD, Alan C: Reduced plasma peroxyl radical trapping capacity and increased susceptibility of LDL to oxidation in poorly controlled IDDM. Diabetes: 43: 1010-1014, 1994.
9. Coppola L, Grassia A, Giunta R et al. Glutathione improves hemostatic and hemorheological parameters in atherosclerotic subjects. Drugs Exp Clin Res 18: 493-498, 1992.
10.Paolisso G, Gambardella A, Guigliano D et al. Chronic intake of pharmacological doses of Vitamin E might be useful in the therapy of elderly patients with coronary heart disease. Am J Clin Nutr 61: 848-852, 1995.
11.Bambolkar S, Sainani GS. Evaluation of oxidative stress in diabetes with and without vascular complications. JAPI 1995; 42: 10-2.
12.Crouch R, Kimsey G, Priest DG et al. Effect of streptozocin on erythrocyte and retinal superoxide dimutase. Diabetologia 15: 53-57, 1978.
13.Matkovics B, Varga S, Szabo L, Witas H: The effect of diabetes on the activities of the peroxide metabolism enzymes. Horm Metab Rea 14: 77-79, 1982.
14.Woheib SA, Godin DV: Alterations in tissue antioxidant systems in the spontaneously diabetic rat. Can J Physol Pharmacol 65: 2191-2195, 1987.
4. Assistant Professor, Department of Pharmacology, Osmania Medical College/Hospital.
5. Assistant Professor, Department of Pharmacology, Osmania Medical College/Hospital.
NAME ADDRESS EMAIL ID OF THE CORRESPONDING AUTHOR:
Santhoshi Sammeta, Post Graduate,
Department of Chemistry,
Gitam University, Visakhapatnam. E-mail: [email protected]
Date of Submission: 23/05/2015.
Date of Peer Review: 24/05/2015. Date of Acceptance: 27/05/2015. Date of Publishing: 01/06/2015.
AUTHORS:
1. Babu Rao Rentapalli
2. Santhoshi Sammeta
3. Sridhar V. Maddikunta 4. Souris Kondaveti 5. Margaret Viola
PARTICULARS OF CONTRIBUTORS:
1. Assistant Professor, Department of Bio-Chemistry, Osmania Medical College/Hospital.
2. Post Graduate, Department of Chemistry, Gitam University, Visakhapatnam.