Hemorrhagic Septicemia virus (VHSv) with a Two-Color
Fluorometric Real-Time PCR Assay
Lindsey R. Pierce1., James C. Willey2., Vrushalee V. Palsule1
, Jiyoun Yeo2, Brian S. Shepherd3, Erin L. Crawford2, Carol A. Stepien1*
1Great Lakes Genetics/Genomics Laboratory, Lake Erie Center and Department of Environmental Sciences, The University of Toledo, Toledo, Ohio, United States of America,2Department of Medicine, The University of Toledo, Toledo, Ohio, United States of America,3ARS/USDA/University of Wisconsin at Milwaukee/School of Freshwater Sciences, Milwaukee, Wisconsin, United States of America
Abstract
Viral Hemorrhagic Septicemia virus (VHSv) is one of the world’s most serious fish pathogens, infecting .80 marine, freshwater, and estuarine fish species from Eurasia and North America. A novel and especially virulent strain – IVb – appeared in the Great Lakes in 2003, has killed many game fish species in a series of outbreaks in subsequent years, and shut down interstate transport of baitfish. Cell culture is the diagnostic method approved by the USDA-APHIS, which takes a month or longer, lacks sensitivity, and does not quantify the amount of virus. We thus present a novel, easy, rapid, and highly sensitive real-time quantitative reverse transcription PCR (qRT-PCR) assay that incorporates synthetic competitive template internal standards for quality control to circumvent false negative results. Results demonstrate high signal-to-analyte response (slope = 1.0060.02) and a linear dynamic range that spans seven orders of magnitude (R2= 0.99), ranging from 6 to 6,000,000 molecules. Infected fishes are found to harbor levels of virus that range to 1,200,000 VHSv molecules/ 106actb1molecules with 1,000 being a rough cut-off for clinical signs of disease. This new assay is rapid, inexpensive, and has significantly greater accuracy than other published qRT-PCR tests and traditional cell culture diagnostics.
Citation:Pierce LR, Willey JC, Palsule VV, Yeo J, Shepherd BS, et al. (2013) Accurate Detection and Quantification of the Fish Viral Hemorrhagic Septicemia virus (VHSv) with a Two-Color Fluorometric Real-Time PCR Assay. PLoS ONE 8(8): e71851. doi:10.1371/journal.pone.0071851
Editor:Jianming Qiu, University of Kansas Medical Center, United States of America
ReceivedApril 19, 2013;AcceptedJuly 3, 2013;PublishedAugust 20, 2013
This is an open-access article, free of all copyright, and may be freely reproduced, distributed, transmitted, modified, built upon, or otherwise used by anyone for any lawful purpose. The work is made available under the Creative Commons CC0 public domain dedication.
Funding:This research was funded by the following grants: NOAA Ohio Sea Grant#R/LR-015 (to CAS, JCW), USDA-NIFA (CSREES)#2008-38927-19156,# 2009-38927-20043,#2010-38927-21048 (to CAS, JCW), USDA-ARS CRIS project#3655-31320-002-00D, under the specific cooperative agreement#58-3655-9-748 A01 (to CAS, JCW, BSS), R21 CA 138397 (to JCW), NSF GK-12#DGE-0742395 (to CAS), and NSF-DDIG#1110495 (to LRP, CAS). The funders had no role in study design, data collection and analysis, decision to publish, or preparation of the manuscript.
Competing Interests:The authors have declared that no competing interests exist.
* E-mail: [email protected]
.These authors contributed equally to this work.
Introduction
Molecular diagnostic tools have facilitated the early detection, prevention, and spread of many important pathogens [1], led by the speed, sensitivity, and accuracy of Polymerase Chain Reaction (PCR)-based assays [2]. Their ability to diagnose targeted genetic sequences and quantify levels of infectious agents with hybridiza-tion probes has advanced screening technology for multiple human diseases, including influenza, hepatitis, and HIV [3,4]. Use of these approaches to elucidate and characterize plant and animal pathogens likewise is growing at a rapid pace [5,6].
Viral Hemorrhagic Septicemia virus (VHSv) causes one of the world’s most serious finfish diseases, infecting.80 species across the Northern Hemisphere [7], yet there remains a need for a fast, sensitive, accurate, and inexpensive diagnostic test. VHSv is a
negative-sense, single stranded RNA Novirhabdovirusof , 12,000
nucleotides, with six open reading frames of 39N-P-M-G-Nv-L’5 [8]. Infected fishes often swim erratically and have bulging eyes, distended abdomens, and extensive external/internal hemorrhag-ing [9]. The virus survives for up to 13 days in the water [10], and can be spread via ballast water, boating, equipment, and aquatic animals (e.g. birds, turtles, leeches, and amphipod crustaceans)
[11–14]. It is transmitted most readily during the spring spawning season through fish waste, reproductive fluids, and skin secretions [11].
VHSv first was described in the late 1930s as ‘‘ Nierenschwel-lung’’ in aquacultured rainbow trout (Oncorhynchus mykiss) from Europe [15]. It now occurs across the Northern Hemisphere as four genetically and geographically distinct strains (I–IV) and substrains, whose evolutionary and biogeographic patterns recently were analyzed by Pierce and Stepien [16]. Strains I– III primarily occur in Europe, where they infect a wide variety of marine, estuarine, and freshwater fishes. Strain IV (now classified as IVa; [17]) first was discovered in 1988 from North American Pacific coastal fishes, including salmonids [18,19], and now also occurs in Japan [20]. In 2000, another IV substrain (now designated as IVc per [16]) was discovered off the coast of New Brunswick, Canada, infecting the estuarine mummichog (Fundulus heteroclitus) and three-spined stickleback (Gasterosteus aculeatus) [21]. In 2003, a new and especially virulent substrain,
IVb, was described from a moribund muskellunge (Esox
throughout all five of the Great Lakes, infecting .30 species, including many commercially and ecologically important fishes, such as muskellunge, drum (Aplodinotus grunniens), walleye (Sander vitreus), yellow perch (Perca flavescens), and round goby (Neogobius melanostomus). Substrain IVb now contains at least 16
glycopro-tein (G)-gene sequence variants [22], whose rapid spread and
diversification in a quasispecies mode suggest that this strain mutates rapidly and may be highly adaptable (see [16]).
To avoid outbreaks of the virus, the Aquatic Invasive Species Action Plan [23] requires that aquaculture and baitfish vendors from U.S. states (Illinois, Indiana, Michigan, Minnesota, New York, Ohio, Pennsylvania, and Wisconsin) and Canadian prov-inces (Ontario and Quebec) have their fish products certified as VHSv-free prior to interstate or international transport. Cell culture is the VHSv diagnostic that is approved by the World Organization for Animal Health [24], along with the joint Fish Health Section of the U.S. Fish and Wildlife Service and the American Fisheries Society [25]. The cell culture process takes a month or longer for cell growth, cell confluency, viral growth, and confirmation PCR. It moreover lacks the sensitivity to detect low viral concentrations in carrier fish, and results in false negative levels reported as 43–95% [26–28].
Real-time quantitative reverse transcription (qRT)-PCR assays for detecting VHSv [26–34] likewise have substantially high false negative rates that ranged from 15–92% [26–28]. The high false negative rates in those assays may have resulted from unknown and/or unmonitored effects from interfering substances in the PCR or reverse transcription reactions (rxn), which circumvented detection of the target gene [35].
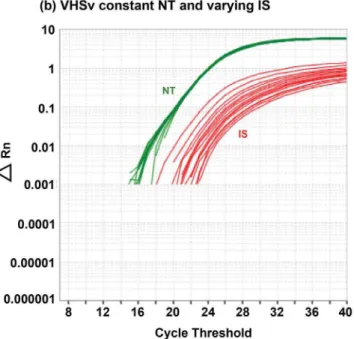
To avoid those issues, the present research describes and evaluates a new, accurate, fast, and highly reliable assay to diagnose and quantify VHSv. This assay uses Standardized Reverse-Transcriptase Polymerase Chain Reaction, i.e. StaRT-PCR, which is a form of competitive template RT-PCR that yields rapid, reproducible, standardized, and quantitative measurement of data for many genes simultaneously [36]. StaRT-PCR uniquely incorporates internal standards (IS) in the rxn mixture to improve accuracy and circumvent false negative results. Our new assay is based on real-time PCR equipment that is readily available in most diagnostic laboratories, markedly improving on a previous version of our VHSv test [37], which also used StaRT-PCR, but relied on less common capillary electrophoresis equipment (i.e. Agilent; Agilent Technologies, Santa Clara, CA). In the present study, results from both assays are evaluated by us to determine the presence or absence of VHSv and measure concentration of the virus from fish samples in targeted field and laboratory studies. We assay the VHSv nucleoprotein (N)-gene and the fish reference beta-actin 1 (actb1) gene, assessing amplification relative to known numbers of their respective competitive IS molecules. Our new approach uses sequence specific fluor-labeled hydrolysis probes that can be used on a variety of real-time PCR thermal cyclers, on which positive VHSv results are visible as two colors on the real-time PCR plot (see Figure 1a; green = native template (NT), red = IS).
Results of this 2-color fluorometric assay are compared to those from our previously reported Agilent capillary
electropho-resis test [37], SYBRH green qRT-PCR, and cell culture [24],
using the same biological samples. The numbers of VHSv molecules are quantified from field-caught and laboratory-challenged VHSv-infected fish samples with the new 2-color fluorometric assay in comparison to the Agilent capillary electrophoresis test [37].
Materials and Methods
VHSv Assay Development
All primers and NT probes were matched to homologous
sequences of the VHSvN-gene, based on all VHSv strains and
substrain variants from NIH GenBank (http://www.ncbi.nlm.nih. gov/genbank/) and the literature, using Biosearch Technologies
Real Time Design software (Novato, CA; http://www.
biosearchtech.com/). The original muskellunge isolate MI03GL from the Great Lakes (GenBank Accession no. DQ427105) served
as the reference for VHSv, andactb1mRNA from the yellow perch
Perca flavescens (AY332493) was used as the fish reference gene sequence. Selection criteria included: product lengths that were
,100 bp, with optimal melting temperatures of 65–68uC for
primers and 68–72uC for probes. NT probes for the target and
reference genes were labeled with FAM (fluorescein amidite dye).
The competitive template IS probes for the VHSvN-gene and
the fish referenceactb1gene each were constructed by altering 5– 6 bp of the NT probe sequences, and were labeled with Quasar dye having 670 nm maximum absorbance (Biosearch Technolo-gies). The IS probes were designed to: minimize cytosine and
thymine (30%), maximize adenine (50%), avoid guanine at the 59
end, have lengths ,24 bp, and have predicted melting
temper-atures60.02uC of the NT probe. Synthetic NT and IS templates
for VHSv and actb1 were assembled by combining the forward
primer, probe, and connecting sequence through the reverse primer (Table 1), and were synthesized by Life Technologies
(Grant Island, NY; http://www.lifetechnologies.com/us/en/
home.html). The BLAST procedure (http://blast.ncbi.nlm.nih. gov/Blast.cgi) was employed to verify that all primers, probes, and IS did not recognize other viral or fish DNA sequences.
To ensure that the probes did not bind to non-homologous template, their specificities were tested using synthetic templates
for the VHSvN- and actb1genes. Both synthetic templates (NT
and IS) were serially diluted 10-fold from 10211 M to 10215M
and tested with all probes in PCR amplification experiments, following the directions for ‘‘Performing the VHSv Assay’’, as
detailed below. For example, the VHS N-gene IS synthetic
template was evaluated with the VHSN-gene IS probe, as well as
the VHSN-gene NT probe, and vice versa. The same was done
for actb1. Cycle thresholds (Ct) from the homologous and
non-homologous templates were compared at each dilution, and the non-homologous amplifications were calculated with formula 2(2DCt)and multiplied by the known number of input copies. If
the resulting numbers of molecules were .10% of the known
input copy number, then the probe was re-designed, and the process was repeated.
After synthesis, the NT and IS for each gene were PCR amplified (Table 1) in 10 individual 10ml rxns, containing 1ml 750 nM of each primer, 0.5 U Go-TAQ polymerase (Promega,
Madison, WI), 1ml 10X MgCl2PCR buffer, 0.2 mM dNTPs, and
RNAse-free water on a Rapid Cycler 2 (Idaho Technology, Inc., Salt Lake City, UT; www.biofiredx.com/). Rxns were run for 35 cycles of 5 sec at 94uC, 10 sec at 58uC, and 15 sec at 72uC, with a slope of 9.9. To purify the NT and IS, all 10 replicate PCR products per template were combined into a single tube, loaded onto individual 2% low melting pre-cast agarose gels from E-Gel iBase (Invitrogen, Grand Island, NY; www.invitrogen.com/), separated by electrophoresis, and visualized on a UV
transillumi-nator. The NT and IS bands for the VHSvN- and actb1 genes
triplicate, and converted into molarities according to the formula (1):
Molaritytconcentration (mg=ml)s=
tmolecular wt:(mg=mmole)s ð1Þ
To control for inter-sample and inter-experimental pipetting variation, a synthetic internal standard mixture (ISM) was created with the purified IS described above. To prepare the original stock ISM ‘‘A’’, we estimated the relative concentrations of the VHSvN
-gene and actb1 IS needed to achieve a 1:1 cDNA NT:IS
relationship in a variety of samples (Table 2). Briefly, we mixed 10210M of the VHSvN-gene IS and 10211M of theactb1IS in an initial stock, labeled ISM ‘‘A’’. To measure various levels of gene expression, other ISM mixtures (ISM B–H) were constructed using 10-fold serial dilutions of the VHSv N-gene relative to a constant concentration of theactb1gene IS at 10211M (Table 2). Additional 10-fold dilutions of each ISM (A–H) stock then were made with 0.1 ng/ml yeast tRNA carrier (Invitrogen, Carlsbad, CA) to prevent adherence of negatively charged IS molecules to the tube or pipette tip surfaces (Table 2, rows 2–8).
An External Standardized Mixture – ESM (comprised of the
synthesized NT and IS for the VHSvN- andactb1genes) – was
made to control for inter-lot and inter-experimental variation in probe fluorescence intensity, guard against inter-experimental variation in Ctselection, and normalize the probe (see equation
(2), ‘‘Correction for variation in fluorescence among probes’’).
Stock ESM containing 10211M NT/10211M IS for the VHSv
N- and actb1 genes was diluted to a working concentration of
10213M NT/10213M IS and 10214M NT/10214M IS with
yeast tRNA (Invitrogen).
Fish Samples used to Evaluate the VHSv Assay
Spleen tissues from a variety of fish samples were used to test our assay for the presence and concentration of VHSv (and to compare our results to other assays, using the same samples). Fish were obtained, maintained, anesthetized, and sacrificed following the Institutional Animal Care and Use Committee (IACUC)
approved protocols from the University of Toledo (#106419),
Michigan State University (MSU; East Lansing, MI) (#AUF 07/
07-123-00), and the U.S. Geological Survey’s (USGS) Western Fisheries Research Center Challenge Facility (WFCCF; Seattle,
WA) (#2008-17). Fish were euthanized with an overdose of
25 mg/ml tricaine methanesulfonate (MS-222; Argent Chemical Lab, Redmond, WA) and decapitated to ensure death. To remove any external viral particles, each fish was washed separately by submerging it 3X in double distilled H2O. The surgical site (anus
to operculum) was disinfected with 100% ethanol and betadine using sterile equipment. Spleen tissue was removed, placed into individual 1.5 mL eppendorf tubes, flash frozen in liquid nitrogen or stored in RNAlater (Qiagen), and kept at280uC until further processing. Gloves and all equipment were changed between each fish to ensure sterile conditions. Specimens were disposed of following the respective approved biohazard protocols of the University of Toledo, MSU, and USGS.
Samples tested for VHSv included cDNA from 23 wild-caught Great Lakes fishes, including 10 infected and 13 negatives: two
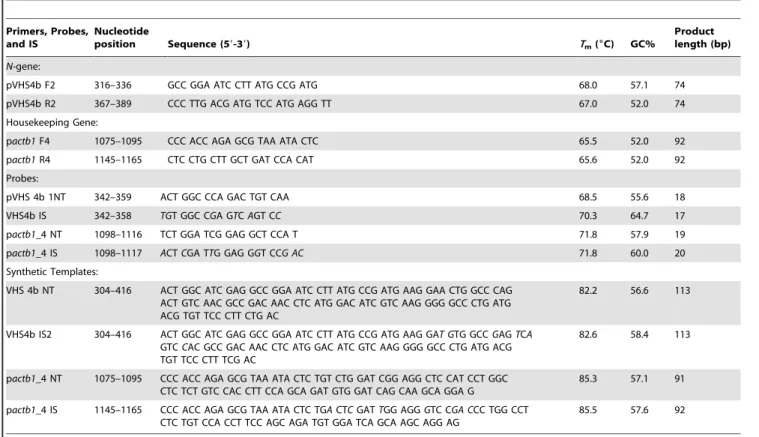
Table 1.Sequences and PCR parameters for our 2-color fluorometric VHSv assay.
Primers, Probes, and IS
Nucleotide
position Sequence (59-39) Tm(6C) GC%
Product length (bp)
N-gene:
pVHS4b F2 316–336 GCC GGA ATC CTT ATG CCG ATG 68.0 57.1 74
pVHS4b R2 367–389 CCC TTG ACG ATG TCC ATG AGG TT 67.0 52.0 74
Housekeeping Gene:
pactb1F4 1075–1095 CCC ACC AGA GCG TAA ATA CTC 65.5 52.0 92
pactb1R4 1145–1165 CTC CTG CTT GCT GAT CCA CAT 65.6 52.0 92
Probes:
pVHS 4b 1NT 342–359 ACT GGC CCA GAC TGT CAA 68.5 55.6 18
VHS4b IS 342–358 TGT GGC CGA GTCAGT CC 70.3 64.7 17
pactb1_4 NT 1098–1116 TCT GGA TCG GAG GCT CCA T 71.8 57.9 19
pactb1_4 IS 1098–1117 ACTCGA TTG GAG GGT CCG AC 71.8 60.0 20
Synthetic Templates:
VHS 4b NT 304–416 ACT GGC ATC GAG GCC GGA ATC CTT ATG CCG ATG AAG GAA CTG GCC CAG ACT GTC AAC GCC GAC AAC CTC ATG GAC ATC GTC AAG GGG GCC CTG ATG ACG TGT TCC CTT CTG AC
82.2 56.6 113
VHS4b IS2 304–416 ACT GGC ATC GAG GCC GGA ATC CTT ATG CCG ATG AAG GAT GTG GCCGAGTCA GTCCAC GCC GAC AAC CTC ATG GAC ATC GTC AAG GGG GCC CTG ATG ACG TGT TCC CTT TCG AC
82.6 58.4 113
pactb1_4 NT 1075–1095 CCC ACC AGA GCG TAA ATA CTC TGT CTG GAT CGG AGG CTC CAT CCT GGC CTC TCT GTC CAC CTT CCA GCA GAT GTG GAT CAG CAA GCA GGA G
85.3 57.1 91
pactb1_4 IS 1145–1165 CCC ACC AGA GCG TAA ATA CTC TGACTCGATTGG AGGGTC CGA CCC TGG CCT CTC TGT CCA CCT TCC AGC AGA TGT GGA TCA GCA AGC AGG AG
85.5 57.6 92
Primers, probes, internal standards (IS), and synthetic templates are specified. F = forward primer, R = reverse primer, NT = native template.Italics= modified nucleotides in NT probe.
doi:10.1371/journal.pone.0071851.t001
Table 2.Concentrations for the 2-color fluorometric VHSv assay.
A B C D E F G H
211/210 211/ 211 211/ 212 211/ 213 211/ 214 211/ 215 211/ 216 211/ 217
212/211 212/ 212 212/ 213 212/ 214 212/ 215 212/ 216 212/ 217 213/212 213/ 213 213/ 214 213/ 215 213/ 216 213/ 217 214/213 214/ 214 214/ 215 214/ 216 214/ 217
215/214 215/ 215 215/ 216 215/ 217 216/215 216/ 216 216/ 217 217/216 217/ 217
Dilution mixtures (A–H) used for the Internal Standards Mixture (ISM)actb1/ VHSv are given in units of 10xM.
bluegill (Lepomis macrochirus), a brown bullhead (Ameiurus nebulosus), a freshwater drum, seven largemouth bass (Micropterus salmoides), a
smallmouth bass (Micropterus dolomieu), and 11 lake herring
(Coregonus artedi). We also tested 40 fish from VHSv laboratory challenge experiments, including 20 muskellunge (15 VHSv infected and 5 negative controls) from the MSU-Aquatic Animal Health Laboratory (AAHL), and 20 yellow perch (14 VHSv-infected and 6 negative controls) from USGS-WFRCCF.
A series of laboratory challenge experiments were conducted by MSU-AAHL on certified VHSv-free juvenile muskellunge (Rath-burn National Fish Hatchery, Moravia, Iowa) under MSU IACUC protocols AUF 07/07-123-00. Muskellunge were chal-lenged via water immersion for 90 min with VHSv-IVb (isolate MI03GL) at 4.06103pfu/ml, and the negative controls with 1 ml sterile maintenance minimum essential media. Fish then were placed into clean VHSv-free water, and later randomly sacrificed at pre-determined intervals, as previously described.
We also analyzed RNA from a series of juvenile yellow perch laboratory challenge experiments, using six-month-old (VHSv-certified-free) Choptank broodstrain [42] from the University of Wisconsin-Milwaukee’s Great Lakes WATER Institute (Milwau-kee, WI), which were conducted at USGS- WFRCCF under their 2008–17 IACUC protocol. Perch were challenged either via
intra-peritoneal injection of 1.06105pfu/ml VHSv-IVb (strain
MI03GL) or with immersion for two hours in the same dosage, while control groups had a dose of minimum essential media. Fish were selected randomly in days 0–6 for euthanization with
240 mg/L MS-222 and 1.2g/L NaHCO3. Dissection followed
protocols described above.
Performing the VHSv Assay
Spleen tissue (0.25–0.50 g) was ground using a sterile mortar and pestle under liquid nitrogen, and its RNA was extracted with Table 3.Specificity of the 2-color fluorometric test.
Type Isolate Result
Human:
Encephalomyocarditis virus –
Vesicular Stomatitis virus –
Fish:
Hirame rhabdovirusa –
Infectious Hematopoietic Necrosis virus (strain 220-90)a –
Infectious Pancreatic Necrosis virus –
Snakehead rhabdovirusa –
Spring Viremia of Carp virusa –
VHSv:
I DK-F1b
+
Ia FR0771b
+
Ia JP96KRRV9601b
+
II FI-ka663-06c
+
III GH35d
+
III GH 44d
+
III SC2645d
+
III SM2897d +
IVa Bogachielb
+
IVa Cod’91b
+
IVa Elliott Bayb
+
IVa JP96Obamab
+
IVa Makahb
+
IVa Orcasb
+
IVb MI03GLa,b
+
IVb vcG002a
+
IVb vcG003a
+
IVb vcG004a
+
IVb vcG005a
+
IVb vcG006a
+
IVb vcG007a
+
IVb vcG008a
+
IVb vcG009a
+
IVb vcG010a
+
IVc CA-NB00-02e
+
– = negative result (no amplification),+= positive result. Isolates obtained from:
aWestern Fisheries Research Center, USGS, Seattle, WA, USA. bCornell University College of Veterinary Medicine, Ithaca, NY, USA. cFinnish Food Safety Authority Evira, Finland.
dUniversidad de Santiago de Compostela, Spain.
eFisheries and Oceans Canada, Pacific Biological Station, BC, Canada. doi:10.1371/journal.pone.0071851.t003
Figure 2. True accuracy of the 2-color fluorometric test.Results are based on % positives from 10 separate runs of 12 dilutions using a known Internal Standard Mixture (ISM). Dilutions are: 40, 20, 10, 7, 6, 5, 4, 2, 1, 0.7, 0.4, and 0.1 molecules. The 2-color fluorometric test yields 100% positives for (a)$5 molecules of VHSv and (b)$4 molecules for actb1.
the TriREAGENTH (Molecular Research Center, Inc.,
Cincin-nati, OH) protocol. The RNA was re-suspended in 30ml
RNase-free water, quantified with a NanoDrop 2000 Spectrophotometer
(Thermo Fisher Scientific, Waltham, MA), and adjusted to a 1mg
RNA/ml concentration. DNA-freeDNase Treatment and Removal
Reagents (Ambion Life Technologies, Grand Island, NY) were used to eliminate any contaminating gDNA. The purified RNA
was reverse-transcribed to cDNA with 1mg RNA, 5X First Strand
buffer, 10 mM dNTPs, 0.05 mM random hexamers, 25 U/ml
RNasin, and 200 U/ml M-MLV in a 90ml rxn volume at 94uC for
5 min, 37uC for 1 h, and 94uC for 5 min. The cDNA was stored at –20uC.
A set of PCR rxns was run per each cDNA sample to determine the appropriate concentrations of NT and IS foractb1to achieve a ratio of.1:10 and,10:1 of amplified products. Once the NT:IS
products were in balance, the VHSv N- andactb1 target genes
were pre-amplified simultaneously to increase the signal (i.e. lower Ct) relative to non-specific background.
For each pre-amplification, a 10ml volume of a master mixture
was prepared with 5ml TaqManH Universal Master Mix II
(without uracil N-glycosylase; Applied Biosystems International
(ABI), Grand Island, NY), 1ml of 10X primer solution (final
concentration: 75 nM) of the forward and reverse primers for the VHSNandactb1genes (mixed together), and RNAse-free water. Eightml of this master mixture was dispensed into individual wells
of 0.1 mL 96-well TempPlateH (USA Scientific, Inc.; www.
usascientific.com/) containing 1ml cDNA and 1ml of the
appropriate ISM concentration (Table 2). This was done in triplicate to allow calculation of the mean and standard error (S.E.)
of the relative VHSvN-gene concentration/106 actb1 molecules
per fish sample. The plates then were sealed with a TempPlateH
RT Optical Film and centrifuged for 2 min at 2000 rpm. PCR rxns were conducted on an ABI 7500 Fast using standard mode cycling conditions: 10 min at 95uC, followed by 13 cycles of 15 sec
at 95uC and 1 min at 60uC. For the Poisson distribution
experiments, 25 pre-amplification cycles were used due to lower
Figure 3. Relationship between the number of observed and expected molecules for NT:IS concentrations of 1:1–1:20. The concentration of Native Template (NT) is held constant and the Internal Standard (IS) varied for dilutions of: 1:1 (66104molecules), 1:2, 1:3, 1:4, 1:5, 1:6, 1:7, 1:8, 1:9, 1:10, 1:12, 1:14, 1:16, 1:18, and 1:20 (36103molecules). The 2-color fluorometric assay yields a linear relationship for (a) VHSv (R2= 0.99, F =1514.00, df = 1, 13,p,0.001) with a mean CV of 5% for dilutions 1:1–1:10 and 7% for concentrations down to 1:20, and for (b)actb1(R2= 0.99, F =1283.00, df = 1, 13,p,0.001), CV = 5% and 7%. The same linear pattern is observed when the IS was held constant and NT varied for (c) VHSv (R2= 0.99,F =5124.00, df = 1, 13,p,0.001), CV = 5% for 1:1–1:10 and 7% for dilutions down to 1:20, and (d)actb1(R2= 0.99,F =2434.00, df = 1, 13, p,0.001), CV = 3% and 6%. Error bars = standard error of results for triplicate runs. Dotted line = partition of dilutions from 1:1–1:10 (right) and 1:12– 1:20 (left).
amount of starting template. Three no-template controls per rxn, located on separated areas on the plate, were used to control for possible contamination.
A second round of amplification was performed, in which each pre-amplified sample was diluted 1000-fold with TE buffer
(10 mM Tris-Cl, 0.1 mM EDTA, pH 7.4); 2ml of each diluted
product was placed into each well of a new 0.1 mL 96-well
TempPlateH, along with 18ml of a master mixture containing
10ml TaqManH Universal Master Mix II (without uracil N-glycosylase), 2ml of each 10X primer solution (final concentration:
750 nM), 2ml of each NT and IS probe (final concentration:
200 nM), and RNAse-free water. This second amplification was conducted as described above, except run for 40 cycles. The
number of VHSv molecules/106actb1 molecules was calculated
using equations (2) and (3) below.
Measured NT molecules for the VHSvNandactbt1genes:
a
ð ÞCorrection for variation in fluorescence among probes~
the mean of two ESM concentrations
measured NT cycle threshold Cð tÞ
½ -½measured IS Ct
f g:
b
ð ÞMeasured NT signal relative to the IS
signal for each gene
DCt
ð Þ~each genef½NT Ct-½IS Ctg-normalizing value
c
ð ÞMeasured NT molecule copy number~
#input IS molecules from ISM
½ | 2ð-DCtÞ
h i
ð2Þ Figure 4. Relationship between the numbers of observed versus expected molecules when NT:IS concentrations are 1:1.Results are based on dilutions of the Native Template (NT) and Internal Standard (IS) of 66106, 66105, 66104, 66103, 66102, 60, 6, and 0.6 molecules for VHSv andactb1. The 2-color fluorometric assay yields a linear relationship for (a) VHSv over seven orders of magnitude (from 66106to 66100VHSv molecules) with a slope of 1.00 (R2= 0.99,F =9404.00, df = 1, 5,p,0.001), and mean CV of 9%. A linear trend also is obtained for (b)actb1(R2= 0.99, F =1347.00, df = 1, 5,p,0.001). Slope = 1.04, mean CV = 10%. Error bars = standard error of triplicate runs.
Final number of molecules for the target VHSv
Ngene and referenceactb1gene:
VHSv molecules
106actb1molecules~
VHSv measured NT
½ =½actb1measured NT|106 ð3Þ
Specificity, True Accuracy, and Linearity
Our assay was tested for non-specific amplification using two human viruses (Encephalomyocarditis virus and Vesicular Stoma-titis virus) and five fish viruses related to VHSv (Hirame rhabdovirus, Infectious Hematopoietic Necrosis virus, Infectious Pancreatic Necrosis virus, Spring Viremia of Carp virus, and
Snakehead rhabdovirus). The Snakehead rhabdovirus is the nearest relative to VHSv, with 62% sequence similarity [8,16]. Twenty-five VHSv isolates were tested to evaluate amplification across a range of European, Asian, and North American variants (Table 3), encompassing all four strains. All samples were assayed in triplicate.
To measure true accuracy – the agreement between a measurement and its known value [38] – the relationship between
the observed versus expected numbers of VHSvN-gene andactb1
molecules based on Poisson analysis was determined [39]. Ten replicates were amplified for the VHSvN- andactb1genes over a series of limiting PCR dilutions, which were predicted to contain 40, 20, 10, 7, 6, 5, 4, 2, 1, 0.7, 0.4, and 0.1 molecules. Linear regression analysis was performed in the R statistical software suite v2.15.2 [40]. Ax2
test (in Microsoft Excel) compared the number of molecules measured with the 2-color fluorometric assay versus those from the Agilent 2100 Bioanalyzer, at the same dilutions.
Linearity was measured over two series of dilution experiments to: 1) determine the maximum and minimum ratio of NT to IS that produced reproducible results, and 2) verify that our test
Figure 5. Relative numbers of VHSv positives and negatives from our 2-color fluorometric and capillary electrophoresis StaRT-PCR assays, which indicates identical numbers of positives and negatives.Compared to these tests, for 43 fishes (25 positives, 18 negatives (including 5 laboratory controls)), (a) SYBRHgreen has 44% false negative error (x2= 5.67, df = 1,p= 0.02), and cell culture has 56% error (x2= 9.36, df = 1,p= 0.002). For 63 fish samples (39 positives, 24 negatives (including 11 laboratory controls)), (b) SYBRHgreen qRT-PCR has 33% false negative error (x2= 5.37, df = 1,p= 0.02), whereas the 2-color fluorometric and capillary electrophoresis tests show zero false negatives.
followed a linear trend in calculating the expected number of molecules per dilution. The first dilution set was made by mixing a constant amount of synthetic NT with decreasing amounts of IS to generate dilutions of: 1:1 (66104molecules), 1:2, 1:3, 1:4, 1:5, 1:6,
1:7, 1:8, 1:9, 1:10, 1:12, 1:14, 1:16, 1:18, and 1:20 (36103
molecules) for both genes. Identical procedures were performed by holding the IS constant, while varying the NT. The second dilution series evaluated linearity for the VHSvN- andactb1genes using 10-fold serial dilutions of the ESM at a 1:1 ratio, with dilutions of 66106, 66105, 66104, 66103, 66102, 60, 6, and 0.6 molecules. Regression analyses were conducted to determine correlation (R2), slope (linearity), and relation to a linear trend (F) among the various dilutions of NT:IS and IS:NT for each gene. Imprecision was reported as the coefficient of variation (CV), calculated as the standard deviation divided by the mean of triplicate measurements at each dilution (reported in %) (in Microsoft Excel) [41]. In addition, S.E. was calculated for each sample. For these linearity experiments, PCR was done as specified above in ‘‘Performing the VHSv Assay’’, but substituting
the cDNA and ISM with either 2ml of the ESM (from dilution 1)
or a concentration of 1:1 NT/IS (dilution 2). Each dilution was run in triplicate, with a negative/no template control for each run.
VHSv Detection Comparisons of Our Assay to Others
Results from the new 2-color fluorometric test are compared to those from our prior Agilent capillary electrophoresis assay [37],
conventional SYBRH green qRT-PCR, and cell culture to
evaluate their relative abilities to detect VHSv in 63 fish samples (see ‘‘Fish Samples used to Evaluate the VHSv Assay’’). All samples were analyzed in triplicate and all runs had positive and negative controls. Each PCR rxn included a known cell culture positive, a negative VHSv cDNA, and a reagent negative control (nuclease-free H2O). PCR products were visualized on 1% agarose
gels to confirm positive/negative results. The amount of yellow
perch fish tissue available from the USGS laboratory challenge experiments precluded analysis with cell culture.x2
tests [43] were used to compare the results among the approaches.
SYBRH green qRT-PCR experiments used a Mastercycler
Realplex Thermocycler (Eppendorf, Inc., Westbury, NY) in 25ml
rxns, containing 0.05mg of each primer (the same primers used for
the Agilent capillary electrophoresis assay [37]), 2ml cDNA
product, 10ml SsoFast SYBRHgreen mix, and RNase-free water.
Amplifications were run on a Mastercycler Realplex Thermo-cycler (Eppendorf, Inc., Westbury, NY), with initial denaturation of 5 min at 95uC, followed by 40 cycles of 30 sec at 95uC, and 1 min at 60uC.
Cell culture was performed at MSU’s AAHL by M. Faisal and R. Kim, following standard OIE [24] procedures. If results were positive, RNA was extracted from infected cells as described above, reverse transcribed with Affinity Script Multiple Temper-ature Reverse Transcriptase PCR (Stratagene, La Jolla, CA), and amplified following OIE [24].
VHSv Quantification using Our Assay
Positive samples were quantified with our new 2-color fluorometric real-time PCR assay and compared to our earlier results from the Agilent capillary electrophoresis procedure [36] for the 63 test fish, with linear regression in R and anF-test [43].
Numbers of VHSv/106 actb1 molecules were measured in
triplicate, from which means and S.E. were calculated. Relative numbers of VHSv molecules were compared between laboratory challenged muskellunge showing clinical signs of infection (e.g. external hemorrhages;N =9) versus those without signs (N =9). A x2
test (Microsoft Excel) was used to determine if a threshold number of VHSv molecules characterized the appearance of the clinical signs. Due to limited sample size, a power analysis (G*Power2; [44]) was used to estimate the number of fish needed to achieve 95% confidence, with an effect size of 0.50 [45].
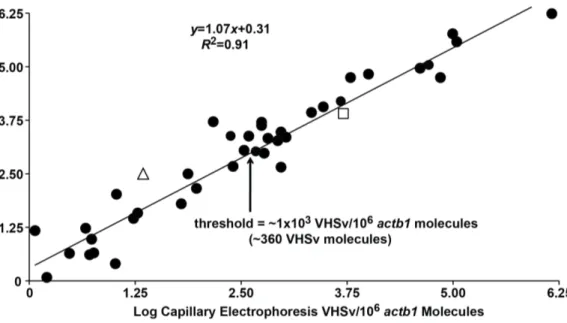
Figure 6. Mean log numbers of VHSv molecules/106actb1molecules from our new 2-color fluorometric assay versus the prior
Agilent capillary electrophoresis approach. Results indicate a linear relationship between the two tests (R2= 0.91, df = 1, 38, F =396.40, p,0.001) and do not significantly differ (t =1.42, df = 78, NS). Arrow = Estimated threshold concentration of VHSv for fish with clinical signs of infection using our new assay, from ax2test of nine symptomatic fish (16103VHSv molecules/106actb1molecules = 3.66102VHSv molecules). Triangle = false negative range for SYBRH green qRT-PCR (1.06100–1.66102 VHSv/106 actb1 molecules = 0.66100–2.56102 VHSv molecules). Square = false negative range for cell culture (1.06100–2.26103VHSv/106actb1molecules = 0.66100–6.16103VHSv molecules.
Results
Performance of Our 2-Color Fluorometric Assay for VHSv
Our test results are negative for all other viruses (i.e. did not result in amplification; Table 3), including human viruses (Encephalomyocarditis virus and Vesicular Stomatitis virus) and fish viruses that are related to VHSv (i.e. Hirame rhabdovirus, Infectious Hematopoietic Necrosis virus, Infectious Pancreatic Necrosis virus, Spring Viremia of Carp virus, and Snakehead rhabdovirus). All four VHSv strains (I–IV) and all substrains evaluated (I, Ia, II, III, IVa, IVb, and IVc) yield positive amplification results with our test (Figure 1a; Table 3). Thus this new assay is specific for VHSv.
Amplification results for the VHSvN-gene (Figure 2a) are 100% (10/10 times) for dilutions of 5–40 VHSv molecules, 90% (9/10 times) for 4 molecules, 80% (8/10) for 2 molecules, 60% (6/10) for a single molecule, 30% (3/10) for 0.7 molecules, 20% (2/10) for
0.4 molecules, and 10% (1/10) for 0.1 molecules (R2= 0.98,
F =541.50, df = 1, 10,p,0.001). Values for amplification of the fishactb1gene are similar (Figure 2b), yielding 100% positives for 4–40 molecules (10/10), 70% at 2 molecules (7/10), 40% for a single molecule and for 0.7 molecules (4/10), 20% for 0.4
molecules (2/10), and 10% at 0.2 molecules (1/10) (R2= 0.97,
F =283.60, df = 1, 10,p,0.001). Results indicate that the numbers of ISM molecules measured by our assay match those from the bioanalyzer for the VHSvN-gene (x2= 0.18, df = 11, NS) and the actb1gene (x2
= 0.23, df = 11, NS).
The relationship between the amount of PCR product remains linear when the concentration of NT is held constant and the IS is
varied for both the VHSv N-gene (Figure 3a: R2= 0.99,
F =1363.00, df = 1, 13,p,0.001) and theactb1 gene (Figure 3b: R2= 0.99,F =1283.00, df = 1, 13,p,0.001). Figure 1b depicts the results that illustrate this relationship. The mean calculated CV is
5% for the VHSv N-gene over an NT:IS dilution range of 1:1–
1:10 (yielding 6.0610460.06100 to 4.6610362.86102
mole-cules). The CV likewise is 5% for the actb1 gene (yielding
6.0610460.006100to 7.5610364.36102molecules). At dilutions
beyond 1:10, the CV increases to 7% for both the VHSvN-gene
(yielding up to 1.5610361.16102molecules) and the actb1 gene (yielding up to 3.0610361.26102molecules) when the NT is held constant.
Analogous results are obtained when the IS is held constant and
the NT is varied for the VHSv N-gene (Figures 1c and 3c:
R2= 0.99, F =5124.00, df = 1, 13, p
,0.001) and the actb1 gene
(Figure 3d: R2= 0.99, F =2434.00, df = 1, 13, p,0.001). The mean CV for the IS:NT dilution range of 1:1–1:10 is 5% for the VHSvN-gene (yielding 6.0610460.06100to 5.9610362.26103 molecules) and 3% for theactb1gene (yielding 6.0610460.06100 to 4.0610364.36101 molecules). At dilutions beyond 1:10, the
CV increases to 7% for the VHSv N-gene (yielding up to
2.8610361.86102molecules) and 6% for theactb1gene (yielding up to 1.4610366.26101molecules) when the IS is held constant. Based on these findings, our quantifications are conducted in the range of 1:10 to 10:1 NT:IS to maximize accuracy.
Numbers of VHSv molecules show a linear relationship over seven orders of magnitude (serial dilutions of 66106 to 66100
molecules) when the NT:IS is 1:1 (Figure 4a), with a slope of 1.00 (R2= 0.99,F =9404.00, df = 1, 5,p,0.001). Figure 1d illustrates this relationship, in which NT and IS increase by#3.2 Ctfor each
10-fold serial dilution of the ESM. The mean CV for VHSv is
estimated at 7% for samples of 66106 to 66101 molecules
(measured as 6.5610665.26105to 7.9610162.06100molecules),
and 9% when the range is extended to 66100molecules (measured
as 6.0610061.06100molecules). Results foractb1have a similar
trend (Figure 4b), with a slope of 1.04 (R2= 0.99, F =1347.00,
df = 1, 5, p,0.001), a mean CV of 7% for 66106 to 66101
molecules (measured as 6.6610662.16105to 7.8610168.06100
molecules), and 10% when the range is extended to 66100
molecules (measured as 3.0610060.46100molecules). Stochastic
sampling likely contributes to increased CV and S.E. in the measurements for 6 molecules.
VHSv Detection and Quantification Comparison among Methods
Results reveal that our present 2-color fluorometric real-time PCR assay and previous results from the Agilent capillary electrophoresis-based approach [37] both discriminate identical positives and negatives (i.e. they have the same accuracy; Figure 5;
x2= 0.00, df = 1, NS), and are free of false negatives (Figure 5). In
contrast, the cell culture results have 56% false negative error (Figure 5a:x2= 9.36, df = 1,p= 0.002) and SYBRH green yields
33–44% false negative error (Figure 5a,b:x2= 5.37–5.67, df = 1,
p= 0.02). All positives detected by SYBRHgreen qRT-PCR and
cell culture also are positive with both of our StaRT-PCR methods (2-color fluorometric real time and capillary electrophoresis). The
false negative range for SYBRH green qRT-PCR is 1.06100–
1.66102 VHSv/106actb1 molecules ( = 0.66100–2.56102VHSv
molecules, as quantified by our 2-color fluorometric method) and 1.06100–2.26103 VHSv/106 actb1 molecules ( = 0.66100–
6.16103 VHSv molecules, as quantified by our 2-color
fluoro-metric method) for cell culture. True negatives (including experimental controls) are negative with all assays; i.e. we find no false positives and no contamination.
Numbers of VHSv molecules/106actb1molecules measured from the spleen tissues of positive fish are higher in the new assay, ranging to 1.216106 VHSv molecules/106 actb1 ( = 1.906104 VHSv molecules) than for the Agilent capillary-based test, which range to 8.46105VHSv
molecules/106actb1( = 2.76103VHSv molecules). However, both sets of
values have a direct linear relationship (Figure 6:R2= 0.91, df = 1, 38, F =396.40, p,0.001, t =1.42, df = 78, NS). Muskellunge exhibiting clinical signs of infection contain a greater mean number of viral molecules (1.4610566.56103 VHSv/106 actb1 molecules = 6.9610466.96103
VHSv molecules) than those without (1.2610461.76103 VHSv/106 actb1molecules = 1.5610361.66102VHSv molecules). The estimated threshold at which those individuals display clinical signs of infection is,
16103VHSv/106actb1molecules ( = 3.66102VHSv molecules) using
our assay. Our sample sizes are not sufficient to further evaluate the relationship between this threshold number of molecules and clinical diagnosis (x2= 0.09, df = 1, NS). Power analysis estimates that 52 fish
samples (26 with and 26 without clinical signs) would be needed to verify this finding.
All data and analyses are publically accessible on the University of Toledo Lake Erie Center’s VHSv webpage (http://www. utoledo.edu/nsm/lec/research/glgl/VHS/VHS_main.html).
Discussion
beneficial since positive results may denote new spread of VHSv or latent cases in the geographic region where the samples are taken. This can aid in diagnosis of viral infections.
The present assay detects and quantifies VHSv-IVb in fishes from the Great Lakes using primers and probes that are homologous to theN-gene sequence of the widespread IVb isolate MI03GL and matches conserved sequence regions among all VHSv strains and substrains. Results demonstrate cross-reaction with all other VHSv strains and substrains tested. Other human and fish viruses do not amplify. Thus, our assay is VHSv-specific and detects all of its known variants.
Other PCR tests developed for VHSv by Chico et al. [26], Lo´pez-Va´zquez et al. [27], Liu et al. [29], Matejusova et al. [30], Cutrı´n et al. [31], Hope et al. [32], Garver et al. [33], and Jonstrup et al. [28], culminated in high numbers of false negatives,
analogous to the SYBRHgreen test evaluated here (33–44% false
negatives). Notably, 15–90% false negatives were reported by Lo´pez-Va´zquez et al. [27], 25–92% by Chico et al. [26], and values to 42% by Jonstrup et al. [28] for their respective approaches. Unlike those other real-time PCR tests for VHSv [26–34], our method incorporates intrinsic quality control standards (IS) to circumvent false negative results.
Specifically, exogenous (IS) and endogenous controls (the commonly used reference gene actb1) facilitate optimal detection of true positives and act to normalize the quantification of viral molecules. Use of IS is recommended by the International Organization for Standardization [46], the U.S. Environmental Protection Agency [47], and the U.S. Food and Drug Adminis-tration [48]. Tests for Hepatitis C virus [49] and Human Immunodeficiency virus [50,51] already have implemented IS in their assays.
Our assay is sensitive, follows a linear relationship with increasing viral concentration, and is highly reproducible. It
detects down to five VHSvN-gene molecules with 100% accuracy,
based on Poisson distribution. Other real-time PCR assays for VHSv had much higher detection thresholds. Notably, Liu et al.’s [29] test required$140 viral copies of VHSv, and assays by Hope et al. [32] and Garver et al. [33] needed$100 viral copies. Our results are consistent for samples containing six to 6,000,000 VHSv molecules. Stochastic variation is evident only at extremely low dilutions (, five molecules). Results confirm reliability from concentrations of 1:1 to 1:20 NT:IS, with some slight increase in CV at dilutions.1:10. We thus recommend adjusting the relative concentrations of NT:IS to maximize accuracy, following recom-mendations in the Materials and Methods section ‘‘Performing the VHSv Assay’’. All quantification values reported here fall within this 1:10 range, which allows us to distinguish, a 1.25-fold Ct
difference. Our assay also should work well with highly degraded samples (e.g. dead fish in the field), as described for human cancer samples using this type of approach by some of our team members [unpublished data].
This 2-color fluorometric real-time assay is highly accurate and free of the size separation steps required for our previously-published Agilent capillary electrophoresis approach [37]. Here we determine higher numbers of VHSv molecules for the same fish samples, due to the re-design of primers and use of fluorescent-labeled probes. Results from both methods have a linear relationship and are readily cross-calibrated.
Laboratory challenged muskellunge showing clinical signs of infection have a greater mean number of viral molecules than
those without. It is estimated that , 16103 VHSv/106 actb1
molecules ( = 3.66102VHSv molecules) appears to mark a clinical
threshold for signs of VHSv. However, exhibition of clinical signs at this biomarker could be species-specific, and may differ between fish in the laboratory and those in the field. Further experiments are warranted to validate this assumption.
Conclusions
Our assay is highly sensitive and accurate, free of false negatives, and reliably quantifies a wide range of VHSv in fish tissue samples. Other PCR-based methods and cell culture techniques had high proportions of false negatives since they lacked intrinsic quality control, which could lead to spread of the virus. This new test will aid rapid, accurate, and low-cost diagnosis of the disease. It has wide applicability across the geographic range of the virus, and should be highly successful in elucidating new occurrences and circumventing spread.
Acknowledgments
This is contribution#2013–18 from the University of Toledo’s Lake Erie Research Center. We thank T. Blomquist and L. Stanoszek for assistance, and P. Uzmann and M. Gray for logistic support. I. Bandı´n of Universidad de Santiago de Compostela (La Corun˜a, Spain), P. Bowser of Cornell University (Ithaca, NY), T. Gadd of the Finnish Food Safety Authority Evira (Helsinki, Finland), K. Garver of Fisheries and Oceans (Ottawa, Canada), F. Goetz of NOAA Northwest Fisheries Science Center Manchester Research Station (Port Orchard, WA), D. Leaman of the University of Toledo (Toledo, OH), and G. Kurath and J. Winton of USGS (Seattle, WA) provided VHSv samples. The views contained in this document are those of the authors and should not be interpreted as necessarily representing the official policies, either expressed or implied, of the U.S. Government. Mention of trade name, proprietary product, or specific equipment does not constitute a guarantee or warranty by the USDA and does not imply its approval to the exclusion of other products that may be suitable.
Author Contributions
Conceived and designed the experiments: CAS JCW BSS. Performed the experiments: LRP VVP. Analyzed the data: LRP VVP JY. Wrote the paper: LRP CAS JCW BSS. Trouble-shooting: ELC.
References
1. Rao JR, Fleming CC, Moore JE (2006) Molecular Diagnostics Current Technology and Applications. Horizon Bioscience, Norfolk, Norwich, United Kingdom.
2. Park S, Zhang Y, Lin S, Wang TH, Yang S (2011) Advances in microfluidic PCR for point-of-care infectious disease diagnostics. Biotech Adv 29: 830–839. 3. Coutle´e F, Viscidi RP, Saint-Antoine P, Kessous A, Yolken RH (1991) The polymerase chain reaction: a new tool for the understanding and diagnosis of HIV-1 infection at the molecular level. Mol Cell Probe 5: 241–259. 4. Ellis JS, Zambon MC (2002) Molecular diagnosis of influenza. Rev Med Virol
12: 375–389.
5. Chai Z, Ma W, Fu F, Lang Y, Wang W, et al. (2013) A SYBR Green-based real-time RT-PCR assay for simple and rapid detection and differentiation of highly pathogenic and classical type 2 porcine reproductive and respiratory syndrome virus circulating in China. Arch Virol 158: 407–415.
6. Pasche JS, Mallik I, Anderson NR (2013) Development and validation of a real-time PCR assay for the quantification ofVerticillium dahliaein potato. Plant Dis 97: 608–618.
7. Faisal M, Shavalier M, Kim RK, Millard EV, Gunn MR, et al. (2012) Spread of emerging Viral Hemorrhagic Septicemia virus strain, genotype IVb, in Michigan, USA. Viruses 4: 734–760.
8. Ammayappan A, Vakharia VN (2009) Molecular characterization of the Great Lakes Viral Hemorrhagic Septicemia virus (VHSv) isolate from USA. Virol J 6. doi:10.1186/1743–422X-6–171.
10. Hawley LM, Garver KA (2008) Stability of Viral Hemorrhagic Septicemia virus (VHSv) in freshwater and seawater at various temperatures. Dis Aquat Org 82: 171–178.
11. Meyers TR, Winton JR (1995) Viral Hemorrhagic Septicemia virus in North America. Annu Rev Fish Dis 5: 3–24.
12. Bain MB, Cornwell ER, Hope KM, Eckerlin GE, Casey RN, et al. (2010) Distribution of an invasive aquatic pathogen (Viral Hemorrhagic Septicemia virus) in the Great Lakes and its relationship to shipping. PLOS One 5: e10156. Available: http://www.plosone.org/article/info%3Adoi% 2F10.1371%2Fjour-nal.pone.0010156 Accessed on 19 July 2013.
13. Faisal M, Winters AD (2011) Detection of Viral Hemorrhagic Septicemia virus (VHSv) fromDiporeiaspp. (Pontoporeiidae, Amphipoda) in the Laurentian Great Lakes, USA. Parasites and Vectors 4: 2. Available: http://www. parasitesandvectors.com/content/4/1/2. (Accessed on 19 July 2013). 14. Goodwin AE, Merry GE (2011) Replication and persistence of VHSv IVb in
freshwater turtles. Dis Aquat Org 94: 173–177.
15. Sha¨perclaus W (1938) Die Scha¨digungen der deutschen fischerei durch fischparasiten und fischkrankheiten. Fischerei-Zeitung 41: 267–270. 16. Pierce LR, Stepien CA (2012) Evolution and biogeography of an emerging
quasispecies: diversity patterns of the fish Viral Hemorrhagic Septicemia virus (VHSv). Mol Phylogenet Evol 63: 327–341.
17. Elsayed E, Faisal M, Thomas M, Whelan G, Batts W, et al. (2006) Isolation of Viral Haemorrhagic Septicaemia virus from muskellunge, Esox masquinongy (Mitchill), in Lake St. Clair, Michigan, USA reveals a new sublineage of the North American genotype. J Fish Dis 29: 611–619.
18. Brunson R, True K, Yancey J (1989) VHS virus isolated at Makah National Fish Hatchery. Fish Health Sect Am Fish Soc Newsl 17: 3–4.
19. Hopper K (1989) The isolation of VHSv from Chinook salmon at Glenwood Springs, Orcas Islands, Washington. Fish Health Sect Am Fish Soc Newsl 17: 1– 2.
20. Takano R, Nishizawa T, Arimoto M, Muroga K (2000) Isolation of Viral Hemorrhagic Septicemia virus (VHSv) from wild Japanese flounder,Paralichthys olivaceus. Bull Eur Assoc Fish Pathol 20: 186–192.
21. Gagne´ N, MacKinnon AM, Boston L, Souter B, Cook-Versloot M, et al. (2007) Isolation of viral haemorrhagic septicemia virus from mummichog, stickleback, striped bass and brown trout in eastern Canada. J Fish Dis 30: 213–223. 22. Thompson TM, Batts WN, Faisal M, Bowser P, Casey JW, et al. (2011)
Emergence of Viral Hemorrhagic Septicemia virus in the North American Great Lakes region is associated with low viral genetic diversity. Dis Aquat Org 96: 29– 43.
23. Aquatic Invasive Species Action Plan (2011) Viral Hemorrhagic Septicemia virus. Fish Production Services. Pennsylvania Fish and Boat Commission. Available: http://fishandboat.com/ais/ais-action1-vhs.pdf. Accessed on 19 July 2013.
24. Office of International des Epizooties, World Organization for Animal Health (2013) Viral Haemorrhagic Septicaemia. In: Olesen, N.J. and Skall, H.F. (eds) Manual of Diagnostic Tests for Aquatic Animals. Paris, France, 347–396. 25. U.S. Fish and Wildlife Service and American Fisheries Society-Fish Health
Section (2010) Standard procedures for aquatic animal health inspections. In: American Fisheries Society-Fish Health Section, Fish Health Section Blue Book: Suggested Procedures for the Detection and Identification of Certain Finfish and Shellfish Pathogens. American Fisheries Society-Fish Health Section, Bethesda, Maryland.
26. Chico V, Gomez N, Estepa A, Perez L (2006) Rapid detection and quantification of Viral Hemorrhagic Septicemia virus in experimentally challenged rainbow trout by real-time RT-PCR. J Virol Methods 132: 154–159. 27. Lo´pez-Va´zquez C, Dopazo CP, Olveira JG, Barja JL, Bandı´n I (2006) Development of a rapid, sensitive and non-lethal diagnostic assay for the detection of Viral Haemorrhagic Septicaemia virus. J Virol Methods 133: 167– 174.
28. Jonstrup SP, Kahns S, Skall HF, Boutrup TS, Olesen NJ (2013) Development and validation of a novel Taqman-based real-time RT-PCR assay suitable for demonstrating freedom from Viral Haemorrhagic Septicaemia virus. J Fish Dis 36: 9–23.
29. Liu Z, Teng Y, Liu H, Jiang Y, Xie X, et al. (2008) Simultaneous detection of three fish rhabdoviruses using multiplex real-time quantitative RT-PCR assay. J Virol Methods 149: 103–109.
30. Matejusova I, McKay P, McBeath AJA, Collet B, Snow M (2008) Development of a sensitive and controlled real-time RT-PCR assay for Viral Haemorrhagic Septicaemia virus (VHSv) in marine salmonid aquaculture. Dis Aquat Org 80: 137–144.
31. Cutrı´n JM, Olveira JG, Bandı´n I, Dopazo CP (2009) Validation of real-time RT-PCR applied to cell culture for diagnosis of any known genotype of Viral Haemorrhagic Septicaemia virus. J Virol Methods 162: 155–162.
32. Hope KM, Casey RN, Groocock GH, Getchell RG, Bowser PR, et al. (2010) Comparison of quantitative RT-PCR with cell culture to detect Viral Hemorrhagic Septicemia virus (VHSv) IVb infections in the Great Lakes. J Aquat Anim Health 22: 50–61.
33. Garver KA, Hawley LM, McClure CA, Schroeder T, Aldous S, et al. (2011) Development and validation of a reverse transcription quantitative PCR for universal detection of Viral Hemorrhagic Septicemia virus. Dis Aquat Organ 95: 97–112.
34. Phelps NBD, Patnayak DP, Jiang Y, Goyal SM (2012) The use of a one-step real-time reverse transcription polymerase chain reaction (rRT-PCR) for the surveillance of Viral Hemorrhagic Septicemia virus (VHSv) in Minnesota. J Aquat Anim Health 24: 238–243.
35. Huggett JF, Novak T, Garson JA, Green C, Morris-Jones SD, et al. (2008) Differential susceptibility of PCR reactions to inhibitors: an important and unrecognised phenomenon. BMC Res Notes 1 (70). Doi:10.1186/1756-0500-1-70.
36. Willey JC, Crawford EL, Jackson CM, Weaver DA, Hoban JC, et al. (1998) Expression measurement of many genes simultaneously by quantitative RT-PCR using standardized mixtures of competitive templates. Am J Resp Cell Mol Biol 19: 6–17.
37. Pierce LR, Willey JC, Crawford EL, Palsule VV, Leaman DW, et al. (2013) A new StaRT-PCR approach to detect and quantify fish Viral Hemorrhagic Septicemia virus (VHSv): Enhanced quality control with internal standards. J Virol Methods 189: 129–142.
38. Shabir GA (2003) Validation of high-performance liquid chromatography methods for pharmaceutical analysis understanding the differences and similarities between validation requirements of the US Food and Drug Administration, the US Pharmacopeia and the International Conference on Harmonization. J Chromatogr 987: 57–66.
39. Vogelstein B, Kinzler KW (1999) Digital PCR. Proc Natl Acad Sci 96: 9236– 9241.
40. R Development Core Team (2012) R: A Language and Environment for Statistical Computing. R Foundation for Statistical Computing, Vienna. Available: http://www.r-project.org/. Accessed on 19 July 2013.
41. Ogino S, Kawakaki T, Brahmandam M, Cantor M, Kirkner GJ, et al. (2006) Precision and performance characteristics of bisulfite conversion and real-time PCR (methylight) for quantitative DNA methylation analysis. J Mol Diagn 8: 209–217.
42. Rosauer DR, Biga PR, Lindell SR, Binkowski FP, Shepherd BS, et al. (2011) Developments of yellow perch (Perca flavescens) broodstocks: initial characteriza-tion of growth quality traits following grow-out of difference stocks. Aquaculture 317: 58–66.
43. Sokal RR, Rohlf FJ (1995) Biometry: 3rd
edn. W. H. Freeman and Company, New York, New York.
44. Erdfelder E, Faul F, Buchner A (1996) GPOWER: a general power analysis program. Behav Res Methods Instrum Comp 28: 1–11.
45. Cohen J (1992) A primer power. Quant Methods Psych 1: 155–159. 46. International Organization for Standardization (2005) Microbiology of food and
animal feeding stuffs-Polymerase chain reaction (PCR) for the detection of food-borne pathogens – General requirements and definitions. BS EN ISO 22174. 47. Environmental Protection Agency (2004) Quality assurance/quality control
guidance for laboratories performing PCR analyses on environmental samples. EPA 815-B-04-001.
48. Food and Drug Adminitration (2010) Draft guidance for industry and food and drug administration staff; Establishing the performance characteristics ofin vitro diagnostic devices for the detection ofClostridium difficile. Center for Devices and Radiological Health. Available: http://www.fda.gov/downloads/ MedicalDevices/DeviceRegulationandGuidance/GuidanceDocuments/ UCM234878.pdf. Accessed on 19 July 2013.
49. Gelderblom HC, Menting S, Beld MG (2006) Clinical performance of the new Roche COBAS (R) TaqMan HCV test and high pure system for extraction, detection and quantification of HCV RNA in plasma and serum. Antivir Ther 11: 95–103.
50. Swanson P, Huang S, Holzmayer V, Bodelle P, Yamaguchi J, et al. (2006) Performance of the automated Abbott RealTime (TM) HIV-1 assay on a genetically diverse panel of specimens from Brazil. J Virol Methods 134: 237– 243.