DEMOGRAPHIC PROCESSES IN THE SOUTHERN PART OF THE
HUNGARIAN – ROMANIAN BORDER
EGON NAGY
1ABSTRACT - This paper is a demographic comparative study of two neighboring regions along the
southern part of the Romanian-Hungarian border region, which serves as a fundament for further analyses concerning the verification of cohesion between the two parts of the border. We have concluded our study with the statement that in spite of its traditionally low population increase, the Romanian Timiş and Arad counties have a more advantageous demographical condition than the neighboring Hungarian Békés and Csongrád counties, which can be described as having a generalized demographical decline. Though in Romania the Banat region for many decades is classified as a crisis-zone from a demographical point of view, it can show off an impressive attractiveness in terms of inner-migration in contrast to its Hungarian neighbors. In contrast with the northern part of the Romanian-Hungarian border, in this region the border strip does not overlap with a socio-economic periphery, because this phenomenon is more scattered in space.
Keywords: Romanian-Hungarian border region, demographic periphery, territorial cohesion, social
periphery
INTRODUCTION
The present study analyzes the demographic processes in the neighboring counties in the southern part of the border region that have daily and intensive contacts with each other. The studied counties are Timiş and Arad on the Romanian side of the border and Békés and Csongrád on the Hungarian side. All this represents an underlying study which points out the social background of the relations along the border and it also studies how much the current social-economic circumstances and their possible changes would contribute to the establishing of a (re)integrated border region in the future and how much this would facilitate the territorial cohesion on European level. At the same time, we are going to check whether, according to our hypothesis, the border line is not merely a positional periphery, but simultaneously a social-economic one.
POPULATION GROWTH AND DENSITY
From a demographic point of view both the Hungarian and the Romanian (except for Timiş County) regions along the border are among the most disadvantaged areas. This statement can be proved by several demographic indicators.
As far as the total number of population is concerned, Timiş County is the most populated and it stands out among the others. Timiş County with its 8697 km2 is the largest in Romania (but it is not the most populated).
Regarding the process of population growth, we can state that beginning with the 1980s the decline in the number of population in the two Hungarian counties was significant. It slowed down during the 1990s and it sped up again after the turn of the millennium. The decline was significantly high in Békés County: between 2001 and 2007 it decreased with approximately 21,000 people. The rate of the decline was four times higher than the national average (BALCSÓK and DANCS, 2009).
1
Assistant Professor, PhD, Babeş-Bolyai University, Faculty of Geography, 5-7 Clinicilor Street, 400006, Cluj-Napoca, Romania.
On the Romanian side of the border, Arad County experienced a continuous decline, by 4.2% following the turn of the millennium between 2001 and 2009. In Timiş County, on the other hand, during the same period, the number of population declined at the beginning, then, from 2006, the population increased, mainly due to the positive values of the migration balance and partly due to the lower rate of natural decrease.
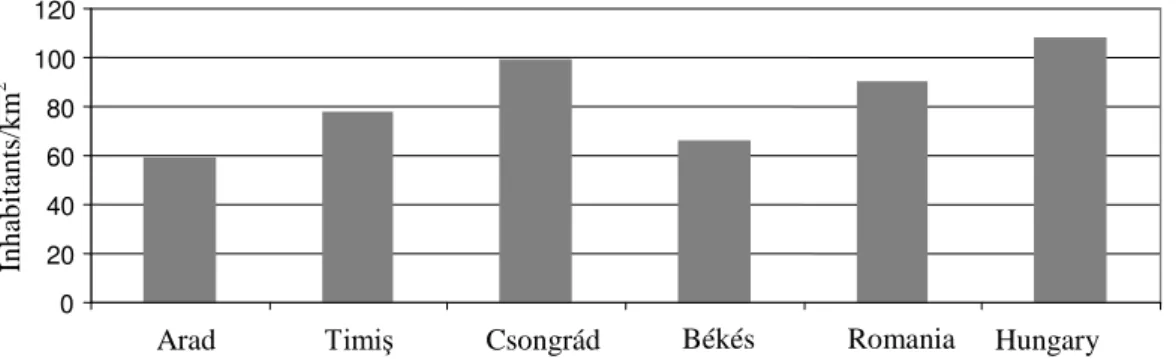
As far as population density is concerned, as a result of the prolonged demographic crisis, all the territorial-administrative units of the studied region have averages below the national value.
Figure 3. The values of population density
Source: National Institute of Statistics, Központi Statisztikai Hivatal
STRUCTURAL CHARACTERISTICS
From the age structure point of view, there are distinct signs of population ageing on both sides of the border. The Hungarian side is in a more disadvantageous situation this time as well. Timiş County with its relatively favorable situation, as a result of the emigration waves of the previous years, shows a more positive trend. However, in the case of Timiş County, the young population seeking work during the communist regime has become a middle-aged group with lower intentions of having children, so the number of young population is still small.
In Hungary, the proportion of the old population (60 and above) surpassed the ratio of the young population (14 or below) for the first time in 2006, while in the region which includes the studied counties this change happened earlier, in 2003, thus having the second worst position after the Mid-Hungarian region. To express the relation between the two age groups in numbers, demography uses the so-called ageing index, which defines the perspectives of the workforce market (expectedly lack of workforce). The increase of this number is followed by the worsening of the dependency index.
0 20 40 60 80 100 120
Arad Timiş Csongrád Békés Romania Hungary
In h ab itan ts /k m 2 0 100000 200000 300000 400000 500000 600000 700000 800000
Arad Timiş Csongrád Békés 0 100000 200000 300000 400000 500000 600000 700000 800000
2001 2002 2003 2004 2005 2006 2007 2008 2009
Figure 2. Population growth in the studied region Source: National Institute of Statistics, Központi
Statisztikai Hivatal
Arad Timiş Békés Csongrád
Figure 1. Number of population in the studied
counties in 2008
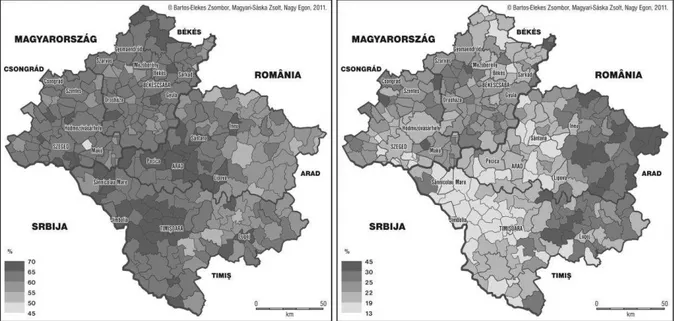
Figure 6. The proportion of the working age
group (15-59 years old) in the Romanian (2010) and the Hungarian (2007) counties
Source: National Institute of Statistics, Központi Statisztikai Hivatal
Regarding the ageing index, it is obvious that the Hungarian counties are in a much worse situation than the Romanian ones. Moreover, they are in a worse situation than the Hungarian national average.
On the village level, the significant proportion of the young population is characteristic for the villages with Gypsy population (Nagyszentpéter, Nagypél, Geszt), or in the villages with population of Moldavian origin (Lovrin), where the immigrants occupied the places of the Germans who had left the country.
The working age group, young and middle-aged (15-59), are present in the neighboring areas of the county capitals, where there is a significant economic activity, and in the NW of Békés County.
The proportion of the old people (60 years and above) is higher in the peripheral areas of Békés County (Bihar region) or in the eastern hilly and mountainous regions
of Arad and Timiş counties, areas
where out-migration is more frequent. 0
2 4 6 8 10 12 14
Arad Timiş Békés Csongrád Hungary Romania %
Table 1. Age structure of the population in the studied
counties in 2008 (%)
Age groups Arad Timiş Romania
0-14 14.6 14 15.2
15-59 65.1 67.8 65.3
>60 20.3 18.2 19.5
Age groups Békés Csongrád Hungary
0-14 14.5 14.7 15
15-59 61.6 62.2 68.8
>60 23.9 23,2 16.2
Source: National Institute of Statistics, Központi Statisztikai Hivatal
Figure 7. The proportion of the old age group
(60 years and above) in the Romanian (2010) and the Hungarian (2007) counties
Source: National Institute of Statistics, Központi Statisztikai Hivatal
Figure 5. The proportion of the young population
(0-14 years old) in the Romanian (2010) and the Hungarian (2007) counties
VITAL STATISTICS
In the southern part of the Romanian – Hungarian border region, in all four studied counties, the values of natural growth are negative. Only Timiş County has a relatively better situation as this indicator has a better value here than the national average. The comparison points out the strikingly negative values in Békés County, a situation which meets all the criteria to be called an area of demographic depression.
The indicators of the vital statistics at village level are studied according to the average of the years following the turn of the millennium in order to offer a dynamic image of these indicators. Thus, the indicators of natality, mortality, natural growth and migration show the average of the 2002 – 2007 period.
In the sub-regional division, at village level, the number of births on the Hungarian side is obviously related to the villages where the number of the Gypsy population is higher (Geszt, for example). At the same time, on the Romanian side, in addition to the presence of the Gypsy population, it is also important to take into account the number of population from Moldova or Oltenia, as they have a pro-natalist behavior. The former situation (the presence of the Gypsy population) is characteristic for Nagyszentpéter, while the latter, the higher proportion of the Moldavian population is characteristic for Lovrin. In itself, the number of births at village level is strongly correlated to the values of natural growth. Generally, the two values are high or low in the same villages – we can state that the dominant component of natural growth is the number of births on both sides of the border.
-10 -5 0 5 10 15 20
Arad Timiş Csongrád Békés Romania Hungary
‰ Live births Deaths
Natural growth
Figure 8. The components of the vital statistics in the studied region in 2009 Source: National Institute of Statistics, Központi Statisztikai Hivatal
Figure 9. The average birth rate in 2000- 2007 Source: National Institute of Statistics,
The mortality indicators correlate negatively with the number of births, fact that suggests that in the settlements with higher number of births there is a lower mortality rate among the young population.
As far as infant mortality is concerned, there are significant differences between the studied counties on the one hand and Hungary and Romania on the other hand, as Hungary is in a more favorable situation. The high indicators of infant mortality in Romania reflect a very poor public health system, a situation that, as a kind of legacy, keeps the country very far below the European standards, although the situation has improved, especially in the last decade.
At village level, we can state that in this case there is no clear connection between the higher infant mortality rate and the presence of the Gypsy population, as in many other situations. In this
respect, higher values are shown in the villages at the border of Arad and Timiş counties, which are
quite inaccessible, and belong to inner peripheral areas (for example Şiştarovăţ and Ohaba Lungă).
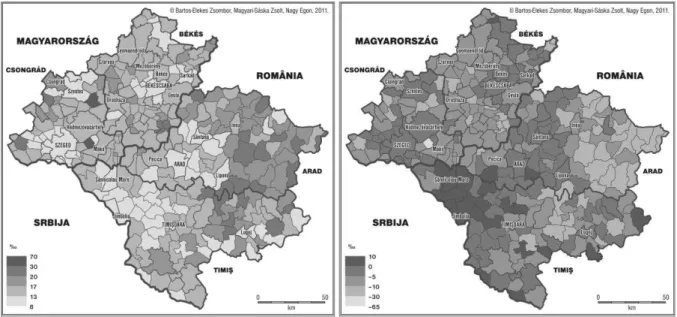
Figure 10. The average mortality rate
in 2000 – 2007
Source: National Institute of Statistics, Központi Statisztikai Hivatal
Figure 11. The average natural growth rate
in 2000 – 2007
Source: National Institute of Statistics, Központi Statisztikai Hivatal
0 2 4 6 8 10 12 14 16
18
Arad Timiş Csongrád Békés Romania Hungary
‰
The values of the general fertility rate (GFR) highlight even more the somber perspectives of the Hungarian counties, their reduced biological reproduction ability, in general the reduced biological potential of South-East Hungary. The fertility values in the Hungarian counties are almost 10% lower than those in the Romanian counties or the national average.
Figure 14. The general fertility rate (GFR) in the studied counties in 2008 Source:National Institute of Statistics, Központi Statisztikai Hivatal
34 35 36 37 38 39 40 41
Arad Timiş Csongrád Békés Romania Hungary
‰
In the case of life expectancy at birth, the figure shows the negative record of Békés County, which has lower values than the Romanian counties, in spite of the better public health services, being also lower than the Hungarian national average.
Figure 15. Life expectancy at birth in the counties of the studied region in 2008 Source:National Institute of Statistics, Központi Statisztikai Hivatal
MIGRATION FLOW
As far as internal migration is concerned, we can talk about a serious asymmetry between the two sides of the border, as the Romanian counties have a much stronger pull capacity on national level than the Hungarian ones do on national level. The values of the Hungarian side are rendered significantly negative by the migration loss of Békés County which is not counterbalanced by the slightly positive indicator of Csongrád County. From the southern region, the population migrates to Budapest or the Northern or Western parts of the country, while Csongrád County (especially Szeged) attracts population mainly from the other southern counties (BALCSÓK and DANCS, 2009).
At the same time, besides Bucharest, the two southwestern counties of Romania have been the top destination for migration for decades. Both Arad and Timiş counties have a positive migration balance. Moreover, the excess rate in Timiş is twice the value of Arad County. Arad and Timişoara are located in the most developed region of Romania outside the capital city. They are close to each other and show signs of building a metropolitan area. They form a tandem with serious competitive background due to their industrial culture and civic traditions. The closer position to the Western European market, the resulting investments and the created jobs, as well as the above mentioned advantages is reflected in a significant population attraction. The population from Moldova and Oltenia has been attracted by the increasing emigration of the German population to Western Germany since the 1970s (VERES, 2009).
-10.0 -8.0 -6.0 -4.0 -2.0 0.0 0 4.0 6.0 8.0 100
2005 2006 2007 2008 2009
‰ Arad
Timiş Csongrád Békés
Figure 16. Migration balance in the counties of the studied region Source: National Institute of Statistics, Központi Statisztikai Hivatal
66 67 68 69 70 71 72 73 74 75
Arad Timiş Csongrád Békés Romania Hungary
At village level, it is obvious that the territorial mobility of the Hungarian villages is higher than that of the Romanian villages, as there is a higher willingness for the migration of the population. The high rate of the in-migrants is closely correlated with the values of the positive migration balance. Generally, the cities, county capitals and, in Hungary, the neighboring areas of the county capitals attract larger numbers of population.
Out-migration is present in Békés County, in its border area of Bihar and in the peripheral hilly and mountainous areas of Arad and
Timiş counties, a fact that results
in population ageing.
The most significant positive migration balance is characteristic for the cities with better job offers and infrastructure. It is interesting to notice that the migration excess in the neighboring settlements of the county capitals in Romania is not that significant in the first decade of the new millennium as it is on the Hungarian side of the border. Moreover, Timişoara is capable to attract more population than the villages in its vicinity. This means that in this region the sub-urbanization processes of the Romanian cities are not so intense.
Figure 17. The average rate of in-migrants
in 2000 – 2007
Source: National Institute of Statistics, Központi Statisztikai Hivatal
Figure 18. The average rate of out-migrants
in 2000 – 2007
Source: National Institute of Statistics, Központi Statisztikai Hivatal
CONCLUSIONS
On the whole, we can state that from the point of view of demographic processes the region is in an unfavorable situation and, moreover, this situation is not new. On the Romanian side, the southwestern region has been a low natural growth area for decades and an area struck by natural decrease; this situation could not be counterbalanced by the fact that it is a favorite destination for in-migrants. On the Hungarian side, Csongrád County’s relatively more favorable situation is significantly deteriorated because of Békés County’s negative values. This is only topped by the fact that this region leads the suicide rate statistics in Hungary.
At the same time, one may notice an interesting difference if we compare the studied counties with the neighboring counties of the northern part of the border (Bihor, Satu Mare, Szabolcs-Szatmár-Bereg and Hajdú-Bihar). In the northern part it is more obvious that the narrower borderline region is more disadvantaged from a demographic point of view, so the demographic crisis indicators are spatially more concentrated near the border; that is in the positional periphery. It is not possible to say the same thing about the southern part of the border region, where the positive as well as the negative demographic indicators are more dispersed spatially and they cannot be unambiguously regionalized. There would be an exception though, on the micro-regional level, in north-eastern Békés, the former Bihar parts and the Sarkad micro-region. This area can be identified as a demographic depression region, which is near the borderline – thus it is both a positional and social periphery.
ACKNOWLEDGEMENTS
The study was drawn up with the help of ”Bolyai János” research grant of the Hungarian Academy.
REFERENCES
BALCSÓK,I., DANCS,L. (2009), Társadalmi jellemzők a Dél-Alföldön. Népesség, demográfia, [Social Characteristics in Dél-Alföld Region. Population, Demography], in: NAGY G. (coord.), A Kárpát-medence régiói 10. Dél-Alföld [The Regions of the Carpathian Basin 10. Dél-Alföld], MTA-RKK, Dialóg-Campus kiadó, Budapest-Pécs, pp. 126-137.
BARANYI,B. (2004), A határmentiség dimenziói. Magyarország keleti államhatárai [The Dimensions of Cross-Border Cooperation. The Eastern Borders of Hungary], Dialóg Campus, Budapest-Pécs.
NAGY,E. (2006), Demographic Tendencies in the Cross-Border Region of Satu Mare and Szabolcs-Szatmár-Bereg Counties, in: Romanian Review of Regional Studies, no. 1, Cluj-Napoca, pp. 85-95.
NAGY, I. (coord.) (2004), A Strategy for the Danube-Criş-Mureş-Tisa Euroregion, Hungarian Academy of Science, Centre for Regional Studies, Alföld Institute, Békéscsaba.
KEREKES,K. (2009), Humán erőforrások [Human Resources], in: HORVÁTH GY. (coord.), A Kárpát-medence régiói 9. Dél-Erdély és Bánság Alföld [The Regions of the Carpathian Basin 9. Southern-Transylvania and Banat], MTA-RKK, Dialóg-Campus kiadó, Budapest-Pécs, pp. 185-215.
PÁL, Á. (2001), Településalkotó szférák vizsgálata a Dél-Alföld országhatár mentén fekvő kisvárosaiban a határ két oldalán [The Analysis of Settlement-Formating Factors in the Case of Little Towns on the Two Sides of the Border in Dél-Alföld Region], Földrajzi Konferencia, Szeged, p. 16.
VERES, V. (2009), Népesség [Population], in: HORVÁTH GY. (coord.), A Kárpát-medence régiói 9. Dél-Erdély és Bánság [The Regions of the Carpathian Basin 9. Southern-Transylvania and Banat], MTA-RKK, Dialóg-Campus kiadó, Budapest-Pécs, pp. 155-185.
*** (2009), Anuarul Statistic al Judeţului Timiş [Statistical Yearbook of Timiş County], Institutul
*** (2010), Azonosságok és különbségek a magyarországi Dél-alföldi és romániai Vest régiók között [Similarities and Differences between the Hungarian Southern Plain Region and the Romanian West Region], Központi Statisztikai Hivatal Szegedi Igazgatósága, Institutul Naţional de
Statistică, Direcţia Regională de Statistică Timiş, Szeged.
*** (2011), Statisztikai tájékoztató [Statistical Information], Központi Statisztikai Hivatal, Békés megye, retrieved 1 June 2011 from www.ksh.hu.
*** (2011), Statisztikai tájékoztató [Statistical Information], Központi Statisztikai Hivatal, Csongrád megye, retrieved 1 June 2011 from www.ksh.hu.