Authors
Fernando Antonio de Almeida1
Henrique Pinheiro Konigsfeld2
Lígia Maria de Oliveira Machado2
Andréa Farias Canadas2 Evelyn Yuri Okumura Issa2
Roberto Hernandes Giordano2
Ricardo Augusto de Miranda Cadaval3
1Cornell University Medical College; Faculdade de Ciências Médicas e da Saúde of Pontifícia Universidade Católica de São Paulo (PUC/SP).
2Faculdade de Ciências Médicas e da Saúde (campus Sorocaba)
of PUC/SP.
3Universidade Federal de São Paulo (UNIFESP); Faculdade de Ciências Médicas e da Saúde (campus Sorocaba) of PUC/SP.
Submitted on: 12/08/2010 Accepted on: 23/09/2010
Correspondence to: Fernando Antonio de Almeida
Rua Ilda do Amaral Cussiol, 155
Residencial Isaura Zip code: 18047-594 – Sorocaba (SP), Brazil E-mail: faalmeida@globo. com
Study carried out at
Faculdade de Ciências Medicas e da Saúde
of PUC-SP (campus Sorocaba).
The authors declare no conlict of interest.
Scientiic initiation scholarships by CNPq and PUC-SP.
A
BSTRACTIntroduction: The high prevalence of hypertension in high school students in Sorocaba, São Paulo, Brazil, has al-ready been described. In this study, within a new sample of high school stu-dents from public and private schools, we evaluated if socioeconomic and life-style influence on blood pressure values.
Methods: This is an epidemiological study, which is part of the activities of a community-based work conducted by medical students. They give speeches to high school students aiming at stimu-lating a healthy lifestyle and primary prevention of hypertension. In a ran-dom sample of 410 students in junior high school (209 from public schools and 201 from private schools), we de-termined the weight, height, and blood pressure, furthermore, a questionnaire identifying epidemiological and socio-economic status was applied. Results: No statistical differences were found among students from public and private schools regarding the distribution of gender, body mass index (BMI), systolic and diastolic blood pressure, prevalence of hypertension (16.3%), percentage of smokers (5.9%), regular physical activ-ity, and family history of hypertension. In public schools, there is a higher per-centage of African descendents students and a higher percentage of students who also work due to low family income. Men from public and private schools have higher prevalence of hypertension, and their mean blood pressure is higher than in women. BMI has a positive cor-relation with systolic and diastolic blood pressure. Conclusions: Hypertension and other cardiovascular risk factors have an early beginning and require
R
ESUMOIntrodução: Anteriormente, a alta preva-lência de hipertensão arterial em alunos do Ensino Médio de Sorocaba, em São Paulo, foi descrita. Neste estudo, em nova amostra de alunos da mesma faixa etária, oriundos de escolas públicas e privadas, foi avaliado se as diferenças socioeconô-micas e o modo de vida podem influenciar os valores da pressão arterial. Métodos: Trata-se de um estudo epidemiológico, inserido entre as atividades de um traba-lho comunitário, em que estudantes de Medicina fazem palestras para alunos do Ensino Médio, objetivando estimular há-bitos de vida saudáveis e a prevenção pri-mária da hipertensão arterial. Em amostra aleatória de 410 alunos do segundo ano do Ensino Médio (209 de escolas públicas e 201 de escolas privadas), foram determi-nados o peso, a altura e a pressão arterial, e foi aplicado um questionário epidemio-lógico e socioeconômico. Resultados: Não há diferenças estatísticas entre os alunos das escolas públicas e privadas quanto à distribuição de sexo, ao índice de massa corporal (IMC), à pressão arterial sistólica e diastólica, à prevalência de hipertensão arterial (16,3%), à porcentagem de fu-mantes (5,9%), à atividade física regular e aos antecedentes familiares de hipertensão arterial. Nas escolas públicas há maior porcentagem de afro-descendentes, os alu-nos trabalham fora de casa com maior fre-quência e têm menor renda familiar. Nas escolas públicas e privadas, os homens têm maior prevalência de hipertensão ar-terial e a média da pressão arar-terial é maior que nas mulheres. O IMC tem correlação positiva com a pressão arterial sistólica e diastólica. Conclusões: A hipertensão ar-terial e outros fatores de risco cardiovas-culares têm início precoce e necessitam de
Assessment of social and economic inluences on blood
pressure of adolescents in public and private schools. An
epidemiological study
I
NTRODUCTIONHypertension is one of the most common diseases in adults. Brazilian regional epidemiologic data indi-cate that this prevalence ranges from 22 to 44%,1-9
resulting in high costs for the people and also for the health system, since it strongly contributes with the increase in cardiovascular and renal morbidity and mortality.1,10-12
There are many risk factors involved in the gen-esis of hypertension, such as: heredity, age, gender, race, obesity/overweight, excessive consumption of salt and alcohol, sedentary lifestyle, and, according to some studies, stress.1 The disease has an
asymptom-atic clinical course, and its clinical manifestations are late complications. However, hypertension has dev-astating consequences, for it is the main risk factor for cerebrovascular accidents (CVA) and congestive heart failure (CHF). It is also the main cause of end-stage renal disease in Brazil, leading to the need for re-nal replacement therapy, and the third risk factor for myocardial infarction.1,10-17 These characteristics are
relevant for the public health system, since the proper control of blood pressure (BP) in compromised indi-viduals and the primary prevention of the disease are the most effective initiatives to reduce the long-term complications.18-21
To date, there has not been such a broad epi-demiological evaluation regarding hypertension in the Brazilian population of different ages.22,23 In the
1990s, the state of Rio de Janeiro was the first to demonstrate the worrisome prevalence of hyperten-sion among children and adolescents.23
Besides, the follow-up of these adolescents at long term has shown a greater risk of disease progression, especially for obese or overweight patients.24,25 Recent
regional studies have confirmed the high prevalence of hypertension in youngsters. In Maceió, Moura et al. observed that the prevalence of hypertension in adolescents at the age of 15 to 17 years reaches the alarming proportion of 13.3%.26
Thus, it is important that primary prevention be-gin early. It is recommended that blood pressure be
measured in all pediatric evaluations after the age of three. The blood pressure cuff must have the proper size, considering the reference values for age, height and gender.1,27
Because the disease is asymptomatic, multifac-torial and progressive, we believe that the younger the population, the more favorable it is to perform early detection and primary prevention. In previous reports, the extracurricular activities carried out by medical students were described as a complementary strategy of medical teaching and as a way to primar-ily prevent hypertension.28,29 In this similar
popula-tion of youngsters, the high prevalence of the disease had been previously observed.28,29
At the time, the following question came up: can socioeconomic differences among families with higher and lower incomes, which result in different lifestyles for all the members, interfere in blood pres-sure values? It is a known fact that youngsters com-ing from families with lower incomes study in public schools, so the expenses with education are also low-er. Together with their studies, many of them have the need to perform activities and earn resources in order to contribute with the family income.
Such socioeconomic and lifestyle differences, in comparison to the youngsters who go to private schools, may originate psychosocial stress and inter-fere in the behavior of biological variables at an age of great transformation.
The objective of this study was to evaluate wheth-er or not socioeconomic and lifestyle diffwheth-erences be-tween public and private school students influence the anthropometric variables, the distribution of blood pressure values and the prevalence of hypertension at this stage of life.
M
ETHODSThis study was carried out by medical students from the second to the sixth year of Faculdade de Ciências Médicas e da Saúde, at Pontifícia Universidade Católica de São Paulo (PUC – Sorocaba – São Paulo), under the orientation of Nephrology staff. educational interventions for primary prevention.
Socioeconomic factors do not affect blood pressure in adolescence.
Keywords: adolescent, blood pressure, hypertension,
smoking, overweight.
intervenções educativas para a prevenção primária. Fatores socioeconômicos não influenciam a pressão arterial na adolescência.
Palavras-chave: adolescente, pressão arterial,
The participants were prepared to offer technical information about the disease and to maintain a pedagogic and psychological behavior compatible with the performed activity. Public and private high schools of Sorocaba (São Paulo) were randomly chosen, and the previously scheduled activity was performed during regular classes of the second year of high school. Initially, medical students did 20-minute presentations with the objective of informing high school students about: how to determine the blood pressure, what hypertension and its conse-quences are, risk factors and the most effective ways to prevent it. They used audiovisual projection with accessible, attractive and encouraging language. The research project and the informed consent form were in compliance with the resolution 196/96 and com-plementary rules by the National Health Council, and were previously approved by the Research Ethics Committee of Faculdade de Ciências Médicas e da Saúde, PUC-SP.
QUESTIONNAIRES
Before the presentations, the informed consent form and a questionnaire were given to the participants in order to gather demographic, social and economic data. The questionnaire also aimed at identifying, by means of simple questions, previous knowledge students might have on hypertension and its risk factors.
SAMPLETO GAUGE DETERMINEBLOODPRESSURE
At the end of each presentation, a portion of approxi-mately 20% of the students who had had their blood pressure, weight and height measured, was randomly selected. In this study, we present the results of 410 students whose demographic, epidemiological and so-cial data were complete. Out of the analyzed students, 201 were from private schools and 209 were from public schools. This sample refers to 1.2% of the esti-mated population at this age range in Sorocaba (census 2000, Brazilian Institute of Geography and Statistics, updated). Since the mean age of the assessed students was 16.3 years, according to the census 2000 it was confirmed that, in Sorocaba, there was no percentage variety in male and female populations between 15 and 20 years old.
DETERMINING BLOODPRESSURE
Blood pressure was determined and classified ac-cording to the guidelines proposed by V Diretrizes Brasileiras de Hipertensão Arterial and by Quarto
Relatório para o Diagnóstico, Avaliação e o Tratamento da Hipertensão Arterial na Infância e Adolescência 1,27.
Systolic pressure was considered to be phase I (appearance of consecutive heartbeats) and diastolic pressure as phase V (disappearance) of the sounds described by Korotkoff. Brachial circumference was measured at the middle third of the non-dominant arm immediately before the determination of blood pressure, which was performed with mercury column sphygmomanometers, periodically checked, with the use of blood pressure cuffs adjusted for the brachial length and circumference of each individual. Blood pressure was determined three consecutive times, with the student comfortably seated for at least five minutes, with an interval of at least one minute be-tween measurements. When systolic or diastolic pres-sure differed in 6 mmHg or more, such meapres-sures were discarded, and three new ones were performed. For statistical purposes, the blood pressure of each indi-vidual, with the mean of the three determinations, was considered
According to the guidelines recommendations, sys-tolic and diassys-tolic blood pressure values were considered normal when inferior to 90th percentile as long as the blood
pressure was < 120/80 mmHg. Blood pressure values from 90th to 95th percentiles, or blood pressure ≥ 120/80
mmHg, even with values inferior to 90th percentile, were
classiied as “borderline”. Blood pressure values between 95th and 99th percentiles plus 5 mmHg were classiied as
“stage 1 hypertension”; values above 99th percentile plus
5 mmHg were classiied as “stage 2 hypertension”.1,27
STANDARDIZINGDEMOGRAPHICAND EPIDEMIOLOGICALPARAMETERS
Age values were analyzed as whole numbers, rounded up or down to the closest value. Weight and height were determined by an anthropometric scale, with standard clothing, and no shoes or sweaters. Body mass index (BMI) was calculated as the ratio of weight (kg) to the squared height (m2). Racial classification
to the opinions of at least 2/3. If the individual regu-larly smoked any number of cigarettes, this person was classified as “smoker”. Those who practiced sports or aerobic activities at least three times a week for 30 minutes were considered to perform “regular physical activity”. Those with family history of hy-pertension (parents, grandparents or siblings) were classified as “present”; on the other hand, those who had no knowledge about hypertension in the family and whose relatives also did not know if they had this condition were considered to be “absent”.
STATISTICAL ANALYSIS
Statistical analysis was performed by the program
Instat for Windows, version 3.05, GraphPad software,
San Diego (USA). The Fisher’s exact test was used to compare proportions, and the Pearson’s correlation coefficient to correlate continuous variables. Bicaudal Student’s t-test for independent samples was used to compare the mean of continuous variables. A 5% sig-nificance level was established to reject the null hypoth-esis. However, the significance level for each analysis is expressed in text and graphics. Data are presented as mean and standard deviation of the mean.
R
ESULTSFrom the sample of 410 students, 209 went to public schools and 201 went to private schools. Table 1 pres-ents demographic and epidemiological characteristics of these samples. Note that students in public schools were older than the ones in the private schools (p < 0.01), even though they were all in the second year of high school. Besides this slight but significant age difference, no other statistically significant differences were observed as to the distribution of gender, BMI, frequency of family history of hypertension, propor-tion of people who regularly practiced exercise and proportion of smokers among the students in public and private schools.
In high schools, both public and private ones, fe-males were predominant in the classrooms. As to eth-nicity, African descendants were at a larger propor-tion in public schools when compared to the private ones (p< 0.01). The proportion of students who had a regular job outside the household combined with school activities is larger at public school students (19.1%) than at private schools (6.5%). The per-centage of students in public schools with a family income higher than R$ 1.000 a month (45.6%) was small when compared to students in private schools (96.9%; p<0.01).
BLOODPRESSURE
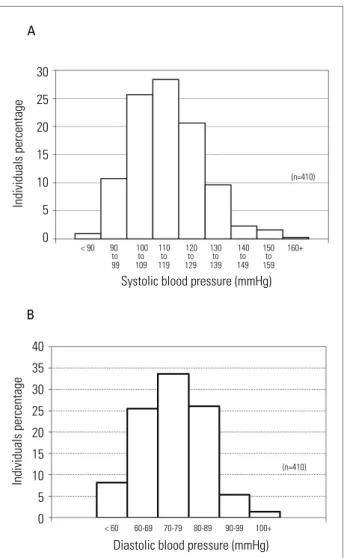
Figure 1 presents the distribution of the frequency of systolic (A) and diastolic (B) blood pressure values in the sample population (n = 410). As expected, the sample is representative of the general population be-cause of its normal distribution.
Table 2 presents the mean values of systolic and diastolic blood pressure in males and females and the percentage of youngsters with hypertension in the samples of students analyzed in public schools, private schools and overall. Independently of gender, there are no statistically significant differences between the values of systolic and diastolic pressure in students of public and private schools. The percentage of stu-dents with hypertension did not differ among public (15.8%) and private (16.9%) schools.
There is a larger proportion of African-descendant individuals in public schools (15.5%) in relation to private schools (0.5%), p < 0.01. No statistically sig-nificant differences were found when young African descendants were compared to white students as to systolic and diastolic blood pressure, age and BMI.
Since there were many similarities among students from public and private schools, the whole sample was considered (n = 410) in order to evaluate the de-terminants of blood pressure. As to the gender, at this age range, blood pressure values were higher in men than in women (p < 0.01); likewise, in men there was a higher prevalence of increased blood pressure val-ues, classified as “hypertension”, in public and pri-vate schools samples and also in the total number of analyzed students (Table 2; p < 0.01). Among the in-dividuals who were classified as “pre-hypertensive”, no statistically significant difference was observed between genders in private (women = 16%, men = 20.8%) or public schools (women = 10.7%, men = 6.8%). When analyzing the entire sample of students (n = 410), the prevalence of pre-hypertension between genders presented no differences (women = 11.6%, men = 14.8%).
Figure 1. Systolic (A) and diastolic (B) blood pressure values in high school adolescents of Sorocaba (SP, Brazil).
Individuals percentage
Systolic blood pressure (mmHg) 30
25
20
15
10
5
0 A
< 90 90 100 110 120 130 140 150 160+
to to to to to to to
99 109 119 129 139 149 159
(n=410)
Individuals percentage
Diastolic blood pressure (mmHg) 40
35 30 25 20 15 10 5 0 B
< 60 60-69 70-79 80-89 90-99 100+
(n=410)
±13.2 mmHg, and in white students it was 73.8 ±
10.9 mmHg, also a non-significant difference. Only twelve Asian students were assessed in all vis-ited schools, and their systolic (113.8 ± 12.8 mmHg) and diastolic (70.5 ±11.6 mmHg) blood pressure val-ues did not differ from those of other ethnicities.
When analyzing the relation between BMI and blood pressure, there is a positive and significant cor-relation between BMI and the systolic pressure (r = 0.39, p < 0.01), as well as in relation to the diastolic pressure (r = 0.29, p < 0.01). Figure 2 presents the graphic of distribution of individual values, correlat-ing systolic blood pressure and BMI.
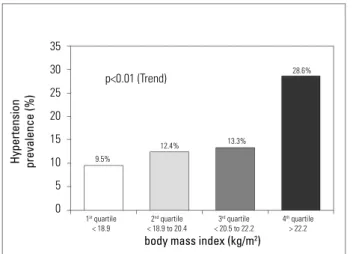
Likewise, in the analysis of the proportion of ado-lescents classified as “hypertensive” in relation to the BMI quartile, a positive relationship was identified, which means that as the BMI increases, so does the proportion of hypertensive adolescents (p < 0.01 for tendency), as shown in Figure 3.
D
ISCUSSIONThe initial experience of community work performed by medical students with high school adolescents was subject of previous publications.28,29 Some years ago,
medical students performed educational work in high schools of Sorocaba (São Paulo), under the orienta-tion of faculty members of Nephrology.28 The
activ-ity consisted of a multimedia presentation about the concept of hypertension, the main characteristics of the disease, its long-term risks and information on
Values expressed as mean ± standard deviation. 1See characterization of African descendants in the text; 2At least one relative
(parents, grandparents or siblings) with hypertension; 3At least 30 minutes, three times a week; *p < 0.01 public versus private schools. Table 1 DEMOGRAPHIC, EPIDEMIOLOGICAL, ANDSOCIOECONOMICCHARACTERISTICSOFTHESTUDENTSFROMPUBLIC
ANDPRIVATESCHOOLS
Parameter Public schools
(n = 209)
Private schools
(n = 201)
Total
(n = 410)
Age (years) 16.6 ± 0.6* 16.2 ± 0.6 16.3 ± 0.6
Males 43.5% 45.2% 44.4%
Body mass index (kg/m2) 20.7 ± 2.9 21.0 ± 3.0 20.9 ± 2.9
African descendants1 15.5%* 0.5% 8.0%
Family history of hypertension2 76.7% 70.7% 73.7%
Regular physical exercise3 70.8% 69.5% 70.1%
Smokers 6.7% 5% 5.9%
Regular work outside the household 19.1%* 6.5% 12.8%
prevention. Then, all interested students had their blood pressure checked. At the same time, in a formal and random sample of students, an epidemiological inquiry was performed, and the blood pressure was determined aiming to evaluate the hypertension prev-alence in this age group.
Previous studies analyzed preexisting knowl-edge about hypertension, its consequences, pre-vention, knowledge acquired during the lectures, and the distribution of blood pressure among the assessed individuals.28,29 When analyzing this
in-formation, the question came up: can social and economic differences influence blood pressure val-ues and the prevalence of hypertension at this age? So, the present study was designed to evaluate that possibility.
Although the present sample assessed only 1.2% of the estimated population, we believed that it is rep-resentative of students at this age range. The sample was randomly selected and, as expected, blood pres-sure values had normal distribution.
The key question of the study was: can behavior, social and economic variables influence blood pres-sure in this age group? The strategy to compare this variables in students from public and private schools seemed to be more appropriate.
Current data confirm the existing social and eco-nomic differences among students from private and public schools. Such differences are represented by a larger proportion of students from public schools who have a regular job besides school activities; also, they live with a lower family income. However, these
200
150
100
50
Systolic blood pressure (mmHg)
body mass index (Kg/m2)
10 15 20 25 30 35 40
r=0.39 p<0.01
Figure 2. Correlation between individual systolic blood pressure values and body mass index
Figure 3. Prevalence of hypertension as to body mass index quartiles.
35
30
25
20
15
10
5
0
Hypertension prevalence (%)
body mass index (kg/m2)
1st quartile
< 18.9
2nd quartile
< 18.9 to 20.4
3rd quartile
< 20.5 to 22.2
4th quartile
> 22.2 9.5%
12.4% 13.3%
28.6%
p<0.01 (Trend)
Table 2 BLOODPRESSUREVALUESANDPERCENTAGEOFHIGHSCHOOLSTUDENTSWITHHYPERTENSIONIN SOROCABA,
SÃO PAULO
Values expressed in mean ± standard deviation. 1According to V Diretrizes Brasileiras de Hipertensão Arterial1; *p < 0.01 men versus
Parameters Public schools
(n = 209)
Private schools
(n = 201)
Total
(n = 410)
Systolic blood pressure (mmHg) 114.9 ± 12,6 114,4 ± 13.7 114.7 ± 13.1
Diastolic blood pressure (mmHg) 73.6 ± 11.1 74.2 ± 11.0 73.9 ± 11.1
Systolic blood pressure in women (mmHg) 112.2 ± 11.1 109.3 ± 12.3 110.9 ± 11.7
Systolic blood pressure in men (mmHg) 119.1 ± 14.6* 120.7 ± 12.8* 119.9 ± 13.8*
Diastolic blood pressure in women (mmHg) 72.0 ± 10.0 72.4 ± 10.2 72.2 ± 10.1
Diastolic blood pressure in men (mmHg) 76.0 ± 12.1* 76.5 ± 11.6* 76.2 ± 11.8*
Students with arterial hypertension1 15.8% 16.9% 16.3%
Men with arterial hypertension1 22.0%* 26.4%* 24.2%*
socioeconomic differences do not influence blood pressure values at this age, since we found no dif-ferences among the mean values of systolic and dia-stolic blood pressure. No significant difference was observed as to the prevalence of hypertension among students of public (15.8%) and private (16.9%) schools. Ethnicity represented by a larger proportion of African descendant students at public schools did not influence blood pressure values.
Also regarding blood pressure values, these data confirm other epidemiological studies which indi-cate a higher prevalence of hypertension among men at this age.4,6,22-24,26,27,29 The study presented twice
as many men with hypertension when compared to women. Like other studies made with children and adolescents, we observed that overweight is closely related to the increase in blood pressure in this age group.23,24,27 A positive correlation between systolic
and diastolic blood pressure values and BMI was found. When blood pressure values were analyzed as to BMI quartile, we observed that the prevalence of hypertension progressively increased from the lower to the upper BMI quartile.
At public schools, the mean age of students was superior to private schools. Since all students were on the second year of high school, this might reflect the access to school at an older age or the higher frequen-cy at repeating school years in students coming from public schools. There were no differences between groups as to gender distribution, regular practice of exercise, smoking habit and family history of hyper-tension. The percentage of smokers at this age range (5.9%) is already a point of concern from the public health point of view.
This data suggest that nutritional orientation as-sociated with regular exercise should be the focus of adolescents’ education. This could contribute with the primary prevention of hypertension and other over-weight-related complications, besides being the main therapeutic approach for those who already have high blood pressure.23-28
In this study, we observed that even though stu-dents from public schools are African descendants, work outside the household at a larger proportion and have lower family income, they do not present significant differences as to the distribution of blood pressure and anthropometric values. The prevalence of hypertension in students at the age of 16 is around 16%, and is clearly associated with overweight, most-ly among males. The percentage of smokers at this age range is also alarming. When combined, these risk factors for cardiovascular diseases, which are already
present at such a young age, explain future cardio-vascular and renal complications. That is why they should be the main focus of attention, orientation, education and intervention in order to prevent such diseases.
ACKNOWLEDGMENTS
We thank the Program of Scientific Initiation Scholarships from PUC-SP for providing scholar-ships (Conselho Nacional de Desenvolvimento Científico e Tecnológico – CNPq and CEPE); we thank all the students who participated in the edu-cational project to prevent hypertension in the high schools of Sorocaba: Henrique Pinheiro Konigsfeld, Lígia Maria de Oliveira Machado, Henri Augusto Korkes, Flavia Teixeira Machado, Glauco Eduatdo Saura, Karen Moreno Nascimento, Andréa Farias Canadas, Evelyn Yuri Okumura Issa, Marília Soares e Silva Arcadipane, Roberto Hernandes Giordano.
R
EFERENCES1. V Diretrizes Brasileiras de Hipertensão Arterial. Arq Bras Cardiol 2007; 89:e24-78.
2. Carvalho JJM, Silva NAS, Oliveira JM, Arguelles E, Silva JAF. Pressão arterial e grupos sociais. Estudo epidemiológico. Arq Bras Cardiol 1983; 40:115-20. 3. Ayres JEM. Prevalência da hipertensão arterial
na Cidade de Piracicaba. Arq Bras Cardiol 1991; 57:33-6.
4. Fuchs FD, Moreira LB, Moraes RS, Bredemeier K, Cardozo SC. Prevalência de hipertensão arterial sistêmica e fatores associados na Região Urbana de Porto Alegre. Estudo de base populacional. Arq Bras Cardiol 1995; 63:473-9.
5. Freitas OC, Carvalho FR, Neves JM, Veludo PK, Pereira
RS, Gonçalves RM et al. Prevalência da hipertensão
arterial sistêmica na população urbana de Catanduva, SP. Arq Bras Cardiol 2001; 77:9-15.
6. Cipullo JP, Martin JF, Ciorlia LA, Godoy MR, Cação
JC, Loureiro AA et al. Hypertension prevalence and
risk factors in a Brazilian urban population. Arq Bras Cardiol 2010; 94:519-26.
7. Rosário TM, Scala LCNS, França GVA, Pereira MRG, Jardim PCBV. Prevalência, controle e tratamento da hipertensão arterial sistêmica em Nobres-MT. Arq Bras Cardiol 2009; 93:672-8.
8. Pereira M, Lunet N, Azevedo A, Barros H. Differences in prevalence, awareness, treatment and control of hypertension between developing and developed countries. J Hypertension 2009; 27:963-75.
9. Jardim PCV, Peixoto MR, Monego E, Moreira H,
Vitorino PVO, Souza WSBS et al. Hipertensão arterial
e alguns fatores de risco em uma Capital Brasileira. Arq Bras Cardiol 2007; 88:452-7.
11. DATASUS. Informações de saúde – Epidemiológicas e morbidade [2011 cited april 18]. Accessible at: http:// www.datasus.gov.br.
12. Sesso R, Lopes AA, Thomé FS, Bevilacqua JL, Romão Jr JE, Lugon J. Relatório do Censo Brasileiro de Diálise, 2008. J Bras Nefrol 2008; 30:233-8.
13. MacMahon S, Peto R, Cutler J, Collins R, Sorlie P,
Neaton J et al. Blood pressure, stroke, and coronary
heart disease. Part 1, prolonged differences in blood pressure: prospective observational studies corrected for
the regression dilution bias. Lancet1990; 335:765-74.
14. Stokes J 3rd, Kannel WB, Wolf PA, D’Agostino RB, Cupples LA. Blood pressure as a risk factor for cardiovascular disease. The Framingham Study-30 years of follow-up. Hypertension 1989; 13:I-13-8. 15. United States Renal Data System. 2009 US Renal Data
System Annual Report [cited 2011 april 18]. Accessible at: http://www.usrds.org/2009/usrds_booklet_09.pdf. 16. D’Ávila R, Guerra EMM, Rodrigues CIS, Fernandes
FA, Cadaval RAM, Almeida FA. Sobrevida de pacientes renais crônicos em diálise peritoneal e hemodiálise. J Bras Nefrol 1999; 21:13-21.
17. Yusuf S, Hawken S, Ounpuu S, Dans T, Avezum A,
Lanas F et al. INTERHEART Study Investigators. Effect
of potentially modifiable risk factors associated with myocardial infarction in 52 countries (the INTERHEART study): case-control study. Lancet 2004; 364:937-52. 18. Collins R, Peto R, MacMahon S, Hebert P, Fiebach NH,
Eberlein KA et al. Blood pressure, stroke, and coronary
heart disease. Part 2: Short-term reductions in blood pressure: overview of randomized drug trials in their epidemiological context. Lancet 1990; 335:827-38. 19. SHEP Cooperative Research Group. Prevention of
stroke by antihypertensive drug treatment in older persons with Systolic Hypertension in the Elderly Program (SHEP). JAMA 1991; 265:3255-64.
20. Hansson L, Zanchetti A, Carruthers SG, Dahlof B,
Elmfeldt D, Julius S et al. Effects of intensive
blood-pressure lowering and low-dose aspirin in patients with hypertension: principal results of Hypertension Optimal Treatment (HOT) randomized trial. Lancet 1998; 351:1755-62.
21. Bakris GL, Williams M, Dworkin L, Elliott WJ,
Epstein M, Toto R et al. National Kidney Foundation
Hypertension and Diabetes Executive Committees Working Group. Preserving renal function in adults with hypertension and diabetes: a consensus approach. Am J Kidney Dis 2000; 36:646-61.
22. Almeida DB, Habermann F, Soares VA, Monteiro Filho
RC, Ferreira ES, Abujamra Júnior O et al. Estudo
comparativo da pressão arterial e da prevalência de hipertensão arterial em 2 coortes sucessivos (197-1976) de estudantes de 16 a 25 anos, Botucatu, SP, Brasil. Rev Saúde Publ 1978; 12:497-505.
23. Brandão AA, Pozzan R, Albanesi Filho FM, Brandão AP. Role of anthropometric indexes and blood pressure as determinants of left ventricular mass and geometry in adolescents. The Rio de Janeiro Study. Hypertension 1995; 26:1190-4.
24. Update on the 1987 Task Force Report on High Blood Pressure in Children and Adolescents: A Working Group Report from the National High Blood Pressure Education Program. Pediatrics 1996; 98:649-58.
25. Brandão AA, Pozzan R, Freitas EV, Pozzan R, Magalhães MEC, Brandão AP. Blood Pressure and Overweight in Adolescence and Their Association with Insulin Resistance and Metabolic Syndrome. J Hypertens 2004; 22:111S.
26. Moura AA, Silva MAM, Ferraz MRMT, Rivera IR. Prevalência de pressão arterial elevada em escolares e adolescentes de Maceió. J Pediatr 2004; 80:35-40. 27. National High Blood Pressure Education Program
Working Group on High Blood Pressure in Children and Adolescents. The Fourth Report on the Diagnosis, Evaluation, and Treatment of High Blood Pressure in Children and Adolescents. Pediatrics 2004; 114:555-76.
28. Almeida FA, D’Ávila R, Cadaval RAM, Rodrigues CIS. Prevenção primária e detecção precoce da hipertensão arterial em escolas do ensino médio. Projeto comunitário envolvendo estudantes de medicina. Rev Bras Educ Med 2002; 26:88-93.
29. Almeida FA, Yoshizumi AM, Mota AC, Fernandes
APM, Gushi AC, Nakamoto AYK et al. Distribuição