Self-rated hypertension and anthropometric indicators of body fat in
elderly
DEONILDE BALDUÍNO MUNARETTI,1 ALINE RODRIGUES BARBOSA,2 MARIADE FÁTIMA NUNER MARUCCI,3 MARIA LÚCIA LEBRÃO4 1 M. Sc. in Physical Education; Professor of Health Sciences, Physical Education, Universidade do Oeste de Santa Catarina, Florianópolis, SC
2 Ph.D. in Applied Human Nutrition from Universidade de São Paulo – USP; Associate Professor, Health Sciences, Physical Education, and Nutrition, Universidade Federal de Santa
Catarina – UFSC, Florianópolis, SC
3 Ph.D. in Public Health; Professor at Universidade de São Paulo – USP, São Paulo, SP
4 Ph.D. in Public Health; Full professor in Health Science, Public Health, Epidemiology, Public Health School, USP, São Paulo, SP
From Postgraduation Program in Physical Education, Universidade Federal de Santa Catarina, Florianópolis, SC, Brazil
Submitted on: 06/25/2010
Approved on: 10/12/2010
Financial Support: The SABE Survey was supported by FAPESP (Fundação de Amparo à Pesquisa do Estado de São Paulo) in Brazil.
Corresponding author: Aline Rodrigues Barbosa Departamento de Educação Física Universidade Federal de Santa Catarina – Campus Trindade Florianópolis – SC Phone: 55 48 3721-9980 [email protected]; [email protected]
Conlict of interest: None.
ABSTRACT
Objective: To investigate the association between self-rated hypertension (sf-H) and an-thropometric indicators of body and abdominal fat in elderly from the city of São Paulo. Methods: Data from 1894 elderly was obtained from the Survey on Aging, Health and Well-being (SABE). he anthropometric indicators used were: body mass index (BMI), waist circumference (WC), waist/hip ratio (WHR), and waist/height ratio (WHtR). Bi-nary logistic regression analysis stratiied by gender was used. Results: Hypertension was associated with anthropometric indicators. At the inal model (adjusted for age, education, smoking status, physical activity, and diabetes) in both genders, BMI showed greater statistical power, although it has been similar to other indicators in females. Ex-cept for WHeR in males, sf-H was positively and independently associated with the other indicators. Conclusion: Results suggest the relevance of these indicators for early detec-tion of the risk to develop hypertension and intervendetec-tion in its prevendetec-tion and manage-ment.
INTRODUCTION
High blood pressure is a major health problem all over the world1. In Brazil, the disease is estimated to afect 50% to 70% of elderly individuals2. One of the main risk factors associated with hypertension both in prospective studies4 and cross-sectional studies4-6 in diferent populations is ex-cess body fat.
Regarding the association between hypertension and excess body fat, obesity is usually identiied by body mass index (BMI)6 and abdominal fat is identiied by waist cir-cumference (WC)5,7, waist/hip ratio (WHR)4 or waist/ height ratio (WHtR)8.
However, most studies checking the association be-tween BMI and/or abdominal obesity indicators and hy-pertension occurrence were performed with adults5,6,9 and only a few involved the elderly. However, these study results have been controversial, including with regard to gender3,10, and they analyzed distinguished populations10. While some studies showed BMI6 was the indicator more positively associated with hypertension, others suggested abdominal fat indicators were the most appropriate4.
In the elderly, this relationship is understudied and the best anthropometric indicator to be used to check the as-sociation between hypertension and obesity has not been established yet.
his paper objective was to investigate the association between obesity indicators (BMI, WC, WHR, and WHtR) and presence of hypertension in elderly people from the city of São Paulo.
METHODS
his is an association study based on data from the Survey on Aging, Health and Well-being (SABE), a multicenter, epidemiological, and home based survey performed in seven Latin American and Caribbean countries and it was coordinated by Pan American Health Organization11. In Brazil, the study was coordinated by professors of Uni-versidade de São Paulo Public Health School and covered 2,143 elderly subjects (60 years) of both genders, habitual residents of São Paulo. Sampling procedures for SABE sur-vey were previously described12.
he Survey has been approved by the Ethics Commit-tee and data were obtained through a two-step home inter-view; in the irst step, an interviewer asked questions cov-ering life conditions and health status, while the second step was performed by a couple of interviewers and cov-ered anthropometry and motor performance tests. Data collection occurred from January 2000 to March 2001.
he study population comprised 1894 (88.4%) elderly. he elderly who did not participate in the second step due to refusal (7.5%), death (1.9%), change of address (2%), institu-tionalization (0.1%) and hospitalization (0,1%) was excluded. Anthropometric variables (weight, height, waist and hip circumferences) were measured in triplicate in
am-bulatory elderly by nutritionists or graduation Nutrition students speciically trained for the study, and the mean values were used in the analysis.
Techniques and equipment used were previously de-scribed13.
Self-rated hypertension (response or dependent vari-able) was checked by the question: “Has any doctor or nurse ever said you have high blood pressure, I mean, hyperten-sion?” with a dichotomous choice for an answer (yes or no), corresponding to question C04 in SABE survey question-naire (www.fsp.usp.br/sabe).
Anthropometric indicators (explanatory or inde-pendent variables) were: for body fat – body mass index (BMI = kg/m2), calculated from body mass and height values, considering a hypertension risk when BMI 27 kg/m214; for abdominal fat – waist circumference (WC), considering risk when 88 cm for females and 102 for males; waist/hip ratio (WHR), representing risk when 0.95 for males and 0.80 for females; and waist/height ratio (WHtR), considered as a hypertension risk when values > 0.5016. hese variable required values were obtained from section K in the questionnaire (www.fsp.usp.br/sabe).
Confounding variables were age, regular physical activity practice (yes or no), smoking status (yes, former smoker, never smoker), diabetes (yes or no), education (low, middle, high).
STATISTICS
Mean values, standard deviation, and relative frequencies (%) were presented to describe explanatory variables according to gender. Continuous values were compared using t-test for in-dependent samples. Frequency diferences between categori-cal variables were assessed by the chi-square test.
Bynary logistic regression analysis stratiied by gender was used to determine the association between anthropo-metric indicators (BMI, WC, WHR, WHtR) and hyper-tension. Explanatory variables with relevance to the study (BMI, WC, WHR, and WHtR) were assessed in the models as categorical (dichotomous) variables.
hree logistic regression models were proposed for each anthropometric indicator, with hypertension being a dependent (dichotomous) variable in all of them: 1) ad-justed for age; 2) adad-justed for age and education; 3) adjust-ed for age, adjust-education, smoking status, and regular physical activity (inal model). In all models, the variable diabetes was additionally included (belonging to the causal chain) to assess how much the association could be explained by this covariate presence. Among the confounding variables, age entered the models as continuous variable. Education, smoking status, regular physical activity, and diabetes en-tered the models as categorical variables.
Gender
Study variables Male Female p
AF RF AF RL
Body mass index
No risk 531 72.2 589 55.1 0.001
Risk 204 27.8 479 44.9
Waist circumference
No risk 324 43.9 173 16.1
Risk 414 56.1 901 83.9 0.001
Waist/hip ratio
No risk 493 66.9 152 14.2
Risk 244 33.1 921 85.8 0.001
Waist/height ratio
No risk 87 11.9 115 10.8
Risk 647 88.1 951 82.9 0.482
Education
Low 139 18.2 266 24
Middle 497 65.2 736 66.4
High 126 16.5 106 9.6 0.001
Smoking status
Yes 177 23.1 124 11.2
Former smoker 391 51.0 197 17.7
No 198 25.8 791 71.1 0.001
Physical activity
Yes 227 29.7 267 24
No 537 70.3 846 76 0.006
Diabetes
Yes 122 16.2 214 19.3
No 632 83.8 895 80.7 0.086
Arterial hypertension
Yes 363 47.8 639 57.6
No 397 52.2 470 42.4 0.001
AF, absolute frequency; RF, relative frequency (%).
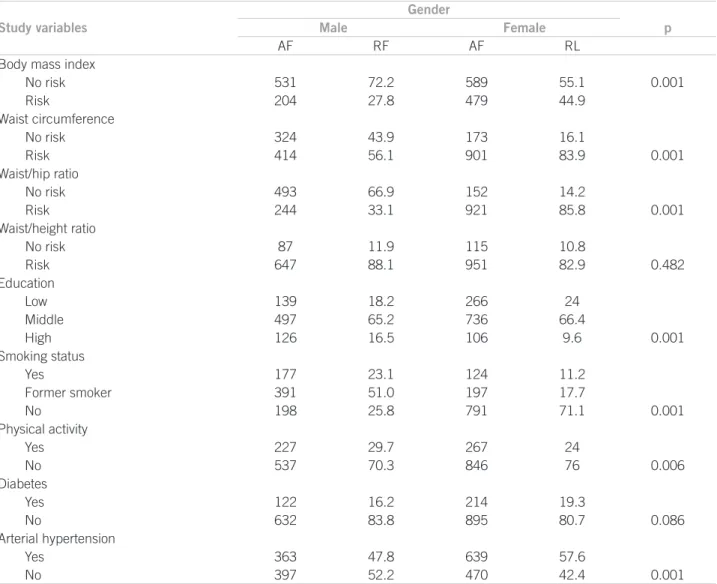
Table 1 – Distribution of elderly from São Paulo according to gender and study variables (SABE-SP, 2000)
RESULTS
he study population comprised 1124 females (59.35%) and 770 males (40.65%), with ages ranging from 60 to 100, and the mean was 72.88 ± 8.39 (standard deviation) for females and 73.77 ± 8.49 for males.
Table 1 shows the study population distribution accord-ing to gender and analyzed variables. Statistical diferences were observed between genders in all variables except for diabetes and WHtR. he highest frequency of smoking and physical activity practice were observed among males, while, in females, there was higher prevalence for BMI, WC, WHR, low education, and hypertension.
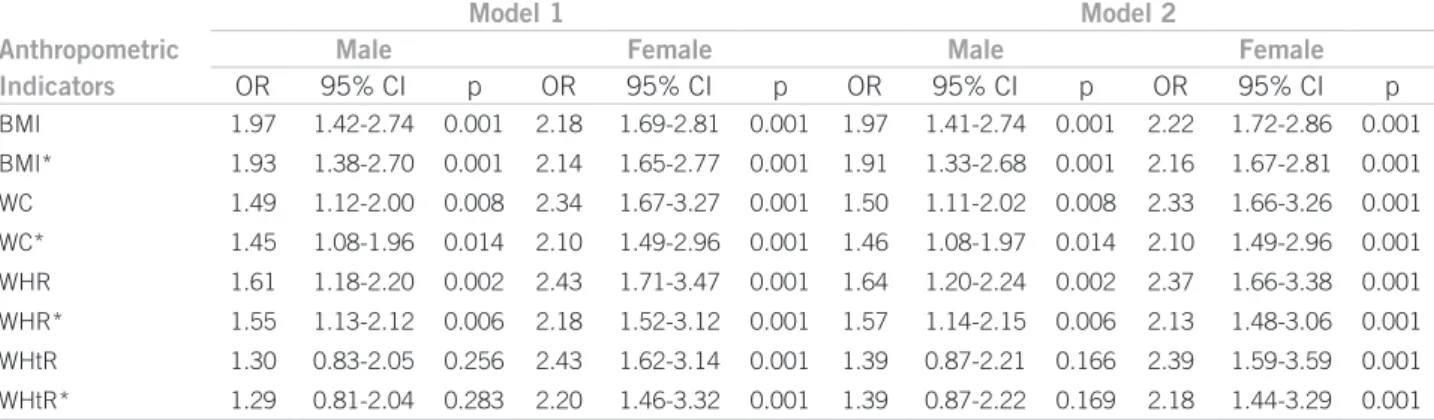
Analysis of the relationship between hypertension and body (BMI) and abdominal (WC, WHR, and WHtR) fat indicators according to gender and adjusted for age showed that all indicators presented an association with hypertension in both genders, except for WHtR in males. Additional adjustment for diabetes contributed to reduce the magnitude in all associations, but it did not change
their meaning. For males, BMI was the indicator most strongly associated with hypertension. For females, all the indicators were similarly associated. In this model, the likelihood of hypertension in males with a BMI value in-dicating obesity was 93% higher than in those men whose BMI did not indicate obesity. For females, the association was nearly twofold higher in women showing BMI, WC, WHR or WHrT values indicating body or abdominal obe-sity (Table 2, model 1).
When education and diabetes were included in the re-gression model (Table 2, model 2), the association between hypertension and anthropometric indicators of abdominal fat according to gender did not present any change in as-sociations, as they showed to be similar to the previous model, adjusted only for age.
Table 2 – Association between hypertension and anthropometric indicators of body and abdominal fat according to gender, adjusted for age (model 1) and age and education (model 2) (SABE-SP, 2000)
Table 3 – Association between hypertension and anthropometric indicators of body and abdominal fat according to gender,
adjusted for age, Education, smoking status, and physical activity (SABE-SP, 2000)
genders (Table 3). he inal model, adjusted for diabetes, showed BMI was the indicator associated with greater sta-tistical power to hypertension in the elderly of both sexes, although being similar to other indicators in females. In this model, the likelihood of hypertension development in elderly with BMI 27 kg/m2, which was considered a risk factor, is 85% higher in males and 2.18 times higher in fe-males, compared to those whose BMI value was < 27 kg/m2, which was considered risk-free.
DISCUSSION
This is the first population- and home-based study checking the association between hypertension and (body and abdominal) fat anthropometric indicators in Brazilian elderly. The study had an elderly population representative sample from the city of São Paulo, with data being collected by interviewers specifically trained for the SABE survey.
In this study, (body and abdominal) fat anthropomet-ric indicators showed an association with hypertension, corroborating the results of other studies performed with subjects from diferent populations and age groups, with excess fat being considered, regardless the anthropo-metric indicator used, one of the major risk factors for
hypertension, and with abdominal fat being considered an additional predictive factor to hypertension develop-ment3,6,17. h his fact probably can be explained by physi- is fact probably can be explained by physi-ological changes occurring in obese subjects, such as a sympathetic nervous system and/or renin-angiotensin-aldosterone system activation and/or endothelial dys-function and dys-function abnormalities18.
his study’s results showed the association between hypertension and anthropometric indicators had a few diferences, according to the gender. For males, the asso-ciation between WHtR and the disease was not observed, whereas BMI was the indicator most strongly associated with hypertension. For females, all indicators were simi-larly associated with hypertension.
BMI is the indicator most oten used in epidemiologi-cal studies2,6,8,19,20, including elderly studies, even though there is no consensus on the more appropriate criteria/ values to deine obesity in that age group. In addition, many authors16,21 have suggested BMI is not suicient as an indicator to identify the association between body fat and non-transmitted chronic diseases (NTCDs), such as arterial hypertension. It is also necessary to assess the lo-cation of fat, whose presence in visceral region is indica-tive of NTCD risk.
Model 1 Model 2
Anthropometric Male Female Male Female
Indicators OR 95% CI p OR 95% CI p OR 95% CI p OR 95% CI p
BMI 1.97 1.42-2.74 0.001 2.18 1.69-2.81 0.001 1.97 1.41-2.74 0.001 2.22 1.72-2.86 0.001
BMI* 1.93 1.38-2.70 0.001 2.14 1.65-2.77 0.001 1.91 1.33-2.68 0.001 2.16 1.67-2.81 0.001
WC 1.49 1.12-2.00 0.008 2.34 1.67-3.27 0.001 1.50 1.11-2.02 0.008 2.33 1.66-3.26 0.001
WC* 1.45 1.08-1.96 0.014 2.10 1.49-2.96 0.001 1.46 1.08-1.97 0.014 2.10 1.49-2.96 0.001
WHR 1.61 1.18-2.20 0.002 2.43 1.71-3.47 0.001 1.64 1.20-2.24 0.002 2.37 1.66-3.38 0.001
WHR* 1.55 1.13-2.12 0.006 2.18 1.52-3.12 0.001 1.57 1.14-2.15 0.006 2.13 1.48-3.06 0.001
WHtR 1.30 0.83-2.05 0.256 2.43 1.62-3.14 0.001 1.39 0.87-2.21 0.166 2.39 1.59-3.59 0.001
WHtR* 1.29 0.81-2.04 0.283 2.20 1.46-3.32 0.001 1.39 0.87-2.22 0.169 2.18 1.44-3.29 0.001 OR, odds ratio; *, also adjusted for diabetes.
Anthropometric indicators
Gender
Male Female
OR 95% CI p OR 95% CI p
BMI 1.90 1.36-2.66 0.001 2.18 1.68-2.83 0.001
BMI* 1.85 1.31-2.60 0.001 2.15 1.65-2.81 0.001
WC 1.44 1.06-1.94 0.018 2.15 1.53-3.03 0.001
WC* 1.40 1.03-1.90 0.032 1.98 1.40-2.81 0.001
WHR 1.64 1.20-2.25 0.002 2.31 1.61-3.32 0.001
WHR* 1.57 1.14-2.16 0.006 2.10 1.46-3.04 0.001
WHtR 1.28 0.79-2.06 0.311 2.26 1.50-3.41 0.001
WHtR* 1.28 0.79-2.08 0.311 2.10 1.38-3.18 0.001
However, diferent abdominal fat indicators seem to indicate diferent risks. According to Björntorp21, the WC is the most appropriate indicator identifying visceral fat accumulation, being strongly associated with atheroscle-rotic cardiovascular diseases, while WHR, considering the gluteus measurement, with this area having a lot of ma-jor muscle tissues regulating systemic insulin sensitivity, would be more strongly associated with insulin resistance.
WHtR is an indicator proposed in the mid-90s16, and its inluence on NTCD risk is not quite established, thus, further studies are still required, including the elderly population.
Few studies investigating the relationship between diferent (body and/or abdominal) fat indicators and hy-pertension were found in literature and results were not consistent. In a cross-sectional Polish study (70 years old), excess body fat, identiied as BMI 30 kg/m2, was found to be associated with hypertension, albeit diferently in both genders, predominating in females22. Renón et al.3, in Spain, studied 6262 subjects (60 years old), with BMI (25 kg/m2) and WC (88 cm for females and 102 cm for males) impact on hypertension prevalence being observed as direct and independent. he probable association of BMI (25 kg/m2 and 30 kg/m2) with disease development, according to the odds ratio, was higher in both genders and WC was higher in females.
A cohort 10-year study9 in two Japanese communities with the subjects’ age ranging from 45 to 69 years showed BMI and WC values in the third tertile of distribution were positively associated with hypertension risk in both gen-ders in one of the communities, but only in females in the other community. he association between WHtR and hy-pertension has not been found either in that population or in men in this current study.
By considering several study data, the anthropometric indicators strength of association for hypertension devel-opment is found to be diferent regarding either age groups or geographical regions/countries.
Diabetes is a morbidity oten associated with hyperten-sion, and this study’s results showed that its inclusion in all regression models did not change signiicantly the associa-tion between the dependent variable and independent ex-planatory variables, although it has contributed to reduce the strength of association, as observed by Barbosa et al.10 in their elderly study in Barbados and Cuba.
In the present study, adjustment for education did not change the associations direction, however the inclusion of smoking and beneits of regular physical activity reduced the associations magnitude, except for BMI in female and WHR in both genders, as evidenced by Barbosa et al.10.
While education is considered a socioeconomic fac-tor determining health status, mostly because it has an impact on the subject’s occupation and income, this vari-able seems to exert minor efect on health over old age vital stage.
he relationship between arterial hypertension and smoking is not entirely clear. Recent prospective studies suggest smoking might be a minor risk factor for the devel-opment of hypertension23, although it may have some efect on the subject’s body weight24.
he regular physical activity practice has been proposed as a strategy in preventing and controlling hypertension, as well as in treating hypertensive subjects, thus contributing to reduce or minimize other cardiovascular disease risk fac-tors, such as reduced body fat25.
In a study involving men (9,963) and women (12,154) age 45-79 years, the indicators WHR, BMI and WC were similarly associated with hypertension. When the analy-sis was adjusted for other variables (age, BMI, WHR, WC, smoking status, social status, drinking status and physical activity practice), WHR and BMI association with hyper-tension remained independent for both genders, whereas WC remained signiicantly independent only for women4.
In the current study, the inal model (adjusted addition-ally for diabetes) showed BMI is the indicator with higher statistical power of association with hypertension in the elderly of both genders, though it is quite similar to other indicators in females.
he study cross-sectional design does not allow establish-ing a cause-efect relationship between obesity and hyperten-sion. Another limitation concerns the use of reported infor-mation about the presence of hypertension. Some studies show this kind of information has good concordance, com-pared to medical records or clinical evaluations26-27, being widely used for understanding certain population conditions and evaluate health policies28. Self-rated morbidity could lead to underestimating a chronic condition prevalence, since it allows for identiication of subjects with a previous diagnosis, but may omit those who had never been given a diagnosis that could indicate the presence or absence of hypertension.
CONCLUSION
In conclusion, self-rated hypertension was found to be posi-tively associated with (body and abdominal) fat anthropo-metric indicators used in the current study, with BMI being the indicator with higher statistical power in both genders, although it was found to be similar to the other indicators in women. Except for WHtR, the other indicators were posi-tive and independently associated with self-rated hyperten-sion in men.
REFERENCES
1. Lawes CMM, Hoorn SV, Anthony Rodgers A. Global burden of blood-pressure-related disease, 2001. Lancet 2008; 371:1513-18. 2. Ministério da Saúde, Secretaria de Vigilância em Saúde, Secretaria
de Gestão Estratégica e Participativa. Vigitel Brasil 2006 - Vigilância de fatores de risco e proteção para doenças crônicas por inquérito telefônico. Ministério da Saúde 2007.
3. Redón J, Cea-Calvo L, Moreno B, Monereo S, Gil-Guillen V, Lozano JV, et al. Independent impact of obesity and fat distribution in hy-Independent impact of obesity and fat distribution in hy-pertension prevalence and control in the elderly. J Hypertens 2008; 26:1757-64.
4. Canoy D, Luben R, Welch A, Bingham S, Wareham N, Day N, Khaw T. Fat distribution, body mass index and blood pressure in 22 090 men and women in the Norfolk cohort of the European Prospective Investigation into Cancer and Nutrition (EPIC-Norfolk) study. J Hy-J Hy-pertens 2004; 22:2067-74.
5. Hasselmann MH, Faerstein E, Werneck GL, Chor D, Lopes CS. As- As-sociação entre circunferência abdominal e hipertensão arterial em mulheres: Estudo Pró-Saúde. Cad Saúde Pública 2008; 24:1187-1191. 6. Sarno F, Monteiro CA. Relative importance of body mass index and
waist circumference for hypertension in adults. Rev Saúde Pública 2007; 41:788-96.
7. Okosun IS, Rotimi CN, Forrester TE, Fraser H, Osotimehin B, Muna WF, et al. Predictive value of abdominal obesity cut-of points for hypertension in blacks from west African and Caribbean island na-tions. Int J Obes 2000; 24: 180-186.
8. Feldstein CA, Akopian M, Olivieri AO, Kramer AP, Nasi M, Gar-rido D. A comparison of body mass index and waist-to-hip ratio as indicators of hypertension risk in an urban Argentine population: a hospital-based study. Nutr Metab Cardiovasc Dis 2005; 15:310-5. 9. Sakurai M, Miura K, Takamura T, Ota T, Ishizaki M, Morikawa Y,
et al. Gender dif erences in the association between anthropomet-Gender diferences in the association between anthropomet-ric indices of obesity and blood pressure in Japanese. Hypertens Res 2006; 29:75-80.
10. Barbosa AR, Munaretti DB, Coqueiro RS, Borgato AF. Anthropo- Anthropo-metric indexes of obesity and hypertension in elderly from Cuba e Barbados. J Nutr Health Aging. (in press).
11. Peláez M, Palloni A, Albala JC, Ham-Chande R, Hennis A, Lebrao ML, et al. Survey on aging, health and wellbeing, 2000. Washington (DC): Pan American Health Organization 2003.
12. Silva NN. Amostragem. In: Lebrão ML, Duarte YAO, organizadores. O Projeto SABE no município de São Paulo: uma abordagem inicial. Brasília (DF): Organização Pan-Americana de Saúde 2003; p. 45-57. 13. Barbosa AR, Souza JMP, Lebrão ML, Laurenti R, Marucci MFN. An- An-thropometry of elderly residents in the city of São Paulo, Brazil. Cad Saúde Pública 2005; 21:1929-38.
14. American Academy of Family Physicians, American Dietetic As-sociation, National Council on the Aging. Nutrition screening e in-tervention resources for healthcare professionals working with older adults. Nutrition Screening Initiative. Washington (DC): American Dietetic Association 2002.
15. Lean MEJ, Han TS, Morrison CE. Waist circumference as a measure for indicating need for weight management. BMJ 1995; 311:158-61. 16. Hsieh SD, Yoshinaga H. Waist/height ratio as a simple and useful
predictor of coronary heart disease risk factors in women. Intern Med 1995; 34:1147-52.
17. Chei CL, Iso H, Yamagishi K, Tanigawa T, Cui R, Imano H, et al. Body fat distribution and the risk of hypertension and diabetes among Japanese men and women. Hypertens Res 2008; 31:851-7. 18. Rahmouni K, Correia MLG, Haynes WG, Mark AL. Obesity-asso-
Obesity-asso-ciated hypertension. New insights into mechanisms. Hypertension 2005; 45:9-14.
19. Barreto SM, Passos VM, Cardoso AR, Lima-Costa MF. Quantifying the risk of coronary artery disease in a community: the Bambuí proj-ect. Arq Bras Cardiol 2003; 81:556-61.
20. Barbosa AR, Souza JMP, Lebrão ML, Marucci MFN. Estado nutri-cional e desempenho motor de idosos de São Paulo. Rev Assoc Med Bras 2007; 53:75-9.
21. Björntorp P. Body fat distribution, insulin resistance, and metabolic diseases. Nutrition 1997; 13:795-803.
22. Gryglewska B, Grodzicki T, Kocemba J. Obesity and blood pressure in the elderly free-living population. J Hum Hypertens 1998; 12:645-7.
23. Halperin RO, Gaziano JM, Sesso HD. Smoking and the risk of inci-Smoking and the risk of inci-dent hypertension in middle-aged and older men. Am J Hypertens 2008; 21:148-52.
24. Chatkin R, Chatkin JM. Tabagismo e variação ponderal: a isiopa-tologia e genética podem explicar esta associação? J Bras Pneumol 2007; 33:712-9.
25. Chodzko-Zajko WJ, Proctor DN, Fiatarone Singh MA, Minson CT, Nigg CR, Salem GJ, et al. American College of Sports Medicine po-sition stand. Exercise and physical activity for older adults. Med Sci Sports Exerc 2009; 41:1510-30.
26. Molarius A, Janson S. Self-rated health, chronic diseases, and symp-toms among middle-aged and elderly men and women. J Clin Epi-demiol 2002; 55:364-70.
27. heme Filha MM, Szwarcwald CL, Souza Junior PRB. Medidas de morbidade referida e inter-relações com dimensões de saúde. Rev Saúde Pública 2008; 42:73-81.
28. Almeida MF, Barata RB, Montero CV, Silva ZP. Prevalência de doenças crônicas auto-referidas e utilização de serviços de saúde, PNAD/1998, Brasil. Ciênc Saúde Coletiva 2002; 7:743-56.