ACPD
2, 2343–2371, 2002Heterogeneous vs. homogeneous
freezing
K. Gierens
Title Page
Abstract Introduction
Conclusions References
Tables Figures
◭ ◮
◭ ◮
Back Close
Full Screen / Esc
Print Version
Interactive Discussion
c
EGU 2002 Atmos. Chem. Phys. Discuss., 2, 2343–2371, 2002
www.atmos-chem-phys.org/acpd/2/2343/ c
European Geosciences Union 2002
Atmospheric Chemistry and Physics Discussions
On the transition between heterogeneous
and homogeneous freezing
K. Gierens
Deutsches Zentrum f ¨ur Luft- und Raumfahrt, Institut f ¨ur Physik der Atmosph ¨are, Oberpfaffenhofen, Germany
ACPD
2, 2343–2371, 2002Heterogeneous vs. homogeneous
freezing
K. Gierens
Title Page
Abstract Introduction
Conclusions References
Tables Figures
◭ ◮
◭ ◮
Back Close
Full Screen / Esc
Print Version
Interactive Discussion
c
EGU 2002
Abstract
Box model simulations of an uplifting and adiabatically cooling cloud of aerosol have been performed in order to study the transition between cirrus formation dominated by homogeneous nucleation of ice to that dominated by heterogeneous nucleation. The aerosol was assumed to consist of an internal mixture of sulfuric acid solution droplets
5
with inclusions of soot. The simulations show that the transition from heterogeneous to homogeneous nucleation occurs over a narrow range of soot concentration. Thus it seems to be possible to fix critical concentrations of heterogeneous ice nuclei which must be exceeded if heterogeneous freezing dominates cirrus formation. A formula has been derived that allows to compute the critical concentrations of heterogeneous
10
ice nuclei as a function of temperature, updraft speed, ambient pressure, and super-saturation at which heterogeneous freezing occurs. Generally, homogeneous nucle-ation dominates in regions with updrafts stronger than 20 cm s−1, with the exception of heavily polluted areas which could be common in the northern hemisphere due to air traffic, where updrafts of the order 1 m s−1may be necessary to render heterogeneous
15
nucleation unimportant. According to the present results it cannot be excluded that heterogeneous nucleation plays a more important role for cirrus formation in the north-ern midlatitudes than anywhere else. A possible consequence of these results is that air pollution may lead to a higher coverage of cirrus clouds, but then these clouds will be optically thinner than clouds formed by homogeneous freezing, with the exception
20
of regions where condensation trails are frequent.
1. Introduction
Cirrus clouds in the cold upper troposphere (T . −40◦C) are generally thought to form mainly by homogeneous freezing of aqueous solution droplets (e.g.Sassen and Dodd,1988;Heymsfield and Sabin,1989;Heymsfield and Miloshevich,1993). When
25
thermo-ACPD
2, 2343–2371, 2002Heterogeneous vs. homogeneous
freezing
K. Gierens
Title Page
Abstract Introduction
Conclusions References
Tables Figures
◭ ◮
◭ ◮
Back Close
Full Screen / Esc
Print Version
Interactive Discussion
c
EGU 2002 dynamically controlled process, that is, it takes place when a critical supersaturation
(dependent on temperature) is reached in an airmass. It has been shown in the lab-oratory by Koop et al. (2000) that the critical supersaturation is independent of the chemical nature of the aerosol. Gierens et al.(2000), comparing and correlating data of ice–supersaturation from MOZAIC, Measurement of Ozone from Airbus–in–Service
5
Aircraft (Marenco et al.,1998), of subvisible cirrus from SAGE II, Stratospheric Aerosol and Gas Experiment II (Wang et al.,1996), and of thermodynamic conditions for cirrus formation from re–analysis data of the European Centre for Medium Range Weather Forecast (Sausen et al., 1998), could show that cirrus formation seems to be ther-modynamically controlled in the tropics and in the southern midlatitudes upper
tropo-10
sphere, but not in the same way in the northern midlatitudes, where the thermodynamic control is much weaker. This result can suggest that the composition of the freezing aerosol has a more important effect in the polluted northern hemisphere compared to the cleaner regions of the world. Since homogeneous nucleation seems not to depend on the aerosol composition one may conclude that then heterogeneous
pro-15
cesses must play a bigger role for cirrus formation in the northern midlatitudes. Such heterogeneous effects could be brought aboutinter aliaby aircraft soot emissions. In-deed,Str ¨om and Ohlsson(1998) found that cirrus ice crystals in a region of heavy air traffic (southern Germany) often contain some kind of “absorbing material” (probably soot), and moreover such inclusions were most frequent in those altitudes where the
20
air routes are concentrated (8–12 km).
The notion “heterogeneous nucleation” is a collective term for various physical mech-anisms that may occur in the atmosphere (seeVali,1985, for a definition of the termi-nology). Deposition nucleation requires the presence of dry solid particles, whose existence in the upper troposphere has not been shown so far (DeMott et al.,1997).
25
con-ACPD
2, 2343–2371, 2002Heterogeneous vs. homogeneous
freezing
K. Gierens
Title Page
Abstract Introduction
Conclusions References
Tables Figures
◭ ◮
◭ ◮
Back Close
Full Screen / Esc
Print Version
Interactive Discussion
c
EGU 2002 densation and immersion freezing require an internal mixture of aerosol, that is, solid
particles immersed in a liquid coating.
Although pure graphitic soot is hydrophobous, soot particles from other sources, in particular from combustion, may act as heterogeneous ice nuclei, probably because of various contaminations on their surface. This has first been shown byDeMott(1990)
5
in the laboratory for temperatures between−25◦C and−40◦C. More recent laboratory experiments ofDeMott et al.(1999) explored a lower temperature regime that is more representative for the upper troposphere. It could be shown that below −53◦C soot particles with a substantial amount of sulfuric acid solution on their surface (several monolayers) induce ice formation at supersaturations below the critical
supersatura-10
tions necessary for homogeneous nucleation. Such an aerosol may be generated by aviation since jet engines emit about 1015 soot particles and about 1015 to 4×10¹⁷ volatile aerosol particles larger than about 5 nm in diameter per kg kerosene burnt, in particular sulfuric acid solution droplets (Fahey and Schumann, 1999; Schumann, 2002, and references therein). It is thus conceivable that aircraft emissions can lead to
15
soot particles that are immersed in a coating of sulfuric acid solution. However, it must be said that an understanding of the very physical process that induces the freezing at or around the soot particles is still lacking. For instance, soot from various sources (combustion soot, Degussa soot, sparc generator soot, etc.) behave differently in freez-ing experiments, yet the exact reasons for these differences are unknown. One must
20
also admit that it is not possible or justified at the current state of knowledge to define a critical supersaturation at which heterogeneous freezing of soot would commence.
Thus, heterogeneous nucleation is still a closed book in many respects, but it may have important effects on cirrus clouds.Jensen and Toon(1997) performed numerical simulations of cirrus formation in slow updrafts and showed that the presence of soot
25
ACPD
2, 2343–2371, 2002Heterogeneous vs. homogeneous
freezing
K. Gierens
Title Page
Abstract Introduction
Conclusions References
Tables Figures
◭ ◮
◭ ◮
Back Close
Full Screen / Esc
Print Version
Interactive Discussion
c
EGU 2002 “absorbing material” in the crystals, seeStr ¨om and Ohlsson,1998).
Although experimental evidence is lacking that aviation and other anthropogenic aerosol indeed affects cirrus formation and cirrus cloud cover, the weak thermody-namic control of cirrus formation in the northern midlatitudes gives reason to study such potential effects both experimentally and by modelling. Since heterogeneous and
5
homogeneous freezing can act simultaneously in the atmosphere it is useful to derive criteria which tell one which of the two freezing modes is dominant in a given situation. This will of course depend on the concentration of heterogeneous ice nuclei, that is on the number of aerosol particles that heterogeneously induce ice crystal formation at a supersaturation below the critical supersaturation for homogeneous nucleation. I will
10
show that it is possible to determine a critical concentration of such ice nuclei, below of which homogeneous nucleation dominates, while heterogeneous nucleation takes over the dominant role at higher ice nucleus concentrations. The study has been perfomed by means of simple box model simulations where sulfuric acid solution droplets with in-clusions of soot served as heterogeneous ice nuclei. Additionally, I will derive a simple
15
analytical formula for the calculation of the critical concentration of heterogeneous ice nuclei as a function of supersaturation necessary for heterogeneous freezing, temper-ature, updraft speed, and pressure. This formula can be used in large scale models for the control of a switch between the two nucleation modes.
2. The box model
20
A simple box model with bulk microphysics was employed for this study which simulates the evolution of an aerosol cloud in uplifting and cooling air. Prognostic variables are aerosol and ice crystal number densities, ice mass and vapour mass concentration, and temperature. The updraft yields an adiabatic cooling of 9.77×10⁻⁵ K s−1 per 1 cm s−1 of updraft velocity. The aerosol is an internal mixture of aqueous solution
25
ACPD
2, 2343–2371, 2002Heterogeneous vs. homogeneous
freezing
K. Gierens
Title Page
Abstract Introduction
Conclusions References
Tables Figures
◭ ◮
◭ ◮
Back Close
Full Screen / Esc
Print Version
Interactive Discussion
c
EGU 2002 geometrical mode radius of 10 nm and geometrical standard deviationσaof 1.48. The
fraction of aerosol droplets bearing an inclusion,SNF(i.e. soot number fraction), the soot mass fraction (relative to the mass of the sulfuric acid in the droplet) of a soot including aerosol particle,SMF, and the number concentration of aerosol particles,Na, are free parameters. The soot mass fraction can be translated into a soot surface,
5
assuming a specific soot surface (i.e. surface per unit mass) ofΩm=7.5×10 5
cm2g−1 (K ¨archer et al.,1996). Assuming a direct proportionality between mass (i.e. volume) and surface of aircraft (kerosene) soot is an expression for the fractal nature of this kind of soot.
With the given parameters, SNF,SMF, and Na, and assuming the log–normal size
10
distribution of the “dry” aerosol, the soot concentration (i.e. mass of soot per unit volume of air) is given by
Csoot=Na·SNF·SMF·(4π/3)ρaM3, (1) whereρais the density of pure sulfuric acid, and
M3=ra3exp[(9/2)(lnσa)2] (2)
15
is the third moment of the aerosol size distribution. Alternatively, the soot concentration can be translated into the total soot surface densityΩV (soot surface per unit volume of air), i.e.
ΩV = ΩmCsoot. (3)
The density of sulfuric acid depends slightly on temperature, it varies from ρa = 20
2.09 g cm−3at−35◦C to 2.22 g cm−3at−70◦C. All other quantities in the formulae for
Csoot andΩV are independent of temperature.
As stated above, it is unknown how the ice formation process on the surfaces of soot particles works. Therefore, I make the same working hypothesis asDeMott et al. (1997), who extrapolated the laboratory results for temperatures higher than−40◦C to
25
ACPD
2, 2343–2371, 2002Heterogeneous vs. homogeneous
freezing
K. Gierens
Title Page
Abstract Introduction
Conclusions References
Tables Figures
◭ ◮
◭ ◮
Back Close
Full Screen / Esc
Print Version
Interactive Discussion
c
EGU 2002 whether the soot in the atmosphere actually behaves as this working hypothesis
as-sumes, I think that such a procedure is justified as long as the study aims athowthe transition between homogeneous and heterogeneous looks like. It is not the aim of these simulations to determine the exact critical soot concentration where the transi-tion takes place. Such a determinatransi-tion must await better knowledge of the physical
5
processes that occur on the soot surface.
The parameterisation of DeMott et al. (1997) uses a number of active sites for for-mation of an ice embryo per unit surface of soot. This is a very strong function of the effective freezing temperature, namely:
surface number density of active sites=A(−Teff)B, (4)
10
withA=1.04×10⁻⁴cm−2andB=7.767.
While cooling, the aerosol may freeze heterogeneously due to their soot inclusions or homogeneously. Aerosol droplets without inclusions can only freeze by homogeneous nucleation while those with inclusions can freeze via both mechanisms (which means that the sulfuric acid solution in such a droplet can ignore the presence of the
inclu-15
sion). For the droplets with inclusions the model chooses the freezing pathway with the higher nucleation rate in each timestep. Homogeneous freezing is parameterised in the box model following Koop et al. (2000). The integration over the size distribu-tion is performed via a numerical Gauß–Hermite integradistribu-tion as described byGierens and Str ¨om (1998). This gives for each timestep the fraction of aerosol particles that
20
freeze. The freshly formed ice crystals begin to grow by vapour deposition, thereby reducing the supersaturation. The depositional crystal growth is parameterised as in Koenig(1971), i.e.,d m/d t =amb, with crystal mass m, and temperature dependent parametersa, b, which are listed for temperatures below−40◦C byGierens(1996).
All simulations run from an initial temperatureT =−53◦C or lower. This temperature
25
ACPD
2, 2343–2371, 2002Heterogeneous vs. homogeneous
freezing
K. Gierens
Title Page
Abstract Introduction
Conclusions References
Tables Figures
◭ ◮
◭ ◮
Back Close
Full Screen / Esc
Print Version
Interactive Discussion
c
EGU 2002 The initial relative humidity was 70% with respect to liquid water (RH), or 116% with
respect to ice (RHi) atT =−53◦C and 50% (RHi =96%) atT =−73◦C.
3. Results and discussion
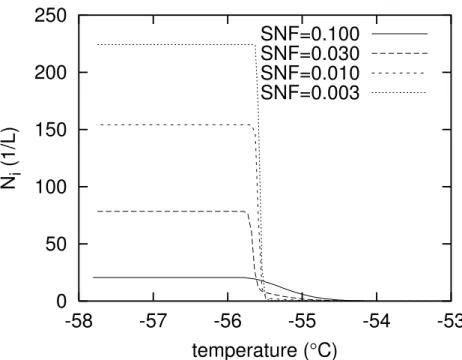
Figure1 shows a typical outcome of a boxmodel simulation with the internally mixed aerosol. The temperature–axis can be read as a reversed time–axis, with time
pro-5
gressing to the left. Displayed is the number concentration of ice crystals that form in the cooling aerosol cloud. The curves of Fig.1are computed for an updraft velocity of 10 cm s−1, a number concentration of aerosol particles of 3×10⁸m−3, and a soot mass fraction SMF = 0.1. The soot number fraction (SNF) is used as a curve parameter. The curve withSNF = 0.1 shows the form typical for heterogeneous nucleation only.
10
Nucleation starts at about−54.5◦C and proceeds on down to about−55.5◦C where the growth of the ice crystals has consumed enough water vapour to quench the nucle-ation. Simulations with higherSNFgenerally yield a similar behaviour (not shown), al-though they result in higher final ice crystal concentrations. The curve withSNF=0.03 already shows strong signs of homogeneous nucleation at T < −55.5◦C where the
15
crystal number density suddenly jumps up by a factor of approximately seven. Het-erogeneous nucleation produces some ice crystals between −54.5◦C and −55.5◦C, but their number is too low for consuming the supersaturation; hence homogeneous nucleation takes over crystal production at−55.5◦C. The next curve withSNF =0.01 (ΩV = 4.1 ×10−
9
cm2L−1) is similar to the previous one but shows the
character-20
istics of homogeneous nucleation even more. The fourth curve with SNF = 0.003 (ΩV =1.2×10−
9
cm2L−1) shows homogeneous nucleation almost exclusively on this plot with linearNi–axis, in particular the sudden and steep increase onNi with decreas-ing temperature. Further decrease ofSNFyields nearly congruent curves as the one for the latterSNF–value shown here. It is noteworthy that the transition between the
25
ACPD
2, 2343–2371, 2002Heterogeneous vs. homogeneous
freezing
K. Gierens
Title Page
Abstract Introduction
Conclusions References
Tables Figures
◭ ◮
◭ ◮
Back Close
Full Screen / Esc
Print Version
Interactive Discussion
c
EGU 2002 the present case. This implies also that the transition between freezing dominated by
heterogeneous nucleation and freezing dominated by homogeneous nucleation spans an order of magnitude of the total soot concentration. For the parameterisation of DeMott et al.(1997) that we use here, the critical concentration for the simulations of Fig.1is about 0.01 ng m−3(please recall that this number makes only sense within the
5
framework of our working hypothesis, namely that the results ofDeMott(1990) can be extrapolated to lower temperatures).
Additional series of simulations were performed with the same initial conditions as so far, but with changed values of SMF(increased to 0.5) and Na (decreased by an order of magnitude to 3×10⁷m−3). These simulations resulted in qualitatively similar
10
curvesNi vs. T (i.e. vs. time), and the transition between heterogeneous and homo-geneous nucleation occurred at the same characteristic soot concentration as before (not shown). Variation of the geometric mean radius from 10 nm to 100 nm, and a vari-ation of the geometric standard devivari-ation from 1.2 to 2.0 yields similar results, i.e. the transition between the two freezing modes takes place over an order of magnitude in
15
soot concentration that can be fixed at a certain critical value, and the latter does not depend noticably on the size distribution of the aerosol.
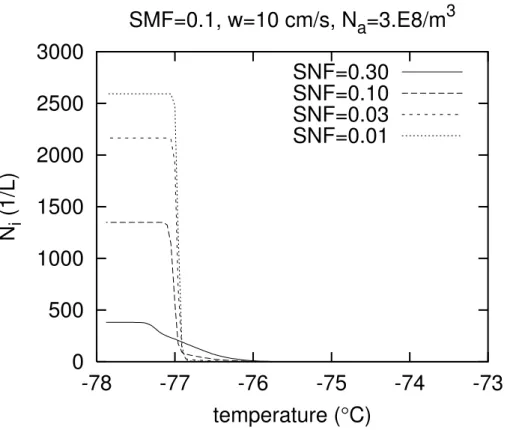
The simulations up to now were all performed with the same initial temperature, such that the number density of active sites for nucleation in the parametrisation of DeMott et al.(1997) was the same for the same soot concentration. The potential role
20
of the number of active sites for the transition between the two nucleation modes could therefore not become effective. Figure2 shows a set of simulations performed with initial temperature of −73◦C and initial relative humidity of 50%. Soot mass fractions and aerosol number density are the same as in Fig.1, but the soot number fractions are higher by about a factor of three. First one may note, that at this low temperature
25
ACPD
2, 2343–2371, 2002Heterogeneous vs. homogeneous
freezing
K. Gierens
Title Page
Abstract Introduction
Conclusions References
Tables Figures
◭ ◮
◭ ◮
Back Close
Full Screen / Esc
Print Version
Interactive Discussion
c
EGU 2002 observed earlier in simulations by Jensen and Toon (1994). Second, one observes
that already the curve forSNF = 0.3 bears signs of homogeneous nucleation, such that in this case the critical soot concentration is one order of magnitude larger (i.e. ≈ 0.1 ng m−3) than in the simulations shown above. It turns out, however, that it is not the temperature dependence ofTeff, hence of the number of active sites, that is responsible
5
for the increase of the critical soot concentration. For the boxmodel runs of Fig.2 the effective temperature varies approximately between −13 and −52◦C. I have fixed for a certain choice of parameters (SNF=1, others as in Fig.2) the effective temperature to values ranging from−10◦C to−60◦C, yet the number if ice crystals that formed was hardly affected by this manipulation. (I have found like insensitivity ofNi to a reasonable
10
range ofTeff at the higher temperatures of Fig.1). This suggests that the number of active sites on the soot surface is not a critical factor for the heterogeneous nucleation in the temperature regime considered here. Anticipating the results of the following section, one can attribute the increase of the critical soot concentration with decreasing temperature to (a) the decrease of the diffusion coeffient for water molecules in air, (b)
15
the decrease of the saturation vapour pressure with decreasing temperature.
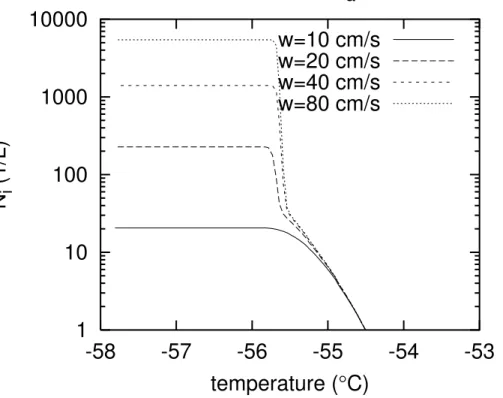
Finally, the updraft velocity is an important parameter that has to be considered. Previous simulations that took both nucleation modes into account (e.g.DeMott et al., 1997; Spice et al., 1999; Sassen and Benson, 2000) agree concluding that hetero-geneous nucleation becomes relatively unimportant for updrafts exceeding a few
20
10 cm s−1. This expectation is essentially confirmed by the results of the present model. Simulations were performed withSMF=0.1,SNF=0.1,Na =3×10⁸m−3, and with initial temperature of−53◦C. The run with 10 cm s−1updraft was shown in Fig.1 as a case that is dominated by heterogeneous nucleation. Additional runs with updrafts of 20, 40, and 80 cm s−1show increasing signs of homogeneous nucleation, as
demon-25
ACPD
2, 2343–2371, 2002Heterogeneous vs. homogeneous
freezing
K. Gierens
Title Page
Abstract Introduction
Conclusions References
Tables Figures
◭ ◮
◭ ◮
Back Close
Full Screen / Esc
Print Version
Interactive Discussion
c
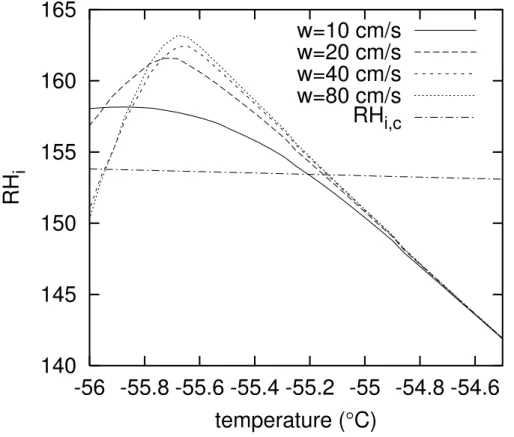
EGU 2002 (Koop et al., 2000; K ¨archer and Lohmann,2002) is plotted versus temperature. The
figure shows that in the only case that is dominated by heterogeneous nucleation, the supersaturation does not reach as high values than in the other cases. AlthoughRHi ,c
is surpassed, the homogeneous nucleation rate forw =10 cm s−1remains low. The su-persaturation in the other cases reaches higher values in spite of the fact that the
num-5
ber of crystals formed by heterogeneous nucleation at the moment whenRHi =RHi ,c increases with updraft speed. Obviously the consumption of water vapour by growing ice crystals cannot halt the increase of supersaturation by cooling of the air in an up-draft ofw &20 cm s−1, at least for the case considered here. The same result applies when other combinations ofSNFandSMFare tried, such that the soot concentration
10
remains the same. A corresponding set of simulations with initial temperature of−73◦C and withSNF= 0.3 (not shown) also leads to the same result, namely that homoge-neous nucleation is dominant forw & 20 cm s−1. However, homogeneous nucleation can be suppressed even in strong updrafts when very high soot contamination of the aerosol is assumed. For example, a test simulation withSNF=1 at −53◦C initial
tem-15
perature (other parameters unchanged) showed no homogeneous nucleation up to at leastw=40 cm s−1, and in another one where additionallySMFwas increased to 0.5, heterogeneous nucleation dominated still atw = 80 cm s−1, and it was necessary to increasew to 1.5 m s−1in order to get a substantial contribution by homogeneous nu-cleation to ice formation. Such heavily polluted cases can principally occur nowadays
20
in the upper troposphere of the northern midlatitudes as a result of aviation emissions (Rahmes et al.,1998).
4. Analytical approach
The latter observation of the previous section, namely that the time evolution of relative humidity (or supersaturation) is the crucial point to determine whether homogeneous
25
super-ACPD
2, 2343–2371, 2002Heterogeneous vs. homogeneous
freezing
K. Gierens
Title Page
Abstract Introduction
Conclusions References
Tables Figures
◭ ◮
◭ ◮
Back Close
Full Screen / Esc
Print Version
Interactive Discussion
c
EGU 2002 saturation below the critical one for homogeneous freezing), allows to derive a simple
estimate of the critical concentration of heterogeneous ice nuclei, which would suffice to suppress homogeneous nucleation. This can be done by considering the temporal evolution of the supersaturation after a number of ice crystals have formed hetero-geneously at a supersaturations0. Of course, s0 is assumed to be smaller than the
5
critical supersaturation for homogeneous freezing. For the sake of simplicity I assume that there is only one kind of heterogeneous ice nuclei present, all of which freeze at
s0.
Let us assume that the heterogeneous ice nuclei freeze at initial supersaturation
s0. Then the supersaturation changes with time due to crystal growth (deposition)
10
and due to further cooling by updraft (and possibly other diabatic processes changing temperature, hence changing the saturation vapour pressuree∗). Thus we have
d s d t =
d d t
e
−e∗ e∗
= 1
e∗ d e
d t −(1+s) dlne∗
d t =− c(t)
e∗ −(1+s) L RvT2
d T
d t, (5)
whereLis latent heat of sublimation,Rvis the gas constant of water vapour. c(t) is the time dependent deposition rate, for which the following ansatz is possible:
15
c(t)=(e−e∗)/τeg(t), (6) with a time dependent growth time scaleτeg(t). The growth of ice crystals begins very slowly, when the ice crystals are initially still very small. Only later the nominal growth time scale
τg =[(4π/3)ND rmax]−1, (7)
20
with diffusion coefficientD, number concentration of ice crystalsN, and final ice crystal radiusrmax (K ¨archer and Lohmann,2002) will be reached. Thus I parameteriseτeg(t) as
e
ACPD
2, 2343–2371, 2002Heterogeneous vs. homogeneous
freezing
K. Gierens
Title Page
Abstract Introduction
Conclusions References
Tables Figures
◭ ◮
◭ ◮
Back Close
Full Screen / Esc
Print Version
Interactive Discussion
c
EGU 2002 where b is a small number of the order 1, that depends on temperature. For the
following calculations I simply setb =1. With this parameterisation the condensation rate is very small initially when the ice crystals begin to grow, thereafterc(t) increases and reaches a maximum value, and it decreases again when the ice crystals approach their final size (i.e. when the supersaturation is consumed). The cooling by updraft can
5
be formulated as
d T/d t= Γw with Γ =−g/cp, (9)
with gravitational accelerationgand specific heat of dry aircp. Introducing an updraft timescale
τu =(RvcpT2)/(Lgw) (10)
10
allows to write the differential Eq. (5) in the following form:
d s d t =
1+s τu −
s
e
τg(t)
. (11)
Introducing the abbreviationa(t) =τu−1−τeg(t)−1, the formal solution of the differential equation is
s(t)=eRa(t′)d t′
Z
τu−1e−Ra(t′′)d t′′d t′+s0e R
a(t′)d t′, (12)
15
where the integrals under the exponentials are
Z
a(t′)d t′= t
τu − t τg +
1−e−bt/τg
b . (13)
Fort=0 we haves(0)=s0and fort→ ∞,s(t) approaches asymptotically the limiting values∞=τg/(τu−τg), providedτg/τu <1. Of course, the solution explodes to infinity, that is, homogeneous nucleation will occur for sure ifτg/τu≥1.
ACPD
2, 2343–2371, 2002Heterogeneous vs. homogeneous
freezing
K. Gierens
Title Page
Abstract Introduction
Conclusions References
Tables Figures
◭ ◮
◭ ◮
Back Close
Full Screen / Esc
Print Version
Interactive Discussion
c
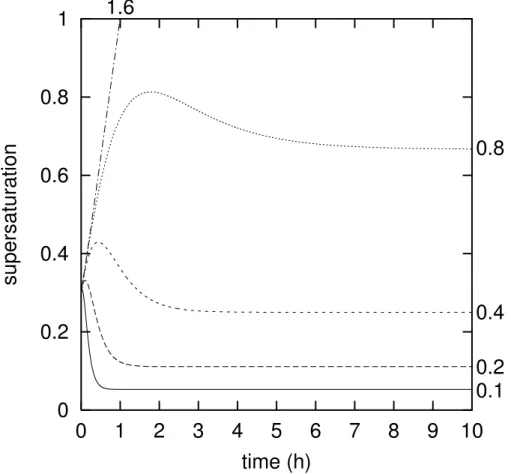
EGU 2002 Figure5 shows some typical curves s(t) for an updraft time scale of 2 h (typical for
10 cm/s uplift), an initial supersaturations0=0.3 and various values of the growth time scaleτg. The most important feature to look at is the initial hump in the curves with a moderately small growth time scale. In such situations homogeneous nucleation be-comes dominant when the maximum smax is higher than the critical supersaturation
5
for homogeneous nucleation. Therefore, in order to determine this maximum for vari-ous combinations of{τu, τg, s0}, I have performed further numerical integrations of the differential Eq. (11).
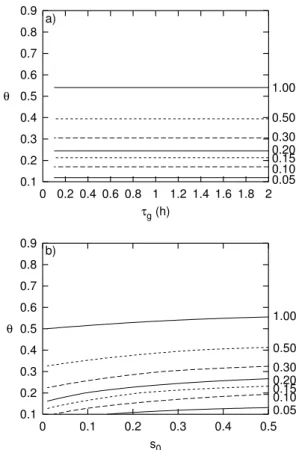
First, one can note that it is useful to introduce the ratioθof the two timescales, i.e.
θ = τg/τu. Obviously it suffices to study the range θ ∈ [0,1). Figure6a shows that
10
the maximum supersaturationsmax does depend on the growth time scale only via the
ratioθ, and thatsmax will normally be high enough to allow homogeneous nucleation
already for the quite moderate valueθ = 0.4. The calculations have been performed forτu = 2 h ands0 =0.3. Figure6b shows that the difference between the maximum and initial supersaturation depends slightly on the initial value. For parameterisation
15
purposes for large scale models I would neglect this dependence. Figure7shows by means of a log–log plot thatsmax−s0is a power function ofθ; indeed,smax−s0=f θ
2
is a very good approximation for the curves. The prefactor f depends on both s0 and b in Eq. (8), hence on temperature. For the following, it should be considered a tunable parameter, and I found the best match between boxmodel calculations and the
20
analytical approximation by setting
f(T)=104−0.02T. (14)
The exponent ofθdoes not depend ons0and neither onb.
Thus, one can set up the following criterion: If the supersaturation can increase to the threshold value for homogeneous nucleation,shom, the latter will dominate in cirrus
25
formation, that is, much more ice crystals will be produced by homogeneous than by heterogeneous nucleation. Whethersmax will reach such a high value depends on the
ACPD
2, 2343–2371, 2002Heterogeneous vs. homogeneous
freezing
K. Gierens
Title Page
Abstract Introduction
Conclusions References
Tables Figures
◭ ◮
◭ ◮
Back Close
Full Screen / Esc
Print Version
Interactive Discussion
c
EGU 2002
shom depends linearly on T), and on the ratio of the relevant time scales,τg/τu. For checking the criterion one computessmax≈f(T) (τg/τu)
2
+s0.
Finally, I derive a formula for the limiting case wheresmax=shom(T). First, I define the threshold supersaturation for homogeneous nucleation as that value where one ice crystal per cubic metre will be formed in an uplifting airmass. From the boxmodel
5
calculations I find
shom(T)=2.193−7.47×10⁻³T, (15)
whereT is in K. Next we need an expression for the growth time scale (see above). The coefficient of diffusion of vapour in air,D, can be parameterised as:
D=2.11×10⁻⁵
T T0
1.94p 0
p
, (16)
10
withD in m2/s (Pruppacher and Klett,1978). Here,T0 = 273.15 K, p0 = 101325 Pa, andpis air pressure.
Assuming that allN growing ice crystals have equal size and are spherical, they can reach a maximum radius of
rmax=
3s
0e
∗
(T) 4πNRvT ρi
1/3
, (17)
15
with the bulk density of ice ρi = 900 kg/m 3
. If constant numbers are collected, the growth time scale can then be written in the following form:
τg−1=1.40×10⁻⁶T1.61p−1[s0e∗(T)]1/3N2/3. (18)
(All quantities in SI units). In a similar way it is possible to write an expression for the updraft time scale:
20
ACPD
2, 2343–2371, 2002Heterogeneous vs. homogeneous
freezing
K. Gierens
Title Page
Abstract Introduction
Conclusions References
Tables Figures
◭ ◮
◭ ◮
Back Close
Full Screen / Esc
Print Version
Interactive Discussion
c
EGU 2002 Now, the condition that homogeneous nucleation does not get effective is
f(T) (τg/τu)2+s0<2.193−7.47×10−3T. (20)
Inserting the expressions for the time scales, and solving for the ice crystal number density,N, yields a critical number density Nc, when an equal sign is set in Eq. (20). This is:
5
Nc=
2.81×10¹¹f(T)3/4w3/2p3/2 T5.415[s
0e∗(T)]1/2(shom(T)−s0)3/4
. (21)
(Again, everything in SI units, i.e. m−3, m/s, K, and Pa). The critical number density
Nc marks the transition region between homogeneous and heterogeneous cirrus for-mation. It should be understood as a rough estimate. This means that ice production will be dominated by heterogeneous processes if the concentration of heterogeneous
10
ice nuclei exceedsNc; in turn, it will be dominated by homogeneous nucleation ifN is smaller than the critical valueNcby about half an order of magnitude or even smaller.
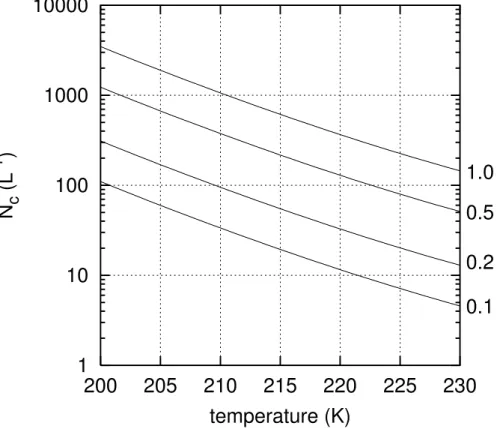
As Eq. (21) shows, the sensitivity of the critical concentration of heterogeneous ice nuclei,Nc, to changes of temperature and updraft speed are much more important than those to changes of eithers0orp(althoughphas also the power 3/2; but the relative
15
variation ofpin the upper troposphere is generally small compared to variations ofw). The dependences ofNc on temperature and updraft speed is illustrated in Fig.8.
5. Summary and conclusions
In this study I have investigated the transition between cirrus formation due to het-erogeneous freezing on the one hand and homogeneous freezing on the other. The
20
ACPD
2, 2343–2371, 2002Heterogeneous vs. homogeneous
freezing
K. Gierens
Title Page
Abstract Introduction
Conclusions References
Tables Figures
◭ ◮
◭ ◮
Back Close
Full Screen / Esc
Print Version
Interactive Discussion
c
EGU 2002 mixed aerosol consisting of aqueous solution droplets of sulfuric acid where a fraction
of these droplets bears an inclusion of soot. It was assumed as a working hypothe-sis that such an aerosol freezes according to the parameterisation given by DeMott et al. (1997). The aerosol cloud was situated in an uplifting and thereby adiabatically cooling airmass where it eventually formed ice crystals. The initial temperature of all
5
simulations was−53◦C or lower.
The boxmodel simulations have shown that the transition between homogeneously dominated and heterogeneously dominated cirrus formation occurs over a range of heterogeneous ice nucleus concentration of about one order of magnitude. This tran-sition can in principle be characterised by a critical concentration of heterogeneous ice
10
nuclei which depends in particular on temperature and updraft speed. From the box model simulations it was possible to determine critical soot concentrations of the order 0.01–0.1 ng m−3. The resulting values from the simulations should, however, not taken as exact quantities, since the precise mechanism by which ice germs are formed on soot surfaces is currently unknown.
15
The boxmodel simulations suggested to consider the temporal evolution of ice super-saturation after an assumed heterogeneous freezing event at an initial supersuper-saturation,
s0, to be crucial for the question whether homogeneous nucleation can later take over cirrus formation or not. An analytical estimate has been derived that provides the crit-ical concentration of ice nuclei as a function of temperature, updraft speed, ambient
20
pressure, and s0. This formula can be used for simple decision measures in cirrus parametrisations of large scale models, of which nucleation mode should be switched on and which should be switched off.
In stronger updrafts it needs generally higher concentrations of heterogeneous ice nuclei to suppress homogeneous nucleation. I expect, in agreement with results of
25
ACPD
2, 2343–2371, 2002Heterogeneous vs. homogeneous
freezing
K. Gierens
Title Page
Abstract Introduction
Conclusions References
Tables Figures
◭ ◮
◭ ◮
Back Close
Full Screen / Esc
Print Version
Interactive Discussion
c
EGU 2002 emission of 0.02 g per kg kerosene burnt (Schumann,2002), assuming a fuel flow of
0.8 kg s−1 and a flight speed of 250 m s−1 can yield a soot concentration in the first second after emission of about 10 ng m−3, which is much higher than the critical values listed above. Thus, cases with Csoot ≈ 1 ng m−3 in internal mixture are not impos-sible in the atmosphere, and can probably be produced in the northern hemispheric
5
tropopause region by aviation (Rahmes et al., 1998). In such heavily polluted cases homogeneous nucleation would be suppressed until updrafts of about 1 m s−1 or so are reached. Rahmes et al. (1998) have computed that the 1992 aviation produced a soot concentration above 10−2ng m−3 in a considerable atmospheric volume in the northern hemisphere. Thus it cannot be excluded that heterogeneous nucleation is
10
much more important for cirrus formation in the northern hemisphere than anywhere else. In fact, recent lidar measurements of cirrus clouds in both northern and southern midlatitudes suggest that just this is the case (Immler and Schrems,2002).
If the concentration of heterogeneous ice nuclei is just above its critical value, the corresponding heterogeneously formed cirrus cloud will be much optically thinner
(per-15
haps even subvisible) than a cirrus formed homogeneously, because much less ice crystals are produced via heterogeneous nucleation just above the threshold than via the homogeneous process. The clouds get, however, optically thicker again with in-creasing concentration of heterogeneous ice nuclei although they generally will be less optically thick than those formed homogeneously. Thus, over polluted regions there
20
may be a higher coverage of cirrus clouds (because of the lower formation threshold), but the clouds will probably be thinner. An exception of this rule is the formation of condensation trails because there the concentration of heterogeneous ice nuclei is by many orders of magnitude higher than in the background atmosphere. Cirrus optical depths in regions with a heavy load of air traffic therefore may be on the average larger
25
than in other polluted regions of the northern hemisphere.
ACPD
2, 2343–2371, 2002Heterogeneous vs. homogeneous
freezing
K. Gierens
Title Page
Abstract Introduction
Conclusions References
Tables Figures
◭ ◮
◭ ◮
Back Close
Full Screen / Esc
Print Version
Interactive Discussion
c
EGU 2002
References
DeMott, P. J.,: An exploratory study of ice nucleation by soot aerosols, J. Appl. Meteorol., 29, 1072–1079, 1990. 2346,2351
DeMott, P. J., Rogers, D. C., and Kreidenweis, S. M.: The susceptibility of ice formation in upper tropospheric clouds to insoluble aerosol components, J. Geophys. Res., 102, 19575–19584,
5
1997. 2345,2348,2349,2351,2352,2359
DeMott, P. J., Chen, Y., Kreidenweis, S. M., Rogers, D. C., and Sherman, D. E.: Ice formation by black carbon particles, Geophys. Res. Lett., 26, 2429–2432, 1999. 2346,2349
Fahey, D. W. and Schumann, U.: Aviation–produced aerosols and cloudiness. In: Aviation and the global atmosphere, J. E. Penner, D. H. Lister, D. J. Griggs, D. J. Dokken, and M. McFarland
10
(Eds.), IPCC Special report, Cambridge University Press, 65–120, 1999. 2346
Gierens, K. M.: Numerical simulations of persistent contrails, J. Atmos. Sci., 53, 3333–3348, 1996. 2349
Gierens, K. M. and Str ¨om, J.: A numerical study of aircraft induced ice cloud formation, J. Atmos. Sci., 55, 3253–3263, 1998. 2349
15
Gierens, K., Schumann, U., Helten, M., Smit, H., and Wang, P.-H., Ice-supersaturated regions and sub visible cirrus in the northern midlatitude upper troposphere, J. Geophys. Res., 105, 22743-22754, 2000. 2345
Heymsfield, A. J. and Sabin, R. M.: Cirrus crystal nucleation by homogeneous freezing of solu-tion droplets, J. Atmos. Sci., 46, 2252–2264, 1989. 2344
20
Heymsfield, A. J. and Miloshevich, L. M.: Homogeneous ice nucleation and supercooled liquid water in orographic wave clouds, J. Atmos. Sci., 50, 2335–2353, 1993. 2344
Immler, F. and Schrems, O.: LIDAR measurements of cirrus clouds in the northern and south-ern midlatitudes during INCA (55◦N, 53◦S): A comparative study, Geophys. Res. Lett., 29, 10.1029/2002GL015077, 2002. 2360
25
Jensen, E. J. and Toon, O. B.: Ice nucleation in the upper troposphere: Sensitivity to aerosol composition and size distribution, temperature, and cooling rate, Geophys. Res. Lett., 21, 2019–2022, 1994. 2352
Jensen, E. J. and Toon, O. B.: The potential impact of soot particles from aircraft on cirrus clouds, Geophys. Res. Lett., 24, 249–252, 1997. 2346
30
ACPD
2, 2343–2371, 2002Heterogeneous vs. homogeneous
freezing
K. Gierens
Title Page
Abstract Introduction
Conclusions References
Tables Figures
◭ ◮
◭ ◮
Back Close
Full Screen / Esc
Print Version
Interactive Discussion
c
EGU 2002
2353,2354
K ¨archer, B., Peter, T., Biermann, U. M., and Schumann, U.: The initial composition of jet con-densation trails, J. Atmos. Sci., 53, 3066–3083, 1996. 2348
Koenig, L. R.: Numerical modelling of ice deposition, J. Atmos. Sci., 28, 226–237, 1971. 2349
Koop, T., Luo, B. Tsias, A., and Peter, T.: Water activity as the determinant for homogeneous
5
ice nucleation in aqueous solutions, Nature, 406, 611–614, 2000. 2345,2349,2353
Kristensson, A., Gayet, J.-F., Str ¨om, J., and Auriol, F.: In situ observations of a reduction in effective crystal diameter in cirrus clouds near flight corridors, Geophys. Res. Lett., 27, 681– 684, 2000. 2346
Marenco, A., Thouret, V., Nedelec, P., Smit, H., Helten, M., Kley, D., Karcher, F., Simon, P., Law,
10
K., Pyle, J., Poschmann, G., von Wrede, R., Hume, C., and Cook, T.: Measurement of ozone and water vapor by Airbus in–service aircraft: The MOZAIC airborne program, an overview, J. Geophys. Res., 103, 25631–25642, 1998. 2345
Pruppacher, H. R. and Klett, J. D.: Microphysics of clouds and precipitation. D. Reidel publishing company, Dordrecht (NL), xv and 714 pp., 1978. 2357
15
Rahmes, T. F., Omar, A. H., and Wuebbles, D. J.: Atmospheric distributions of soot particles by current and future aircraft fleets and resulting radiative forcing on climate,J. Geophys. Res., 103, 31657–31667, 1998. 2353,2360
Sassen, K. and Dodd, G. C.: Homogeneous nucleation rate for highly supercooled cirrus cloud droplets, J. Atmos. Sci., 45, 1357–1369, 1988. 2344
20
Sassen, K. and Benson, S.: Ice nucleation in cirrus clouds: A model study of the homogeneous and heterogeneous modes, Geophys. Res. Lett., 27, 521–524, 2000. 2352
Sausen, R., Gierens, K. Ponater, M., and Schumann, U.: A diagnostic study of the global distribution of contrails, Part I: Present day climate, Theor. Appl. Climatol., 61, 127–141, 1998. 2345
25
Schumann, U.: Contrail cirrus, In: Cirrus, Lynch, D., K. Sassen, D. O’C. Starr, G. Stephens (Eds.), Oxford University Press, Oxford, United Kingdom, 231–255, 2002. 2346,2360
Spice, A., Johnson, D. W., Brown, P. R. A.,Darlison, A. G., and Saunders, C. P. R.: Primary ice nucleation in orographic cirrus clouds: A numerical simulation of the microphysics, Q. J. R. Meteorol. Soc., 125, 1637–1667, 1999. 2352
30
Str ¨om, J., and Ohlsson, S.: In situ measurements of enhanced crystal number densities in cirrus clouds caused by aircraft exhaust, J. Geophys. Res., 103, 11355–11361, 1998. 2345,
ACPD
2, 2343–2371, 2002Heterogeneous vs. homogeneous
freezing
K. Gierens
Title Page
Abstract Introduction
Conclusions References
Tables Figures
◭ ◮
◭ ◮
Back Close
Full Screen / Esc
Print Version
Interactive Discussion
c
EGU 2002 Vali, G.: Nucleation terminology, Bull. Amer. Meterol. Soc., 66, 1426–1427, 1985. 2345
Wang, P.-H., Minnis, P., McCormick, M. P., Kent, G. S., and Skeens, K. M.: A 6–year climatology of cloud occurrence frequency from Stratospheric Aerosol and Gas Experiment II observa-tions (1985–1990), J. Geophys. Res., 101, 29407–29429, 1996. 2345
Young, K. C.: Microphysical processes in clouds. Oxford University Press, Oxford, xv and 427
5
ACPD
2, 2343–2371, 2002Heterogeneous vs. homogeneous
freezing
K. Gierens
Title Page
Abstract Introduction
Conclusions References
Tables Figures
◭ ◮
◭ ◮
Back Close
Full Screen / Esc
Print Version
Interactive Discussion
c
EGU 2002
0
50
100
150
200
250
-58
-57
-56
-55
-54
-53
N
i(1/L)
temperature (
°
C)
SMF=0.1, w=10 cm/s, N
a=3.E8/m
3SNF=0.100
SNF=0.030
SNF=0.010
SNF=0.003
ACPD
2, 2343–2371, 2002Heterogeneous vs. homogeneous
freezing
K. Gierens
Title Page
Abstract Introduction
Conclusions References
Tables Figures
◭ ◮
◭ ◮
Back Close
Full Screen / Esc
Print Version
Interactive Discussion
c
EGU 2002
0
500
1000
1500
2000
2500
3000
-78
-77
-76
-75
-74
-73
N
i(1/L)
temperature (
°
C)
SMF=0.1, w=10 cm/s, N
a=3.E8/m
3SNF=0.30
SNF=0.10
SNF=0.03
SNF=0.01
Fig. 2. As Fig.1, but computed with initial temperature of −73◦C and initial relative humidity
ACPD
2, 2343–2371, 2002Heterogeneous vs. homogeneous
freezing
K. Gierens
Title Page
Abstract Introduction
Conclusions References
Tables Figures
◭ ◮
◭ ◮
Back Close
Full Screen / Esc
Print Version
Interactive Discussion
c
EGU 2002
1
10
100
1000
10000
-58
-57
-56
-55
-54
-53
N
i(1/L)
temperature (
°
C)
SMF=0.1, SNF=0.1, N
a=3.E8/m
3w=10 cm/s
w=20 cm/s
w=40 cm/s
w=80 cm/s
ACPD
2, 2343–2371, 2002Heterogeneous vs. homogeneous
freezing
K. Gierens
Title Page
Abstract Introduction
Conclusions References
Tables Figures
◭ ◮
◭ ◮
Back Close
Full Screen / Esc
Print Version
Interactive Discussion
c
EGU 2002
140
145
150
155
160
165
-56 -55.8 -55.6 -55.4 -55.2 -55 -54.8 -54.6
RH
i
temperature (
°
C)
w=10 cm/s
w=20 cm/s
w=40 cm/s
w=80 cm/s
RH
i,cACPD
2, 2343–2371, 2002Heterogeneous vs. homogeneous
freezing
K. Gierens
Title Page
Abstract Introduction
Conclusions References
Tables Figures
◭ ◮
◭ ◮
Back Close
Full Screen / Esc
Print Version
Interactive Discussion
c
EGU 2002
0
0.2
0.4
0.6
0.8
1
0
1
2
3
4
5
6
7
8
9
10
supersaturation
time (h)
0.1
0.2
0.4
0.8
1.6
ACPD
2, 2343–2371, 2002Heterogeneous vs. homogeneous
freezing
K. Gierens
Title Page
Abstract Introduction
Conclusions References
Tables Figures
◭ ◮
◭ ◮
Back Close
Full Screen / Esc
Print Version
Interactive Discussion
c
EGU 2002
0.1 0.2 0.3 0.4 0.5 0.6 0.7 0.8 0.9
θ
0.05 0.10 0.15 0.20 0.30 0.50 1.00
0 0.2 0.4 0.6 0.8 1 1.2 1.4 1.6 1.8 2
τg (h)
0.1 0.2 0.3 0.4 0.5 0.6 0.7 0.8 0.9
θ
0.05 0.10 0.15 0.20 0.30 0.50 1.00
0 0.1 0.2 0.3 0.4 0.5
s0 a)
b)
Fig. 6. Panel a): smax−s0(given as curve parameter) as a function of growth time scaleτg
(in hours) and the ratioθ=τg/τu. It is evident thatsmax−s0does depend onτgonly through
θ. Panel b): smax−s0 (given as curve parameter) as a function of initial supersaturations0
ACPD
2, 2343–2371, 2002Heterogeneous vs. homogeneous
freezing
K. Gierens
Title Page
Abstract Introduction
Conclusions References
Tables Figures
◭ ◮
◭ ◮
Back Close
Full Screen / Esc
Print Version
Interactive Discussion
c
EGU 2002
0.0001
0.001
0.01
0.1
1
0.01
0.1
s
max- s
0
θ
s
0=0.1
s
0=0.3
s
0=0.5
ACPD
2, 2343–2371, 2002Heterogeneous vs. homogeneous
freezing
K. Gierens
Title Page
Abstract Introduction
Conclusions References
Tables Figures
◭ ◮
◭ ◮
Back Close
Full Screen / Esc
Print Version
Interactive Discussion
c
EGU 2002
1
10
100
1000
10000
200
205
210
215
220
225
230
N
c(L
-1