www.atmos-chem-phys.org/acp/3/437/
Chemistry
and Physics
On the transition between heterogeneous and homogeneous freezing
K. Gierens
Deutsches Zentrum f¨ur Luft- und Raumfahrt, Institut f¨ur Physik der Atmosph¨are, Oberpfaffenhofen, Germany Received: 14 October 2002 – Published in Atmos. Chem. Phys. Discuss.: 16 December 2002
Revised: 10 March 2003 – Accepted: 24 March 2003 – Published: 15 April 2003
Abstract. Box model simulations of an uplifting and adi-abatically cooling cloud of aerosol have been performed in order to study the transition between cirrus formation domi-nated by homogeneous nucleation of ice to that domidomi-nated by heterogeneous nucleation. The aerosol was assumed to con-sist of an internal mixture of sulfuric acid solution droplets with inclusions of soot. The parametrisation of DeMott et al. (1997) was used to simulate the heterogeneous nucleation of ice in such droplets with soot inclusions. The simulations show that the transition from heterogeneous to homogeneous nucleation occurs over a narrow range of soot concentration. Thus it seems to be possible to fix critical concentrations of heterogeneous ice nuclei which must be exceeded if hetero-geneous freezing dominates cirrus formation. A formula has been derived that allows to compute the critical concentra-tions of heterogeneous ice nuclei as a function of temper-ature, updraft speed, ambient pressure, and supersaturation at which heterogeneous freezing occurs. Generally, homoge-neous nucleation dominates in regions with updrafts stronger than 20 cm s−1, with the exception of heavily polluted areas which could be common in the northern hemisphere due to air traffic, where updrafts of the order 1 m s−1may be nec-essary to render heterogeneous nucleation unimportant. Ac-cording to the present results it cannot be excluded that het-erogeneous nucleation plays a more important role for cirrus formation in the northern midlatitudes than anywhere else. A possible consequence of these results is that air pollution may lead to a higher coverage of cirrus clouds, but then these clouds will be optically thinner than clouds formed by homo-geneous freezing, with the exception of regions where con-densation trails are frequent.
Correspondence to:K. Gierens ([email protected])
1 Introduction
(large scale) thermodynamic conditions are similar in both regions. However, the hemispheric differences of thermo-dynamic control of cirrus formation can also suggest that the composition of the freezing aerosol has a more impor-tant effect in the polluted northern hemisphere compared to the cleaner regions of the world. Since homogeneous nucle-ation seems not to depend on the aerosol composition one may conclude that then heterogeneous processes must play a bigger role for cirrus formation in the northern midlatitudes. Such heterogeneous effects could be brought aboutinter alia by aircraft soot emissions. Indeed, Str¨om and Ohlsson (1998) found that cirrus ice crystals in a region of heavy air traf-fic (southern Germany) often contain some kind of “absorb-ing material” (probably soot), and moreover such inclusions were most frequent in those altitudes where the air routes are concentrated (8–12 km).
The notion “heterogeneous nucleation” is a collective term for various physical mechanisms that may occur in the atmo-sphere (see Vali, 1985, for a definition of the terminology). Deposition nucleation requires the presence of dry solid par-ticles, whose existence in the upper troposphere has not been shown so far (DeMott et al., 1997). Contact freezing, requir-ing the presence of an external mixture of solid and liquid particles, is probably unimportant for cirrus clouds because it seems to be suppressed in updrafts and the collection rates are very small for typical aerosol particle sizes in the upper troposphere (Young, 1993, chapter 4.5.3). The two remain-ing mechanisms, condensation and immersion freezremain-ing re-quire an internal mixture of aerosol, that is, solid particles immersed in a liquid coating.
Although pure graphitic soot is hydrophobic, soot parti-cles from other sources, in particular from combustion, may act as heterogeneous ice nuclei, probably because of various contaminations on their surface. This has first been shown by DeMott (1990) in the laboratory for temperatures between
−25◦C and−40◦C. More recent laboratory experiments of DeMott et al. (1999) explored a lower temperature regime that is more representative for the upper troposphere. It could be shown that below −53◦C soot particles with a substan-tial amount of sulfuric acid solution on their surface (several monolayers) induce ice formation at supersaturations below the critical supersaturations necessary for homogeneous nu-cleation. Such an aerosol may be generated by aviation since jet engines emit about 1015 soot particles and about 1015 to 4×10¹⁷ volatile aerosol particles larger than about 5 nm in diameter per kg kerosene burnt, in particular sulfuric acid solution droplets (Fahey and Schumann, 1999; Schumann, 2002, and references therein). It is thus conceivable that air-craft emissions can lead to soot particles that are immersed in a coating of sulfuric acid solution. However, it must be said that an understanding of the very physical process that induces the freezing at or around the soot particles is still lacking. For instance, soot from various sources (combus-tion soot, Degussa soot, sparc generator soot, etc.) behave differently in freezing experiments, yet the exact reasons for
these differences are unknown. One must also admit that it is not possible or justified at the current state of knowledge to define a critical supersaturation at which heterogeneous freezing of soot would commence.
Thus, heterogeneous nucleation is still a closed book in many respects, but it may have important effects on cirrus clouds. Jensen and Toon (1997) performed numerical simu-lations of cirrus formation in slow updrafts and showed that the presence of soot can not only enlarge the fractional cover of cirrus clouds, but it can also alter the properties of the cirrus rather dramatically compared to a case when only sul-fate aerosol was assumed to be present. Kristensson et al. (2000) measured reductions of effective crystal diameters by 10–30% in cirrus perturbed by aviation (as indicated by the “absorbing material” in the crystals, see Str¨om and Ohlsson, 1998).
Although experimental evidence is lacking that aviation and other anthropogenic aerosol indeed affects cirrus forma-tion and cirrus cloud cover, the weak thermodynamic control of cirrus formation in the northern midlatitudes gives reason to study such potential effects both experimentally and by modelling. Since heterogeneous and homogeneous freezing can act simultaneously in the atmosphere it is useful to de-rive criteria which tell one which of the two freezing modes is dominant in a given situation. This will of course depend on the concentration of heterogeneous ice nuclei, that is on the number of aerosol particles that heterogeneously induce ice crystal formation at a supersaturation below the critical su-persaturation for homogeneous nucleation. I will show that it is possible to determine a critical concentration of such ice nuclei, below of which homogeneous nucleation dominates, while heterogeneous nucleation takes over the dominant role at higher ice nucleus concentrations. The study has been per-fomed by means of simple box model simulations where sul-furic acid solution droplets with inclusions of soot served as heterogeneous ice nuclei. Additionally, I will derive a simple analytical formula for the calculation of the critical concen-tration of heterogeneous ice nuclei as a function of supersat-uration necessary for heterogeneous freezing, temperature, updraft speed, and pressure. This formula can be used in large scale models for the control of a switch between the two nucleation modes.
2 The box model
for the “dry” aerosol (that is, the pure sulfuric acid) with a geometrical mode radius of 10 nm and geometrical standard deviationσaof 1.48. The fraction of aerosol droplets bear-ing an inclusion,SNF(i.e. soot number fraction), the soot mass fraction (relative to the mass of the sulfuric acid in the droplet) of a soot including aerosol particle, SMF, and the number concentration of aerosol particles,Na, are free pa-rameters. The soot mass fraction can be translated into a soot surface, assuming a specific soot surface (i.e. surface per unit mass) ofm =7.5×105cm2g−1(K¨archer et al., 1996). 1 Assuming a direct proportionality between mass (i.e. vol-ume) and surface of aircraft (kerosene) soot is an expression for the fractal nature of this kind of soot.
With the given parameters, SNF,SMF, and Na, and as-suming the log–normal size distribution of the “dry” aerosol, the soot concentration (i.e. mass of soot per unit volume of air) is given by
Csoot=Na·SNF·SMF·(4π/3)ρaM3, (1)
whereρais the density of pure sulfuric acid, and
M3=ra3exp[(9/2)(lnσa)2] (2)
is the third moment of the aerosol size distribution. Alterna-tively, the soot concentration can be translated into the total soot surface densityV (soot surface per unit volume of air), i.e.
V =mCsoot. (3)
The density of sulfuric acid depends slightly on temperature, it varies fromρa=2.09 g cm−3at−35◦C to 2.22 g cm−3at
−70◦C. All other quantities in the formulae forCsoot and V are independent of temperature.
As stated above, it is unknown how the ice formation process on the surfaces of soot particles works. There-fore, I make the same working hypothesis as DeMott et al. (1997), who extrapolated the laboratory results for tempera-tures higher than−40◦C to lower temperatures and replaced the temperature of pure water droplets by an effective freez-ing temperatureTeff of aqueous solution droplets. Although
I do not know whether the soot in the atmosphere actually be-haves as this working hypothesis assumes, I think that such a procedure is justified as long as the study aims at howthe transition between homogeneous and heterogeneous paths looks like. It is not the aim of these simulations to deter-mine the exact critical soot concentration where the transition takes place. Such a determination must await better knowl-edge of the physical processes that occur on the soot surface. The parameterisation of DeMott et al. (1997) uses a num-ber of active sites for formation of an ice embryo per unit surface of soot. This is a very strong function of the effective freezing temperature, namely:
surface number density of active sites=A(−Teff)B, (4)
1More recent values of
mare higher, up to 4×106cm2g−1.
withA=1.04×10⁻⁴cm−2andB =7.767.
While cooling, the aerosol may freeze heterogeneously due to their soot inclusions or homogeneously. Aerosol droplets without inclusions can only freeze by homogeneous nucleation while those with inclusions can freeze via both mechanisms (which means that the sulfuric acid solution in such a droplet can ignore the presence of the inclusion). For the droplets with inclusions the model chooses the freezing pathway with the higher nucleation rate in each timestep. Homogeneous freezing is parameterised in the box model following Koop et al. (2000). The integration over the size distribution is performed via a numerical Gauß–Hermite in-tegration as described by Gierens and Str¨om (1998). This gives for each timestep the fraction of aerosol particles that freeze. The freshly formed ice crystals begin to grow by vapour deposition, thereby reducing the supersaturation. The depositional crystal growth is parameterised as in Koenig (1971), i.e. dm/dt = amb, with crystal massm, and tem-perature dependent parametersa, b, which are listed for tem-peratures below−40◦C by Gierens (1996).
All simulations run from an initial temperature T = −53◦C or lower. This temperature was a threshold in labora-tory experiments of DeMott et al. (1999), below which soot particles enclosed in thick coatings of sulfuric acid solution got effective as heterogeneous ice nuclei at supersaturation below that necessary for homogeneous nucleation. The ini-tial relative humidity was 70% with respect to liquid water (RH), or 116% with respect to ice (RHi) atT = −53◦C and 50% (RHi =96%) atT = −73◦C.
3 Results and discussion
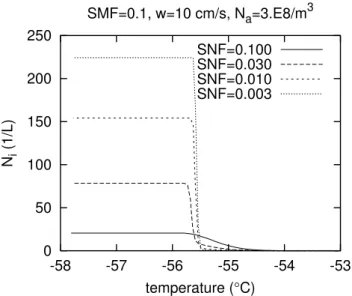
Figure 1 shows a typical outcome of a boxmodel simulation with the internally mixed aerosol. The temperature–axis can be read as a reversed time–axis, with time progressing to the left. Displayed is the number concentration of ice crystals that form in the cooling aerosol cloud. The curves of Fig. 1 are computed for an updraft velocity of 10 cm s−1, a num-ber concentration of aerosol particles of 3×10⁸m−3, and a soot mass fraction SMF = 0.1. The soot number frac-tion (SNF) is used as a curve parameter. The curve with SNF = 0.1 shows the form typical for heterogeneous nu-cleation only. Nunu-cleation starts at about−54.5◦C and pro-ceeds on down to about−55.5◦C where the growth of the ice crystals has consumed enough water vapour to quench the nucleation. Simulations with higherSNFgenerally yield a similar behaviour (not shown), although they result in higher final ice crystal concentrations. The curve withSNF=0.03 already shows strong signs of homogeneous nucleation at
T < −55.5◦C where the crystal number density suddenly jumps up by a factor of approximately seven. Heterogeneous nucleation produces some ice crystals between−54.5◦C and
0 50 100 150 200 250
-58 -57 -56 -55 -54 -53
Ni
(1/L)
temperature (°C)
SMF=0.1, w=10 cm/s, Na=3.E8/m3
SNF=0.100 SNF=0.030 SNF=0.010 SNF=0.003
Fig. 1. Number density of ice crystals forming from internally
mixed aerosol of sulfuric acid solution with soot inclusions in a uplifting and adiabatically cooling airmass as function of tempera-ture (which may be considered a reverse time axis) as simulated in a box–model. Ice crystals form by heterogeneous and homogeneous nucleation. The simulations were performed with 10 cm/s uplift, with soot mass fractionSMF=0.1 (of those aerosol droplets that bear an inclusion), total aerosol number densityNa=3×10⁸m−3,
and with fraction of aerosol particles bearing an inclusion,SNF, as indicated on the figure. Homogeneous nucleation is signalled by the steep increase ofNiwith decreasing temperature.
crystal production at−55.5◦C. The next curve withSNF=
0.01 (V = 4.1 ×10⁻⁹cm2L−1) is similar to the previ-ous one but shows the characteristics of homogeneprevi-ous nu-cleation even more. The fourth curve withSNF = 0.003 (V =1.2×10⁻⁹cm2L−1) shows homogeneous nucleation almost exclusively on this plot with linearNi–axis, in par-ticular the sudden and steep increase onNi with decreasing temperature. Further decrease ofSNFyields nearly congru-ent curves as the one for the latterSNF–value shown here. It is noteworthy that the transition between the first sign of homogeneous nucleation and full homogeneous nucleation occurs within about one order of magnitude ofSNF–values, viz. between about 0.03 and 0.003 for the present case. This implies also that the transition between freezing dominated by heterogeneous nucleation and freezing dominated by ho-mogeneous nucleation spans an order of magnitude of the total soot concentration. For the parameterisation of DeMott et al. (1997) that we use here, the critical concentration for the simulations of Fig. 1 is about 0.01 ng m−3(please recall
that this number makes only sense within the framework of our working hypothesis, namely that the results of DeMott (1990) can be extrapolated to lower temperatures).
Additional series of simulations were performed with the same initial conditions as so far, but with changed values of SMF (increased to 0.5) and Na (decreased by an order of
0 500 1000 1500 2000 2500 3000
-78 -77 -76 -75 -74 -73
Ni
(1/L)
temperature (°C)
SMF=0.1, w=10 cm/s, Na=3.E8/m3
SNF=0.30 SNF=0.10 SNF=0.03 SNF=0.01
Fig. 2. As Fig. 1, but computed with initial temperature of−73◦C
and initial relative humidityRH=50%.
magnitude to 3×10⁷m−3). These simulations resulted in qualitatively similar curvesNi vs. T (i.e. vs. time), and the transition between heterogeneous and homogeneous nucle-ation occurred at the same characteristic soot concentrnucle-ation as before (not shown). Variation of the geometric mean ra-dius from 10 nm to 100 nm, and a variation of the geometric standard deviation from 1.2 to 2.0 yields similar results, i.e. the transition between the two freezing modes takes place over an order of magnitude in soot concentration that can be fixed at a certain critical value, and the latter does not depend noticably on the size distribution of the aerosol.
1 10 100 1000 10000
-58 -57 -56 -55 -54 -53
Ni
(1/L)
temperature (°C)
SMF=0.1, SNF=0.1, Na=3.E8/m3
w=10 cm/s w=20 cm/s w=40 cm/s w=80 cm/s
Fig. 3. As Fig. 1, but with fixed soot number fraction of 0.1, and
updraft velocitywas curve parameter, and with logarithmic y–axis. The solid curve forw = 10 cm s−1is identical to the solid curve in Fig. 1. This is the only case that shows no indications of homo-geneous nucleation. All other cases with higher updraft velocities show effects of homogeneous nucleation that become stronger with increasing updraft speed.
≈ 0.1 ng m−3) than in the simulations shown above. This happens although the surface number density of active sites for heterogeneous nucleation increases itself by a factor of ten between the two sets of experiments. In order to com-pute this factor it is sufficient to consider the lowest effective temperature achieved during an experiment since this marks the time when the nucleation rate peaks. In the former ex-periments that started atT = −53◦C the minimum effective temperature was−39◦C while it is−52.5◦C in the latter ex-periments where cooling started fromT = −73◦C. The ratio of the number density of active sites for heterogeneous nucle-ation is therefore(52.5/39)B =10.06 (see Eq. 4). Thus we find that atT = −73◦C it needs about 100 times more active nucleation sites to suppress homogeneous nucleation than at the higher temperature ofT = −53◦C. Anticipating the re-sults of the following section, one can attribute the increase of the critical soot concentration with decreasing tempera-ture to (a) the decrease of the diffusion coeffient for water molecules in air, (b) the decrease of the saturation vapour pressure with decreasing temperature.
Finally, the updraft velocity is an important parameter that has to be considered. Previous simulations that took both nu-cleation modes into account (e.g. DeMott et al., 1997; Spice et al., 1999; Sassen and Benson, 2000) agree concluding that heterogeneous nucleation becomes relatively unimportant for updrafts exceeding a few 10 cm s−1. This expectation is es-sentially confirmed by the results of the present model. Sim-ulations were performed with SMF = 0.1, SNF = 0.1,
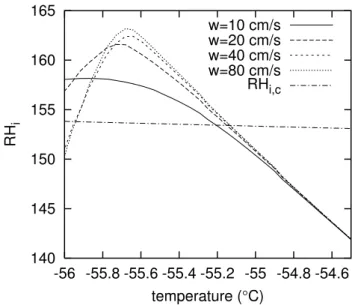
140 145 150 155 160 165
-56 -55.8 -55.6 -55.4 -55.2 -55 -54.8 -54.6
RH
i
temperature (°C) w=10 cm/s w=20 cm/s w=40 cm/s w=80 cm/s RHi,c
Fig. 4.Relative humidity with respect to ice,RHi versus
tempera-ture (i.e. vs. time) for the box model simulations of Fig. 3, with up-draft speed as curve parameter. The dash–dotted nearly horizontal line labelled “RHi,c” is the critical relative humidity for
homoge-neous nucleation. It is seen that the supersaturation becomes higher for increasing updraft velocities. Although the critical relative hu-midity for homogeneous nucleation is surpassed in all cases, this process in unimportant in the case withw= 10 cm s−1. However in all other cases it dominates.
Na =3×10⁸m−3, and with initial temperature of−53◦C. The run with 10 cm s−1updraft was shown in Fig. 1 as a case
that is dominated by heterogeneous nucleation. Additional runs with updrafts of 20, 40, and 80 cm s−1show increasing signs of homogeneous nucleation, as demonstrated in Fig. 3. Since the soot concentration is the same in all these sim-ulations, this parameter cannot decide here whether or not homogeneous nucleation is suppressed. The crucial quan-tity is the temporal evolution of ice–supersaturation. This is shown in Fig. 4, where also the critical relative humid-ity for homogeneous nucleation, RHi,c, (Koop et al., 2000; K¨archer and Lohmann, 2002) is plotted versus temperature. The figure shows that in the only case that is dominated by heterogeneous nucleation, the supersaturation does not reach as high values than in the other cases. AlthoughRHi,cis sur-passed, the homogeneous nucleation rate forw=10 cm s−1
remains low. The supersaturation in the other cases reaches higher values in spite of the fact that the number of crys-tals formed by heterogeneous nucleation at the moment when
ini-0 0.2 0.4 0.6 0.8 1
0 1 2 3 4 5 6 7 8 9 10
supersaturation
time (h)
0.1 0.2 0.4 0.8 1.6
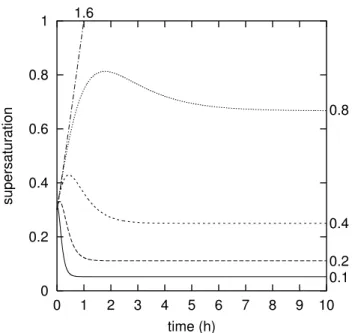
Fig. 5. Typical time histories of supersaturation in a cirrus cloud
formed heterogeneously at initial supersaturation of 0.3, and sit-uated in an airmass uplifting at about 10 cm/s, such that the up-draft time scaleτuis 2 h. Curves are shown for various growth time
scales, given as curve parameters (in hours).
tial temperature of−73◦C and withSNF=0.3 (not shown) also leads to the same result, namely that homogeneous nu-cleation is dominant forw&20 cm s−1. However, homoge-neous nucleation can be suppressed even in strong updrafts when very high soot contamination of the aerosol is assumed. For example, a test simulation withSNF=1 at−53◦C initial temperature (other parameters unchanged) showed no homo-geneous nucleation up to at least w = 40 cm s−1, and in another one where additionallySMF was increased to 0.5, heterogeneous nucleation dominated still atw =80 cm s−1,
and it was necessary to increasewto 1.5 m s−1in order to get
a substantial contribution by homogeneous nucleation to ice formation. Such heavily polluted cases can principally occur nowadays in the upper troposphere of the northern midlati-tudes as a result of aviation emissions (Rahmes et al., 1998).
4 Analytical approach
The latter observation of the previous section, namely that the time evolution of relative humidity (or supersaturation) is the crucial point to determine whether homogeneous nucle-ation will dominate cirrus formnucle-ation in an uplifting airmass that contains a number of heterogeneous ice nuclei (nuclei that undergo heterogeneous freezing at a supersaturation be-low the critical one for homogeneous freezing), albe-lows to de-rive a simple estimate of the critical concentration of hetero-geneous ice nuclei, which would suffice to suppress homoge-neous nucleation. This can be done by considering the
tem-poral evolution of the supersaturation after a number of ice crystals have formed heterogeneously at a supersaturations0.
Of course,s0is assumed to be smaller than the critical
super-saturation for homogeneous freezing. For the sake of sim-plicity I assume that there is only one kind of heterogeneous ice nuclei present, all of which freeze ats0.
Let us assume that the heterogeneous ice nuclei freeze at initial supersaturations0. Then the supersaturation changes with time due to crystal growth (deposition) and due to fur-ther cooling by updraft (and possibly ofur-ther diabatic processes changing temperature, hence changing the saturation vapour pressuree∗). Thus we have
ds dt =
d dt
e−e∗
e∗
= 1 e∗
de
dt −(1+s) dlne∗
dt = −
c(t )
e∗ −(1+s)
L RvT2
dT dt,(5)
whereLis latent heat of sublimation,Rvis the gas constant of water vapour. In the latter expression I have neglected the expansion effect on an uplifting air parcel, the time scale of which (|H /w|with scale heightH≈6500 m) is of the order 104to 106s. This is much longer than both the growth and updraft time scales discussed below. c(t )is the time depen-dent deposition rate, for which the following ansatz is possi-ble:
c(t )=(e−e∗)/τeg(t ), (6)
with a time dependent growth time scaleτeg(t ). The growth of ice crystals begins very slowly, when the ice crystals are initially still very small. Only later the nominal growth time scale (K¨archer and Lohmann, 2002)
τg = [(4π/3) N D r0]−1, (7)
is reached, with diffusion coefficientDand number concen-tration of ice crystalsN. r0is the radius of ice crystals that
they assume after transfer of the initial supersaturations0into
the solid phase. Thus I parameteriseτeg(t )as e
τg(t )=τg/[1−exp(−bt /τg)], (8)
where b is a small number of the order 1, that depends on temperature. For the following calculations I simply setb =
1. With this parameterisation the condensation rate is very small initially when the ice crystals begin to grow, thereafter
c(t )increases and reaches a maximum value, and it decreases again when the supersaturation is consumed. The cooling by updraft can be formulated as
dT /dt=Ŵw with Ŵ= −g/cp, (9)
with gravitational accelerationgand specific heat of dry air
cp. Introducing an updraft timescale
0.1 0.2 0.3 0.4 0.5 0.6 0.7 0.8 0.9
θ
0.05 0.10 0.15 0.20 0.30 0.50 1.00
0 0.2 0.4 0.6 0.8 1 1.2 1.4 1.6 1.8 2 τg (h)
0.1 0.2 0.3 0.4 0.5 0.6 0.7 0.8 0.9
θ
0.05 0.10 0.15 0.20 0.30 0.50 1.00
0 0.1 0.2 0.3 0.4 0.5
s0 a)
b)
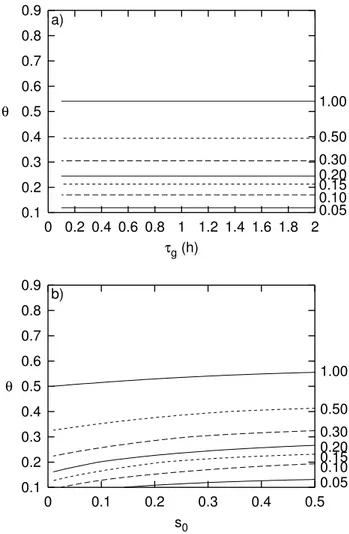
Fig. 6.Panel a):smax−s0(given as curve parameter) as a function
of growth time scaleτg (in hours) and the ratioθ = τg/τu. It is
evident thatsmax−s0does depend onτg only throughθ. Panel
b): smax−s0 (given as curve parameter) as a function of initial
supersaturations0andθ.
allows to write the differential Eq. (5) in the following form:
ds dt =
1+s τu
− s e τg(t )
. (11)
Introducing the abbreviationa(t )=τu−1−τeg(t )−1, the for-mal solution of the differential equation is
s(t )=e
Rt
0a(t′)dt′
Z t
0 τu−1e−
Rt′
0 a(t′′)dt′′dt′+s0e Rt
0a(t′)dt′,(12)
where the integrals under the exponentials are
Z t
0
a(t′)dt′= t τu
− t τg
+1−e
−bt /τg
b . (13)
Fort =0 we haves(0)=s0and fort → ∞,s(t )approaches
asymptotically the limiting values∞ = τg/(τu−τg), pro-vided τg/τu < 1. Of course, the solution explodes to in-finity, that is, homogeneous nucleation will occur for sure if
τg/τu≥1.
0.0001 0.001 0.01 0.1 1
0.01 0.1 smax
- s
0
θ
s0=0.1 s0=0.3 s0=0.5
Fig. 7.smax−s0vs.θ=τg/τufor various values of initial
super-saturations0. The three curves can be fitted very well with quadratic
power functions (i.e. parabolas).
Figure 5 shows some typical curves s(t ) for an updraft time scale of 2 h (typical for 10 cm/s uplift), an initial su-persaturations0=0.3 and various values of the growth time
scaleτg. The most important feature to look at is the ini-tial hump in the curves with a moderately small growth time scale. In such situations homogeneous nucleation becomes dominant when the maximumsmax is higher than the
criti-cal supersaturation for homogeneous nucleation. Therefore, in order to determine this maximum for various combinations of {τu, τg, s0}, I have performed further numerical
integra-tions of the differential Eq. (11).
First, one can note that it is useful to introduce the ratio
θ of the two timescales, i.e. θ = τg/τu. Obviously it suf-fices to study the rangeθ ∈ [0,1). Figure 6a shows that the maximum supersaturationsmax does depend on the growth
time scale only via the ratioθ, and thatsmax will normally
be high enough to allow homogeneous nucleation already for the quite moderate valueθ=0.4. The calculations have been performed forτu =2 h ands0 =0.3. Figure 6b shows that the difference between the maximum and initial supersatu-ration depends slightly on the initial value. For parameter-isation purposes for large scale models I would neglect this dependence. Figure 7 shows by means of a log–log plot that
smax−s0is a power function ofθ; indeed,smax−s0=f θ2
is a very good approximation for the curves. The prefactor
f depends on boths0andbin Eq. (8), hence on temperature.
For the following, it should be considered a tunable param-eter, and I found the best match between boxmodel calcula-tions and the analytical approximation by setting
1 10 100 1000 10000
200 205 210 215 220 225 230
Nc
(L
-1 )
temperature (K) s0=0.3, p=250 hPa, w=var
0.1 0.2 0.5 1.0
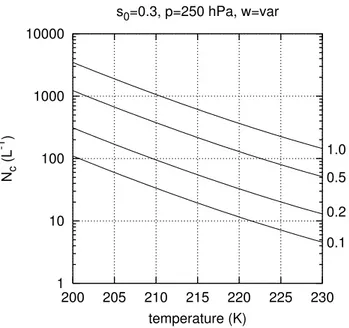
Fig. 8.Critical concentration of heterogeneous ice nuclei as a
func-tion of temperature for various updraft speeds (in m/s, given as curve parameter). The curves are computed from Eq. (21) with pres-sure of 250 hPa and initial supersaturation of 0.3.
The exponent ofθdoes not depend ons0and neither onb.
Thus, one can set up the following criterion: If the su-persaturation can increase to the threshold value for homo-geneous nucleation,shom, the latter will dominate in cirrus
formation, that is, much more ice crystals will be produced by homogeneous than by heterogeneous nucleation. Whether
smax will reach such a high value depends on the
supersat-uration necessary for heterogeneous nucleation,s0, on
tem-perature (sinceshom depends linearly onT), and on the ratio of the relevant time scales,τg/τu. For checking the criterion one computessmax≈f (T ) (τg/τu)2+s0.
Finally, I derive a formula for the limiting case where
smax = shom(T ). First, I define the threshold supersatu-ration for homogeneous nucleation as that value where one ice crystal per cubic metre will be formed in an uplifting air-mass. From the boxmodel calculations I find
shom(T )=2.193−7.47×10⁻³T , (15) whereT is in K. Next we need an expression for the growth time scale (see above). The coefficient of diffusion of vapour in air,D, can be parameterised as:
D=2.11×10⁻⁵
T
T0
1.94p
0
p
, (16)
withD in m2/s (Pruppacher and Klett, 1978). Here,T0 =
273.15 K,p0=101325 Pa, andpis air pressure.
Assuming that the initial supersaturations0is transferred
completely intoN spherical ice crystals of equal size, their radius would be
r0=
3s0e∗(T )
4π N RvT ρi
1/3
, (17)
with the bulk density of iceρi =900 kg/m3. If constant num-bers are collected, the growth time scale can then be written in the following form:
τg−1=1.40×10⁻⁶T1.61p−1[s0e∗(T )]1/3N2/3. (18)
(All quantities in SI units). In a similar way it is possible to write an expression for the updraft time scale:
τu−1=59.9w T−2. (19)
Now, the condition that homogeneous nucleation does not get effective is
f (T ) (τg/τu)2+s0<2.193−7.47×10−3T . (20) Inserting the expressions for the time scales, and solving for the ice crystal number density, N, yields a critical number densityNc, when an equal sign is set in Eq. (20). This is:
Nc=
2.81×10¹¹f (T )3/4w3/2p3/2 T5.415[s
0e∗(T )]1/2(shom(T )−s0)3/4
. (21)
(Again, everything in SI units, i.e. m−3, m/s, K, and Pa). The critical number densityNc marks the transition region between homogeneous and heterogeneous cirrus formation. It should be understood as a rough estimate. This means that ice production will be dominated by heterogeneous processes if the concentration of heterogeneous ice nuclei exceedsNc; in turn, it will be dominated by homogeneous nucleation if
Nis smaller than the critical valueNcby about half an order of magnitude or even smaller.
As Eq. (21) shows, the sensitivity of the critical concentra-tion of heterogeneous ice nuclei,Nc, to changes of tempera-ture and updraft speed are much more important than those to changes of eithers0orp(althoughphas also the power
3/2; but the relative variation ofp in the upper troposphere is generally small compared to variations ofw). The depen-dences ofNcon temperature and updraft speed is illustrated in Fig. 8.
5 Summary and conclusions
of sulfuric acid where a fraction of these droplets bears an inclusion of soot. It was assumed as a working hypothesis that such an aerosol freezes according to the parameterisa-tion given by DeMott et al. (1997). The aerosol cloud was situated in an uplifting and thereby adiabatically cooling air-mass where it eventually formed ice crystals. The initial tem-perature of all simulations was−53◦C or lower.
The boxmodel simulations have shown that the transition between homogeneously dominated and heterogeneously dominated cirrus formation occurs over a range of heteroge-neous ice nucleus concentration of about one order of mag-nitude. This transition can in principle be characterised by a critical concentration of heterogeneous ice nuclei which de-pends in particular on temperature and updraft speed. From the box model simulations it was possible to determine crit-ical soot concentrations of the order 0.01–0.1 ng m−3.
How-ever, several uncertainties exist in the derivation of the crit-ical soot concentrations. First, the precise mechanism by which ice germs are formed on soot surfaces is currently un-known. The parametrisation I have used for heterogeneous nucleation (DeMott et al., 1997) is a simple extrapolation of results DeMott (1990) has obtained for water droplets with soot inclusions between−25◦C and−40◦C to sulfuric acid solution droplets with inclusions and to temperatures below
−53◦C. This is a bold procedure that must be viewed with caution. Second, I have used a specific soot surface that is in the lower range of currently accepted values. Higher specific soot surfaces would translate into lower critical soot concen-trations. Third, it turned out that the temperature dependence of water vapour saturation pressure and of the deposition co-efficient (more exactly: details of the initial growth of small ice crystals, see also Gierens et al., 2003) are as important as the surface number density of active nucleation sites for the determination of the critical soot concentration. Their values resulting from the simulations should therefore at best con-sidered estimates and not be taken as exact quantities.
The boxmodel simulations suggested to consider the tem-poral evolution of ice supersaturation after an assumed het-erogeneous freezing event at an initial supersaturation,s0, to
be crucial for the question whether homogeneous nucleation can later take over cirrus formation or not. An analytical esti-mate has been derived that provides the critical concentration of ice nuclei as a function of temperature, updraft speed, am-bient pressure, ands0. This formula can be used for simple decision measures in cirrus parametrisations of large scale models, of which nucleation mode should be switched on and which should be switched off.
In stronger updrafts it needs generally higher concentra-tions of heterogeneous ice nuclei to suppress homogeneous nucleation. I expect, in agreement with results of earlier sim-ulations by others, that heterogeneous nucleation is mostly unimportant for updrafts stronger thanw=20 cm s−1. How-ever, in young aircraft plumes or otherwise heavily polluted areas it is possible to reach higher concentrations of hetero-geneous ice nuclei (e.g. soot). For example, a modern jet
aircraft engine with a specific soot emission of 0.02 g per kg kerosene burnt (Schumann, 2002), assuming a fuel flow of 0.8 kg s−1 and a flight speed of 250 m s−1 can yield a soot concentration in the first second after emission of about 10 ng m−3, which is much higher than the critical values listed above. Thus, cases withCsoot≈1 ng m−3in internal mixture are not impossible in the atmosphere, and can prob-ably be produced in the northern hemispheric tropopause re-gion by aviation (Rahmes et al., 1998). In such heavily pol-luted cases homogeneous nucleation would be suppressed until updrafts of about 1 m s−1 or so are reached. Rahmes et al. (1998) have computed that the 1992 aviation produced a soot concentration above 10−2ng m−3in a considerable at-mospheric volume in the northern hemisphere. Thus it can-not be excluded that heterogeneous nucleation is much more important for cirrus formation in the northern hemisphere than anywhere else. In fact, recent lidar measurements of cirrus clouds in both northern and southern midlatitudes sug-gest that just this is the case (Immler and Schrems, 2002).
If the concentration of heterogeneous ice nuclei is just above its critical value, the corresponding heterogeneously formed cirrus cloud will be much optically thinner (perhaps even subvisible) than a cirrus formed homogeneously, be-cause much less ice crystals are produced via heterogeneous nucleation just above the threshold than via the homogeneous process. The clouds get, however, optically thicker again with increasing concentration of heterogeneous ice nuclei al-though they generally will be less optically thick than those formed homogeneously. Thus, over polluted regions there may be a higher coverage of cirrus clouds (because of the lower formation threshold), but the clouds will probably be thinner. An exception of this rule is the formation of con-densation trails because there the concentration of heteroge-neous ice nuclei is by many orders of magnitude higher than in the background atmosphere. Cirrus optical depths in re-gions with a heavy load of air traffic therefore may be on the average larger than in other polluted regions of the northern hemisphere.
Acknowledgements. This work has been performed for the project “D¨unner Zirrus” (thin cirrus) which is financed by the Deutsche Forschungsgemeinschaft under grant Gi 333/1-1. It contributes also to the project PAZI (Partikel aus Flugzeugtriebwerken und ihr Ein-fluss auf Kondensstreifen, Zirruswolken und Klima), funded by the Strategiefonds of the Helmholtz–Gemeinschaft.
References
DeMott, P. J.: An exploratory study of ice nucleation by soot aerosols, J. Appl. Meteorol., 29, 1072–1079, 1990.
DeMott, P. J., Chen, Y., Kreidenweis, S. M., Rogers, D. C., and Sherman, D. E.: Ice formation by black carbon particles, Geo-phys. Res. Lett., 26, 2429–2432, 1999.
Fahey, D. W. and Schumann, U.: Aviation–produced aerosols and cloudiness, in: Aviation and the global atmosphere, (Eds) Pen-ner, J. E., Lister, D. H., Griggs, D. J., Dokken, D. J., and McFar-land, M., IPCC Special report, Cambridge University Press, 65– 120, 1999.
Gierens, K. M.: Numerical simulations of persistent contrails, J. At-mos. Sci., 53, 3333–3348, 1996.
Gierens, K. M., Schumann, U., Smit, H. G. J., Helten, M., and Z¨angl, G.: Determination of humidity and temperature fluctua-tions based on MOZAIC data and parametrization of persistent contrail coverage for general circulation models, Ann. Geophys-icae, 15, 1057–1066, 1997.
Gierens, K. M. and Str¨om, J.: A numerical study of aircraft induced ice cloud formation, J. Atmos. Sci., 55, 3253–3263, 1998. Gierens, K., Schumann, U., Helten, M., Smit, H., and Wang, P.-H.:
Ice-supersaturated regions and sub visible cirrus in the northern midlatitude upper troposphere, J. Geophys. Res., 105, 22 743– 22 754, 2000.
Gierens, K. M., Monier, M., and Gayet, J.-F.: The deposition coef-ficient and its role for cirrus clouds, J. Geophys. Res., 108(D2), 4069, doi: 10.1029/2001JD001558, 2003.
Heymsfield, A. J. and Sabin, R. M.: Cirrus crystal nucleation by homogeneous freezing of solution droplets, J. Atmos. Sci., 46, 2252–2264, 1989.
Heymsfield, A. J. and Miloshevich, L. M.: Homogeneous ice nucle-ation and supercooled liquid water in orographic wave clouds, J. Atmos. Sci., 50, 2335–2353, 1993.
Immler, F. and Schrems, O.: LIDAR measurements of cirrus clouds in the northern and southern midlatitudes during INCA (55◦N, 53◦S): A comparative study, Geophys. Res. Lett., 29, 10.1029/2002GL015077, 2002.
Jensen, E. J. and Toon, O. B.: Ice nucleation in the upper tropo-sphere: Sensitivity to aerosol composition and size distribution, temperature, and cooling rate, Geophys. Res. Lett., 21, 2019– 2022, 1994.
Jensen, E. J. and Toon, O. B.: The potential impact of soot particles from aircraft on cirrus clouds, Geophys. Res. Lett., 24, 249–252, 1997.
K¨archer, B. and Lohmann, U.: A parameterization of cirrus cloud formation: Homogeneous freezing of supercooled aerosols, J. Geophys. Res., 107, 10.1029/2001JD000470, 2002.
K¨archer, B., Peter, T., Biermann, U. M., and Schumann, U.: The initial composition of jet condensation trails, J. Atmos. Sci., 53, 3066–3083, 1996.
Koenig, L. R.: Numerical modelling of ice deposition, J. Atmos.
Sci., 28, 226–237, 1971.
Koop, T., Luo, B. Tsias, A., and Peter, T.: Water activity as the de-terminant for homogeneous ice nucleation in aqueous solutions, Nature, 406, 611–614, 2000.
Kristensson, A., Gayet, J.-F., Str¨om, J., and Auriol, F.: In situ ob-servations of a reduction in effective crystal diameter in cirrus clouds near flight corridors, Geophys. Res. Lett., 27, 681–684, 2000.
Marenco, A., Thouret, V., Nedelec, P., Smit, H., Helten, M., Kley, D., Karcher, F., Simon, P., Law, K., Pyle, J., Poschmann, G., von Wrede, R., Hume, C., and Cook, T.: Measurement of ozone and water vapor by Airbus in–service aircraft: The MOZAIC airborne program, an overview, J. Geophys. Res., 103, 25 631– 25 642, 1998.
Pruppacher, H. R. and Klett, J. D.: Microphysics of clouds and pre-cipitation. D. Reidel publishing company, Dordrecht (NL), XV, 714 pp., 1978.
Rahmes, T. F., Omar, A. H., and Wuebbles, D. J.: Atmospheric dis-tributions of soot particles by current and future aircraft fleets and resulting radiative forcing on climate, J. Geophys. Res., 103, 31 657–31 667, 1998.
Sassen, K. and Dodd, G. C.: Homogeneous nucleation rate for highly supercooled cirrus cloud droplets, J. Atmos. Sci., 45, 1357–1369, 1988.
Sassen, K. and Benson, S.: Ice nucleation in cirrus clouds: A model study of the homogeneous and heterogeneous modes, Geophys. Res. Lett., 27, 521–524, 2000.
Sausen, R., Gierens, K. Ponater, M., and Schumann, U.: A diag-nostic study of the global distribution of contrails, Part I: Present day climate, Theor. Appl. Climatol., 61, 127–141, 1998. Schumann, U.: Contrail cirrus, in: Cirrus, (Eds) Lynch, D., Sassen,
K., O’C. Starr, D., and Stephens, G., Oxford University Press, Oxford, United Kingdom, 231–255, 2002.
Spice, A., Johnson, D. W., Brown, P. R. A., Darlison, A. G., and Saunders, C. P. R.: Primary ice nucleation in orographic cirrus clouds: A numerical simulation of the microphysics, Q. J. R. Meteorol. Soc., 125, 1637–1667, 1999.
Str¨om, J. and Ohlsson, S.: In situ measurements of enhanced crystal number densities in cirrus clouds caused by aircraft exhaust, J. Geophys. Res., 103, 11 355–11 361, 1998.
Vali, G.: Nucleation terminology, Bull. Amer. Meterol. Soc., 66, 1426–1427, 1985.
Wang, P.-H., Minnis, P., McCormick, M. P., Kent, G. S., and Skeens, K. M.: A 6–year climatology of cloud occurrence frequency from Stratospheric Aerosol and Gas Experiment II observations (1985–1990), J. Geophys. Res., 101, 29 407–29 429, 1996. Young, K. C.: Microphysical processes in clouds, Oxford