ACPD
13, 26579–26625, 2013External industrial sources on the air quality of Mexico
V. H. Almanza et al.
Title Page
Abstract Introduction
Conclusions References
Tables Figures
◭ ◮
◭ ◮
Back Close
Full Screen / Esc
Printer-friendly Version Interactive Discussion
Discussion
P
a
per
|
D
iscussion
P
a
per
|
Discussion
P
a
per
|
Discuss
ion
P
a
per
|
Atmos. Chem. Phys. Discuss., 13, 26579–26625, 2013 www.atmos-chem-phys-discuss.net/13/26579/2013/ doi:10.5194/acpd-13-26579-2013
© Author(s) 2013. CC Attribution 3.0 License.
Atmospheric Chemistry and Physics
Open Access
Discussions
This discussion paper is/has been under review for the journal Atmospheric Chemistry and Physics (ACP). Please refer to the corresponding final paper in ACP if available.
Impact of external industrial sources on
the regional and local air quality of
Mexico Megacity
V. H. Almanza1, L. T. Molina2,3, G. Li2, J. Fast4, and G. Sosa1
1
Instituto Mexicano del Petróleo, 07730 Mexico, D.F., Mexico
2
Molina Center for Energy and the Environment, La Jolla, CA, USA
3
Massachusetts Institute of Technology, Cambridge, MA, USA
4
Pacific Northwest National Laboratory, Richland, WA, USA
Received: 6 June 2013 – Accepted: 26 September 2013 – Published: 15 October 2013
Correspondence to: G. Sosa ([email protected])
ACPD
13, 26579–26625, 2013External industrial sources on the air quality of Mexico
V. H. Almanza et al.
Title Page
Abstract Introduction
Conclusions References
Tables Figures
◭ ◮
◭ ◮
Back Close
Full Screen / Esc
Printer-friendly Version Interactive Discussion
Discussion
P
a
per
|
D
iscussion
P
a
per
|
Discussion
P
a
per
|
Discuss
ion
P
a
per
|
Abstract
The air quality of megacities can be influenced by external emissions sources on both global and regional scale, and at the same time their outflow emissions can exert an important impact to the surrounding environment. The present study evaluates an SO2 peak observed on 24 March 2006 at the suburban supersite T1 and ambient air quality
5
monitoring stations located in the north region of the Mexico City Metropolitan Area (MCMA) during MILAGRO campaign. We found that this peak could be related to an important episodic emission event from Tizayuca region, northeast of the MCMA. Back trajectories analyses suggest that the emission event started in the early morning at 04:00 LST and lasted for about 9 h. The estimated emission rate is noticeably high,
10
about 2 kg s−1. This finding suggests the possibility of “overlooked” emission sources
in this region that could influence the air quality of the MCMA. This further motivated us to study the cement plants, including those in the State of Hidalgo and in the State of Mexico, and we found that they can contribute in the NE region of the basin (about 41.7 %), at the suburban supersite T1 (41.23 %) and at some monitoring stations their
15
contribution can be even higher than from the Tula Industrial Complex.
The contribution of Tula Industrial Complex to regional ozone levels is estimated. The model suggests low contribution to the MCMA (1 ppb to 4 ppb) and slightly higher at the suburban T1 (6 ppb) and rural T2 (5 ppb) supersites. However, the contribution could be as high as 10 ppb in the upper northwest region of the basin and in the southwest and
20
south-southeast regions of State of Hidalgo. In addition, a first estimate of the potential contribution from flaring activities to regional ozone levels is presented. Emission rates are estimated with a CFD combustion model. Results suggest that up to 30 % of the total regional ozone from TIC could be related to flaring activities.
Finally, the influence in SO2 levels from technological changes in the existing
refin-25
ACPD
13, 26579–26625, 2013External industrial sources on the air quality of Mexico
V. H. Almanza et al.
Title Page
Abstract Introduction
Conclusions References
Tables Figures
◭ ◮
◭ ◮
Back Close
Full Screen / Esc
Printer-friendly Version Interactive Discussion
Discussion
P
a
per
|
D
iscussion
P
a
per
|
Discussion
P
a
per
|
Discuss
ion
P
a
per
|
concentration. Reductions in external sources tend to affect more the northern part of
the basin (−16.35 % to −45.58 %), whilst reductions of urban sources in the
megac-ity tend to diminish SO2 levels substantially in the central, southwest, and southeast
regions (−30.71 % to−49.75 %).
1 Introduction
5
In 2011 there were 23 megacities of at least 10 million inhabitants. It is expected that this number will increase to 37 by 2025, which will include one more in Northern Amer-ica and two more in Latin AmerAmer-ica (UN, 2012). These urban settlements are important engines of growing economies, but at the same time they are large sources of air pol-lutants and climate-forcing agents (Parrish and Zhu, 2009). This can impact population
10
health, promote ecosystem degradation, visibility impairment, contribute significantly to the burden of greenhouse gases and influence the atmospheric oxidizing capacity on a global scale (Molina et al., 2004; Butler and Lawrence, 2009; Parrish et al., 2011). International collaborative projects have been conducted recently in order to assess the impact of megacities air pollution at several spatial scales, including policy relevant
15
aspects. These projects include 2006-MILAGRO (Megacity Initiative: Local and Global Research Observations) and CalNex 2010 (Air Quality and Climate Change Field Study in California in 2010) in North America; MEGAPOLI (Megacities: Emissions, urban, re-gional, and Global Atmospheric POLlution and climate effects, and Integrated tools
for assessment and mitigation), CityZen (megaCity – Zoom for the ENvironment) and
20
REPARTEE (Regents Park and Tower Environmental Experiment) in Europe; ADAPTE (Adaptation to health impacts of air pollution and climate extremes in Latin American cities) and SAEMC (the South American Emissions Megacities and Climate) in Latin America; CAREBeijing (Campaigns of Air Quality Research in Beijing and Surround-ing Regions), IMPACT (Integrated Measurement Programme for Aerosol and oxidant
25
ACPD
13, 26579–26625, 2013External industrial sources on the air quality of Mexico
V. H. Almanza et al.
Title Page
Abstract Introduction
Conclusions References
Tables Figures
◭ ◮
◭ ◮
Back Close
Full Screen / Esc
Printer-friendly Version Interactive Discussion
Discussion
P
a
per
|
D
iscussion
P
a
per
|
Discussion
P
a
per
|
Discuss
ion
P
a
per
|
Cities in Africa and ICARTT (The International Consortium for Atmospheric Research on Transport and Transformation) over North America, the Atlantic and Europe (Molina et al., 2010; WMO/IGAC, 2012; Freutel et al., 2013).
The MILAGRO field campaign focused on the air pollution plume of the Mexico City Metropolitan Area (MCMA) (Molina et al., 2010). The MCMA is the largest megacity
5
in North America, and the third largest urban agglomeration after Tokyo (Japan) and Delhi (India) (UN, 2012). It is located in the subtropics within an elevated U-shaped basin surrounded by mountain ridges which border the west, east and south regions of the city. The metropolitan area covers 1500 km2on the southwest side (Williams et al., 1995; Molina and Molina, 2002; Parrish et al., 2011).
10
In a recent study, Butler et al. (2012) analyzed the extent to which external air pol-lution sources could influence megacities air quality, in particular ozone. In all the con-sidered future scenarios, they found that ozone air quality in the megacities is strongly influenced by ozone production external to the cities. In addition, Sofiev et al. (2011) studied the impact of regional and global scale emissions in European megacities
dur-15
ing the MEGAPOLI project. They found that in specific cases the influence of external sources on the air quality can be significant and dominating, even more than mobile source emissions. These studies corroborate earlier findings for sulfur dioxide obtained for the Mexico megacity, since aside from the large number of industries within the basin, the city can be impacted not only by emission sources located in the State of
Hi-20
dalgo, outside the MCMA, but also by the Popocatepetl volcano (de Foy et al., 2009a). Back trajectory analysis has been used extensively to estimate source attribution in air quality studies (Gebhart et al., 2005; Lee and Ashbaugh, 2007). For instance: the ef-fect of uncertainties in the emission inventories of PM10in the UK (Whyatt et al., 2007);
the identification of shipping and port emissions from the Pacific Coast as major source
25
regions of atmospheric sulfate aerosols in western US (Xu et al., 2006); the potential underestimation of Mexican SO2 emissions during 1999 Big Bend Regional Aerosol
ACPD
13, 26579–26625, 2013External industrial sources on the air quality of Mexico
V. H. Almanza et al.
Title Page
Abstract Introduction
Conclusions References
Tables Figures
◭ ◮
◭ ◮
Back Close
Full Screen / Esc
Printer-friendly Version Interactive Discussion
Discussion
P
a
per
|
D
iscussion
P
a
per
|
Discussion
P
a
per
|
Discuss
ion
P
a
per
|
its precursors into the Metropolitan Area of Sao Paulo (Brazil) (Sánchez-Ccoyllo et al., 2006); and the impact of trans-pacific emissions in ozone and acyl peroxy nitrates lev-els in North America (Jaffe et al., 2003; Wolfe et al., 2007). In addition, source/receptor
studies can point to a source that may have been overlooked (Molina et al., 2004). In the MCMA, trajectory analysis using FLEXPART has been applied for
corroborat-5
ing the origin of nitrogen-containing organic carbon particles at T0 to local industrial emissions under stagnant flow conditions (Moffet et al., 2008), showing that Na and
Zn particles are transported from the northern part of the basin to the southeast of the MCMA (Johnson et al., 2006), and illustrating that the morning aerosol at T0 contained both fresh and transported aged emissions from Tula (Moffet et al., 2010). FLEXPART 10
has also been used to assess model performance between MM5 and WRF config-urations (de Foy et al., 2009b), evaluating estimates of CO and SO2 in the national
emissions inventory (de Foy et al., 2007), suggesting potential urban sources of Pb inside the basin (Salcedo et al., 2010), and studying the age of plumes outside the basin and its effects on black carbon mixing state during atmospheric transport (Sub-15
ramanian et al., 2010). Thus, these studies support the usage of FLEXPART model to simulate dispersion of emissions and to identify potential source regions that contribute to pollutants in the megacity.
Industrial emissions can be divided into four categories: nearly constant, routinely variable, allowable episodic and large episodic events (Allen et al., 2004). Allowable
20
episodic events lead to a significant increase in emission rate, yet below the maximum daily permit level. Large episodic events are either unplanned or event-driven infre-quent emissions from industrial facilities that are not covered by a state or federal per-mit (Allen et al., 2004; Nam et al., 2008; USEPA, 2001). Relevant point sources have been related to SO2 episodic events using back trajectory analysis (Prtenjak et al.,
25
vol-ACPD
13, 26579–26625, 2013External industrial sources on the air quality of Mexico
V. H. Almanza et al.
Title Page
Abstract Introduction
Conclusions References
Tables Figures
◭ ◮
◭ ◮
Back Close
Full Screen / Esc
Printer-friendly Version Interactive Discussion
Discussion
P
a
per
|
D
iscussion
P
a
per
|
Discussion
P
a
per
|
Discuss
ion
P
a
per
|
cano, whilst others to the Tula Industrial Complex (TIC), or even to both of them (de Foy et al., 2007, 2009a; Williams, et al., 1995). However, these studies have not addressed short-term impacts of potential sources outside the Tula industrial area. In the present study we investigate if an episodic event outside TIC could impact the SO2 pollution levels in the megacity on 24 March 2006 during MILAGRO campaign. In this respect,
5
an important region is Tizayuca, which is located in the southern region of the State of Hidalgo, about 60 km to the northeast of the MCMA, and about 16 km southwest the rural supersite T2. It is home of pulp and paper, foundry and chemical manufacturing industries among others. To the best of our knowledge, sulfur dioxide emissions from Tizayuca region have not been considered in previous studies.
10
Ozone is of particular concern in the MCMA. Although the air quality has improved over the last decade, high surface ozone levels are persistent. For instance, measured concentrations can exceed the Mexican air quality standard more than half the year, and peak values can reach more than 300 ppb (Lei et al., 2007; Zhang and Dubey, 2009). However, related studies analyzing the influence of regional or local emission
15
sources in the ozone formation dynamics of the MCMA, have not addressed the con-tribution by the Tula Industrial Complex, including those from flaring activities.
1.1 Tula region
The city of Tula is located in the Mezquital Valley, in southwest Hidalgo with a total population of nearly 94 000 inhabitants and more than 140 industries. The region is
20
semi-arid with average temperatures of 17◦C and precipitation ranging from 432 to
647 mm, increasing from north to south. In this region, the Tula Industrial Complex is settled in an area of 400 km2. The major industries of the city are located within this region, including the Miguel Hidalgo Refinery (MHR), the Francisco Perez Rios power plant (FPRPP), several cement plants and limestone quarries. Other minor industries
25
ACPD
13, 26579–26625, 2013External industrial sources on the air quality of Mexico
V. H. Almanza et al.
Title Page
Abstract Introduction
Conclusions References
Tables Figures
◭ ◮
◭ ◮
Back Close
Full Screen / Esc
Printer-friendly Version Interactive Discussion
Discussion
P
a
per
|
D
iscussion
P
a
per
|
Discussion
P
a
per
|
Discuss
ion
P
a
per
|
is classified as a critical area due to the high emissions of SO2 and particulate matter (SEMARNAT-INE, 2006).
The present work investigates the influence of external emission sources on the air quality of the MCMA in terms of SO2and O3. Our primary objectives are to (1) explain an episodic event of SO2 in the north region of the MCMA during the last week of
5
MILAGRO campaign, (2) study the contribution of additional external sources to the SO2pollution levels in the city, and (3) estimate the contribution of TIC to the regional O3levels.
The importance of this study relies on highlighting a relatively high SO2peak
regis-tered on several monitoring stations in the north of the MCMA, which was not
repro-10
duced in previous simulations by WRF-Chem, could be related to an important emis-sion event on 24 March. It presents a first estimate of the contribution from other ex-ternal sources (cement plants and industrial emissions of the northeastern region of the basin) which can be important to consider in the bulk of external emissions. The scope of this study has been broadened to include ozone formation from TIC
precur-15
sors. It includes a first estimate of the contribution of existing flaring activities to the regional levels of ozone. In addition, it presents a brief discussion about potential re-ductions in TIC as a result of technological changes motivated by the construction of a new refinery in Tula region. The paper is organized as follows: Sect. 2 presents the modeling procedure; Sect. 3 the results and discussion, and finally the conclusions are
20
presented in Sect. 4.
2 Model description
2.1 Air quality model
WRF-Chem version 3.2.1 is used for the air quality simulation. It is a chemistry model fully coupled to the Weather Research and Forecasting (WRF) model (Grell et al.,
ACPD
13, 26579–26625, 2013External industrial sources on the air quality of Mexico
V. H. Almanza et al.
Title Page
Abstract Introduction
Conclusions References
Tables Figures
◭ ◮
◭ ◮
Back Close
Full Screen / Esc
Printer-friendly Version Interactive Discussion
Discussion
P
a
per
|
D
iscussion
P
a
per
|
Discussion
P
a
per
|
Discuss
ion
P
a
per
|
2005; Skamarock et al., 2005; Fast et al., 2006). In addition to photochemistry, the model includes several aerosol and photolysis schemes.
2.1.1 WRF-Chem configuration
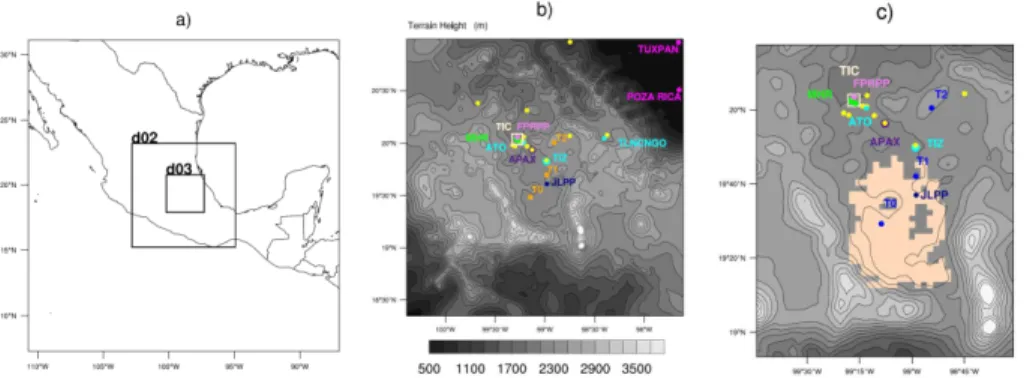
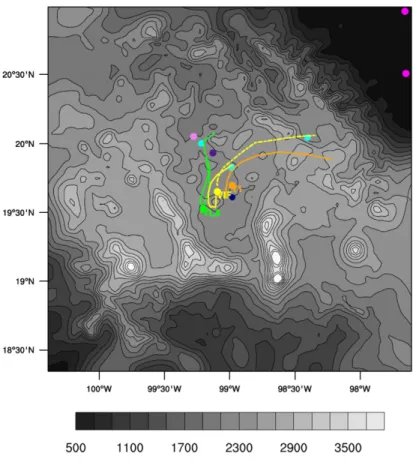
A 6 day simulation period, from 00:00 UTC 22 March to 00:00 UTC 28 March of 2006 is conducted using three domains in one-way nesting configuration. The horizontal
5
resolution of each domain is 27, 9 and 3 km respectively, with 100×100 nodes and
35 vertical levels (Fig. 1a). The parameterizations used in this work include the Pur-due Lin microphysics (Lin et al., 1983; Chen and Sun, 2002), the NOAH Land Surface Model (Chen and Dudhia, 2001), the Yonsei University (YSU) scheme for the Planetary Boundary Layer (PBL) (Hong et al., 2006), the Monin–Obukov model for the surface
10
layer (Skamarock et al., 2005), the Grell–Devenyi scheme for the convective parame-terization (Grell and Devenyi, 2002), the RRTM (Mlawer et al., 1997) and Dudhia (Dud-hia, 1989) schemes for the longwave and shortwave radiation respectively. The gravity wave drag option is used just in the first domain. Six hourly data of the NCEP-FNL (Final) Operational Global Analysis with a resolution of 1◦
×1◦ are used for initial and
15
lateral boundary conditions. The land use data is interpolated from the Moderate Res-olution Imaging Spectroradiometer (MODIS) land-cover classification dataset provided by WRF (WRF-ARW user guide).
Multi-scale four-dimensional data assimilation (FDDA) (Stauffer and Seaman, 1990)
is used to nudge meteorology in all the simulation period to reduce uncertainty in the
20
simulated wind speed and direction (Gilliam et al., 2012). The data sets include the FNL final analysis, the NCEP ADP Global Surface Observational Weather Data and the NCEP ADP Global Upper Observational Weather Data corresponding to NCAR archives ds464.0 and ds353.4 respectively. In addition, surface observations from the MCMA Air Quality Monitoring Network (RAMA) stations together with surface,
ra-25
(OB-ACPD
13, 26579–26625, 2013External industrial sources on the air quality of Mexico
V. H. Almanza et al.
Title Page
Abstract Introduction
Conclusions References
Tables Figures
◭ ◮
◭ ◮
Back Close
Full Screen / Esc
Printer-friendly Version Interactive Discussion
Discussion
P
a
per
|
D
iscussion
P
a
per
|
Discussion
P
a
per
|
Discuss
ion
P
a
per
|
SGRID) using the Cressman method. Surface analysis fields for surface nudging are generated at 1 h interval.
WRF-Chem is run with the CBM-Z photochemical mechanism (Zaveri and Peters, 1999), together with the FAST-J (Wild et al., 2000) photolysis scheme. Aerosol chem-istry is neglected in the present study. It is assumed that conversion of SO2 to sulfate
5
has a small impact in the final model concentration. The chemical boundary conditions are set with the ideal profile provided by WRF-Chem. It consists of idealized, north-ern hemispheric, mid-latitude, clean environmental profiles of trace gases based upon the results from the NOAA Aeronomy Lab Regional Oxidant Model (NALROM) (Grell et al., 2005; Tuccella et al., 2012). Zhang et al. (2009) report small sensitivity of forecast
10
concentrations using the idealized profiles during MILAGRO campaign. The Emissions Inventory used in the present study is based on the 2006 MCMA official inventory as
compiled by the Molina Center for Energy and the Environment (Li et al., 2010). In order to optimize computing time, the chemistry is solved just in the third domain.
3 Results and discussion
15
3.1 Air quality model performance
Previous research studies have shown the benefit of applying data assimilation in model performance of retrospective air quality simulations (Lo et al., 2008; Otte, 2008; Ngan et al., 2012), including the uncertainty reduction of the horizontal transport in the lower troposphere (Gilliam et al., 2012). Related work during MILAGRO campaign
re-20
ports that the inclusion of observation nudging improved the accuracy of meteorological fields (Doran et al., 2008; Fast et al., 2009; Bei et al., 2010; Song et al., 2010; Karyidis et al., 2011) and of horizontal diffusion (de Foy et al., 2007). In the present study
FDDA is applied in order to obtain an optimum WRF-Chem configuration which allows conducting simulations aimed to explain an episodic event and to obtain contribution
25
ACPD
13, 26579–26625, 2013External industrial sources on the air quality of Mexico
V. H. Almanza et al.
Title Page
Abstract Introduction
Conclusions References
Tables Figures
◭ ◮
◭ ◮
Back Close
Full Screen / Esc
Printer-friendly Version Interactive Discussion
Discussion
P
a
per
|
D
iscussion
P
a
per
|
Discussion
P
a
per
|
Discuss
ion
P
a
per
|
parameters in the plume transport of the TIC plume is also considered in the selection of the optimum model configuration. These parameters are the inclusion of convective parameterization in the third domain, of horizontal diffusion and of grid nudging within
the PBL of the wind field. In addition, nudging coefficients, influence of radar wind
pro-filers and radiosondes are also considered. The Grell–Devenyi scheme is used for the
5
convective parameterization in the innermost domain, in contrast to the Kain Fritsch scheme that was used in both previous and recent work (de Foy et al., 2007; Lei et al., 2013).
The performance of the meteorological fields obtained with WRF-Chem for the third domain is assessed by means of the Mean Absolute Error (MAE), the Root Mean
10
Squared Error (RMSE), the mean bias (BIAS), and the Index of Agreement (IOA) (Will-mott et al., 1985; Will(Will-mott and Matsuura, 2005). The model surface variables consid-ered for this purpose are the temperature at 2 m a.g.l. (T), wind speed (WS) at 10 m above ground level and wind direction (WD). With respect to the wind field, the RMSE of the vector wind difference (RMSEvec) is calculated. This statistic considers both 15
speed and direction errors (Fast, 1995). Observations from RAMA monitoring stations plus measurements at the three MILAGRO supersites T0, T1 and T2 (Molina et al., 2010) were used for the statistical comparison: Tacuba (TAC), Enep–Acatlán (EAC), Tlalnepantla (TLA), Xalostoc (XAL), Merced (MER), Plateros (PLA), Villa-de-las-Flores (VIF), Cuajimalpa (CUA), Tlalpan (TPN), Chapingo (CHA) and Tláhuac (TAH).
20
Sensitivity tests (not shown) of the afore-mentioned model parameters showed that the optimum configuration that best represented meteorology and transport of TIC plume is a continuous integration with convective parameterization. It presents a warm bias in temperature in most of the stations, ranging from 0.19◦C (TAC) to 1.78◦C (TPN).
MAE of wind speed is roughly below 1 m s−1, except in TAH (1.53 m s−1) and TPN 25
(2.28 m s−1); and BIAS ranges from
−0.95 m s−1 to 0.81 m s−1, with the exception of
TPN (−2.10 m s−1). RMSEvec ranges from 0.8 m s−1 (PLA) to 1.3 m s−1 (CHA), with
ACPD
13, 26579–26625, 2013External industrial sources on the air quality of Mexico
V. H. Almanza et al.
Title Page
Abstract Introduction
Conclusions References
Tables Figures
◭ ◮
◭ ◮
Back Close
Full Screen / Esc
Printer-friendly Version Interactive Discussion
Discussion
P
a
per
|
D
iscussion
P
a
per
|
Discussion
P
a
per
|
Discuss
ion
P
a
per
|
from−6.6◦(MER) to 11.26◦(T2). TPN station has the highest bias (29.63◦). Zhang and
Dubey (2009) also report highest wind speed error at TPN during MILAGRO.
Although there is relatively low performance at some stations, the inclusion of Multi-scale FDDA significantly improved the accuracy of WRF model. Since an important aspect of the present study is to investigate an emission event on 24 March, results
5
showed that the early morning dynamics in this day is better reproduced with this con-figuration. Thus, the meteorological fields can be considered reliable for this study. A previous work by Deng and Stauffer (2006) showed that combining observation
nudg-ing with convective parameterization improved the accuracy of meteorological fields during CAPTEX-83.
10
3.2 Influence of external sources
3.2.1 Tizayuca emissions
The interest in understanding an observed SO2peak during the simulation period was motivated by having a more accurate description of the sources that contribute to the bulk of external emissions into the Mexico megacity. In this way, more robust
scenar-15
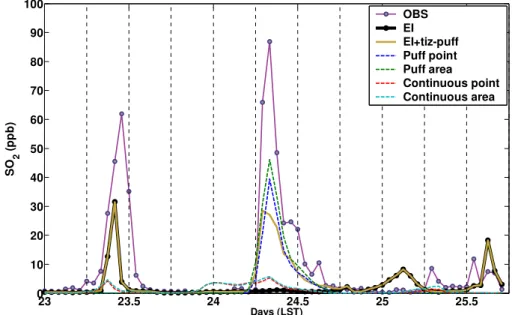
ios can be analyzed in future studies. This peak corresponds to a high concentration event comparable in magnitude to the major impingement of the TIC plume in the MCMA as suggested by the WRF model during the simulation period. This peak is ob-served at several ambient air quality monitoring stations (RAMA) within the MCMA on 24 March 2006, indicating an important emission event similar to 23 March was
feasi-20
ble. The concentration at some stations is even greater than on 23 March, in particular northeast region and T1 supersite (Fig. 2). However, the model does not reproduce the peak in any of the sensitivity cases (see Sect. 3.1) nor in the configuration of our previous study (Almanza et al., 2012).
It was speculated about the possibility that Tula contributed to this peak, since NW,
25
ACPD
13, 26579–26625, 2013External industrial sources on the air quality of Mexico
V. H. Almanza et al.
Title Page
Abstract Introduction
Conclusions References
Tables Figures
◭ ◮
◭ ◮
Back Close
Full Screen / Esc
Printer-friendly Version Interactive Discussion
Discussion
P
a
per
|
D
iscussion
P
a
per
|
Discussion
P
a
per
|
Discuss
ion
P
a
per
|
Tula mostly to the western ridge of the basin, suggesting no contribution from Tula (re-finery, power plant and cement plants) to NE stations. Nevertheless, observed concen-trations are relatively high in the NE region and at T1: 112 ppb at VIF and 86 ppb at T1 respectively. The model showed northeasterly wind from 00:00 LST to 12:00 LST and according to Fig. 2, the event at T1 started to evolve in the morning around 07:00 LST
5
and lasted for about nine hours. The timing in the time series indicates transport from T1 to the NE region, in agreement with WRF, suggesting the possibility of emissions coming farther from northeast T1. The Lagrangian model FLEXPART (Stohl, 2005) as adapted by Doran et al. (2008) and Fast and Easter (2006) to use WRF fields, is applied in order to further study this hypothesis.
10
Figure 3 shows the backward trajectories from 10:00 LST to 00:00 LST at 200 m and 750 m a.g.l. at several stations. At TLA (NW) the trajectories suggest the emissions came from Tula region, in agreement with WRF. However, at VIF (NE) the emissions would have come from a remote source in the northeast. Potential regions are Tiza-yuca (TIZ) and Tulancingo (TLNCNGO). In the state of Veracruz, important sources are
15
the power plant in Tuxpan, and the PEMEX facilities at Poza Rica. In east VIF there is the Jorge Luque Power Plant (JLPP). It was speculated that emissions from Poza Rica could have contributed to this episode, since according to PEMEX Poza Rica emitted on average 0.24 kg s−1 in 2009 (PEMEX, 2009). However, the model predicts
north-westerly wind at Poza Rica and Tuxpan for this time period discarding any contribution
20
from the regions in Veracruz. In addition WRF indicates northwesterly wind at JLPP, so that transport to the south/southeast discards any impact to NE stations. Forward dispersion from Tulancingo also resulted in negligible impact to the northeast region of the basin; but when released from Tizayuca the potential contribution to the peak was suggested.
25
In order to investigate the potential contribution of Tizayuca to the observed peak, an emission rate of 0.25 kg s−1of SO
2was estimated using emission factors from AP-42
ACPD
13, 26579–26625, 2013External industrial sources on the air quality of Mexico
V. H. Almanza et al.
Title Page
Abstract Introduction
Conclusions References
Tables Figures
◭ ◮
◭ ◮
Back Close
Full Screen / Esc
Printer-friendly Version Interactive Discussion
Discussion
P
a
per
|
D
iscussion
P
a
per
|
Discussion
P
a
per
|
Discuss
ion
P
a
per
|
and MCMA, was ignored in order to focus on the Tizayuca region. Results are pre-sented in Fig. 4. The simulations considered the emission source both as point and as an area source, in order to depict a representative emission scenario for this emis-sion event. The results with WRF-Chem using the original EI are included as reference (thick black line). When the estimated emission rate was held constant in all the
sim-5
ulation period, a small contribution with a slight overprediction in the early morning is identified on 24 March (red line). Results are similar when taking the emission as point or area source. Nevertheless, the observed peak was not reproduced. Based on this, the hypothesis of an intermittent release was considered and thus, a puff dispersion
scenario was conducted. It corresponds to the blue and green lines respectively. It
10
clearly shows that the peak of the event and its timing are reproduced. Prior runs with different emission intervals showed a 9 h release as the most representative release
period. Shorter periods better reproduced the magnitude of the peak but overpredicted the concentration at some stations in the northwest. The Lagrangian model suggests that the episode started in early morning, at 04:00 LST. Thus, it is likely that a 9 h event
15
in Tizayuca had a significant contribution in the external emissions that impacted the outskirts and northeast areas of the megacity. We estimate that the emission rate dur-ing the event could have been as high as 2 kg s−1, in contrast to the estimated emission
rate of 0.25 kg s−1based on reported data. In a related study during MCMA-2003 field
campaign, Johnson et al. (2006) found a sudden increase of Na, Mn, As and Zn
dur-20
ing the early morning of 9 April at CENICA site, in the southeast region of the MCMA. Similar to the present investigation, the emission event occurred during a cold surge episode (de Foy et al., 2008). They attributed the sharp increase to industries in the north/northeast region of the city. From Fig. 2b of their paper, emission sources farther northeast could have contributed as well. Tizayuca is on the path of the particle tracers
25
ACPD
13, 26579–26625, 2013External industrial sources on the air quality of Mexico
V. H. Almanza et al.
Title Page
Abstract Introduction
Conclusions References
Tables Figures
◭ ◮
◭ ◮
Back Close
Full Screen / Esc
Printer-friendly Version Interactive Discussion
Discussion
P
a
per
|
D
iscussion
P
a
per
|
Discussion
P
a
per
|
Discuss
ion
P
a
per
|
sunrise at T1 on 21 March, suggesting a buildup of pollution from nearby sources in the early morning.
Taking the emission event as an area source (green line) tends to increase the mag-nitude of the peak. This scenario was further explored with WRF-Chem (thick gold line). Although the peak of the event is reproduced, its magnitude is too low. This can be
at-5
tributed to an overprediction of the PBL height at T1, since data from Shaw et al. (2007) at 12:00 LST suggests a PBL height around 1066 m, whilst WRF predicts 1145.6 m. In addition, the emission source was placed in WRF-Chem at the third model level (137 m) whilst in FLEXPART the release was set from 85 m to 300 m a.g.l. Thus, it is likely that excluding plume rise had a significant contribution in underpredicting the magnitude
10
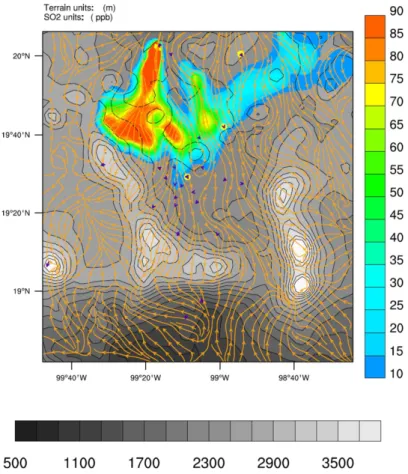
of the event. In spite of the variation in magnitude, the results can be representative. The Federal District Environmental Secretariat of Mexico City (SMA-GDF) supports a contribution from Tizayuca, since in their studies this region seems to be exerting some influence on the concentration levels of SO2in the north region of the MCMA (F. Hernández, private communication, 2013).
15
An implication of these results is that important emission sources could be masked by the Tula plume. When southwesterly wind transports the plume form Tula to the north, it also transports emissions from Tizayuca, so that when northerly wind trans-ports back the plume from Tula into the basin, the emissions from Tizayuca blends with those from Tula and both impact the MCMA, the north region in particular. This kind
20
of transport is feasible for 23 March. However, once the plume coming from Tula has passed throughout the basin and if northeasterly wind is present, emission sources other than the refinery, power plant and cement plants could become more significant (24 March; Fig. 5).
3.2.2 Cement plants
25
ACPD
13, 26579–26625, 2013External industrial sources on the air quality of Mexico
V. H. Almanza et al.
Title Page
Abstract Introduction
Conclusions References
Tables Figures
◭ ◮
◭ ◮
Back Close
Full Screen / Esc
Printer-friendly Version Interactive Discussion
Discussion
P
a
per
|
D
iscussion
P
a
per
|
Discussion
P
a
per
|
Discuss
ion
P
a
per
|
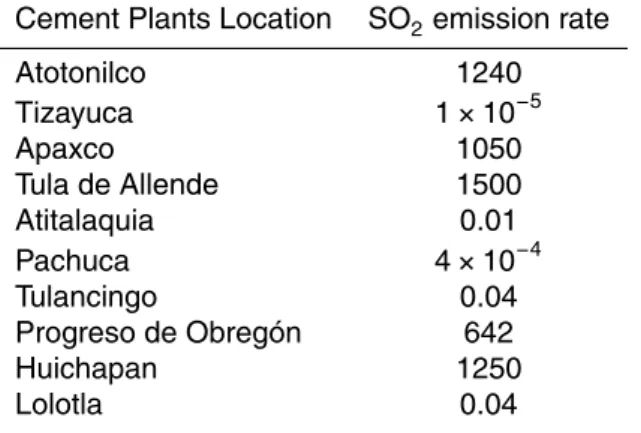
and materials such as used tires and industrial wastes (Zambrano García et al., 2009). Important cement plants are located in Huichapan, Progreso de Obregón, Atotonilco, and Tula de Allende (Fig. 1b). Facilities in Atotonilco are part of the Tula Industrial corri-dor and are southeast from the existing refinery. In addition, the cement plant in Apaxco (State of Mexico) municipality is important in terms of both emissions and location.
5
The study of the cement plants was motivated by the findings for Tizayuca region; basically, to know if additional emissions sources other than TIC could have contributed to SO2 levels in the MCMA during this simulation period. From Fig. 3, backward
tra-jectories at TLA suggest that emissions from Atotonilco and Apaxco could have been transported together with the TIC plume and thus could have impacted the MCMA.
10
This potential contribution from cement plants is simulated with WRF-Chem. The TIC emission rate was set to the measurement by Rivera et al. (2009) of 4.9 kg s−1. The
emission rates in the original EI are modified for the cement plants location. IMP has developed an emission inventory for the Tula region (IMPei) during MILAGRO cam-paign which included major cement plants (IMP, 2006). IMPei was used in our previous
15
study focusing on flaring emissions (Almanza et al., 2012). It is based on information provided by the Mexican Ministry of Environment (SEMARNAT). The emission rates were estimated based on AP-42 emission factors (Table 1).
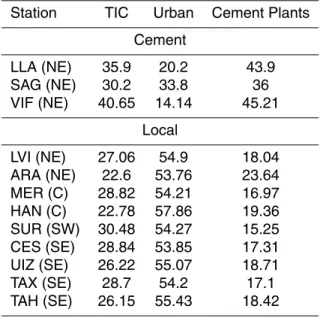
Results are presented in Fig. 6. It includes a contribution by source: urban (MCMA area and point sources), Tula (refinery+power plant) and cement plants. Stations are 20
ordered by geographical region. The average contribution is estimated by taking their respective proportion on the model average concentration and further compared with the average concentration of the respective RAMA station. All the emission sources contribute significantly to the SO2 levels in the MCMA, and in different proportion in
each of the geographical regions of the basin. In the simulation period, the highest
25
ACPD
13, 26579–26625, 2013External industrial sources on the air quality of Mexico
V. H. Almanza et al.
Title Page
Abstract Introduction
Conclusions References
Tables Figures
◭ ◮
◭ ◮
Back Close
Full Screen / Esc
Printer-friendly Version Interactive Discussion
Discussion
P
a
per
|
D
iscussion
P
a
per
|
Discussion
P
a
per
|
Discuss
ion
P
a
per
|
in Table 2. It shows the stations in which the urban emissions (local) are higher than the joint contribution of TIC and cement plants; and those stations in which cement plants contribute more than urban sources and TIC. The rest of the stations is split between those in which TIC contributes more than both urban and cement plants (VAL (NW); EAC (NW); TLA (NW); TLI (NW); ATI (NW); and PLA (SW)); and those in which
5
urban contribution is higher than either TIC or cement plants (TAC (NW); LPR (NE); XAL (NE); LAG (C); PED (SW), and T0 (supersite)). Results indicate that the plume of cement works can impinge at some stations 1 h before the plume of the existing refinery and the power plant (not shown). The emissions from the Popocatépetl volcano were estimated for the simulation period but resulted in negligible contribution.
10
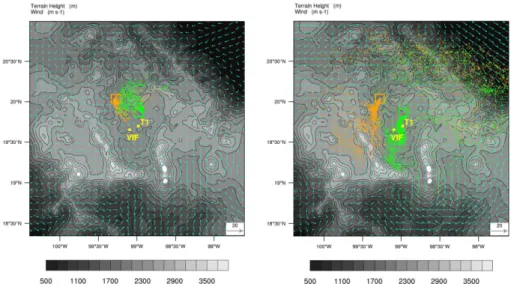
Topographical effects are important in the simulations results. WRF model predicts
at some hours of 23 and 24 March, that wind coming from the northeast tends to split near Tula so that when approximating to Sierra de Guadalupe, part of the wind flow goes northwest of the basin whilst the other goes northeast (Fig. 7). As a result, the emissions from TIC and possibly Atotonilco can be transported to the northwest, whilst
15
those from Apaxco can be transported to the northeast passing Sierra de Guadalupe and under favorable meteorological conditions they also can reach T1. When this wind flow goes farther to the south, the plume tends to pass by the east most stations, in-cluding ARA (NE), HAN (C), and UIZ (SE). The highest contribution from cement works occurs at VIF (NE) station; however, at T1 where the influence of local sources is
rel-20
atively small, cement plants contribution is comparable to TIC (46.3 % vs 41.23 %). In contrast, contribution from TIC was more important at the urban supersite T0, yet lower than local sources. These results indicate that cement plants could have had an impor-tant contribution in the external emissions that impacted the megacity in the simulation period of this study. It should be noted that the measurements by Rivera et al. (2009)
25
contri-ACPD
13, 26579–26625, 2013External industrial sources on the air quality of Mexico
V. H. Almanza et al.
Title Page
Abstract Introduction
Conclusions References
Tables Figures
◭ ◮
◭ ◮
Back Close
Full Screen / Esc
Printer-friendly Version Interactive Discussion
Discussion
P
a
per
|
D
iscussion
P
a
per
|
Discussion
P
a
per
|
Discuss
ion
P
a
per
|
bution of cement plants to the regional air quality. For instance, Vay et al. (2009) ana-lyzed radiocarbon samples over Mexico City and surrounding regions during MILAGRO campaign and identified cement plants as potential emission sources of radiocarbon as CO2. They found anomalously enriched radiocarbon samples when the NASA DC-8 research aircraft approached the MCMA from State of Hidalgo. Karydis et al. (2011)
5
report that calcium from cement plants can contribute to coarse calcium concentra-tions at T1 and to increase coarse aerosol nitrate in surrounding regions as well. This is consistent with previous findings by Vega et al. (2001) who found that cement plants had the highest calcium abundance in PM10. Moffet et al. (2008) also report potential
contribution of coarse calcium particles from cement plants at T0. Rutter et al. (2009)
10
identified long-range transport of reactive mercury from cement activities at Tula de Allende, Atotonilco and Huichapan.
On average, TIC contributed more than cement plants, (35.92 % vs 22.61 %), but as the results suggest the impact of cement industry could be important in the upper half of the basin, even though the total emission rate for cement plants in this study is
15
1.6 kg s−1, roughly three times lower than the TIC estimate of 4.9 kg s−1. Nevertheless,
the results from the present study are constrained to March 2006 so that SO2emissions from the cement industry might have changed since then.
3.2.3 Ozone formation from TIC-generated precursors
As part of MILAGRO campaign, studies related to SO2, NO2, PAHs and metals have
20
implicated the influence of Tula industrial corridor in the local and regional air quality. However, the contribution of the industrial activity in Tula to the regional levels of ozone is not known. Ozone pollution is of great concern to the MCMA because of frequent exceedances to the national air quality standard. Since emissions from TIC can reach the MCMA under appropriate meteorological conditions, it is possible that ozone
pro-25
ACPD
13, 26579–26625, 2013External industrial sources on the air quality of Mexico
V. H. Almanza et al.
Title Page
Abstract Introduction
Conclusions References
Tables Figures
◭ ◮
◭ ◮
Back Close
Full Screen / Esc
Printer-friendly Version Interactive Discussion
Discussion
P
a
per
|
D
iscussion
P
a
per
|
Discussion
P
a
per
|
Discuss
ion
P
a
per
|
A WRF-Chem simulation focusing on the existing refinery at Tula is conducted for this purpose. According to the IMPei, 98 % of the total VOCs from TIC might be emitted from the Miguel Hidalgo Refinery, so that emissions from the power plant are neglected in this study. Nevertheless, IMPei is not speciated and emissions from single species are unknown. For this reason, the VOCs emissions rates of the national emissions
5
inventory are used to represent the refinery at the respective cell in the simulation domain. In addition, the NO2 emission rate reported in MILAGRO is used to account for both the refinery and the power plant (Rivera et al., 2009) accordingly.
Results suggest (Fig. 8a) that the contribution of precursors emitted from TIC to the ozone levels of the MCMA is rather low in this simulation period, with values ranging
10
from 1 ppb to 4 ppb. The highest values are at Cuajimalpa (3.7 ppb) (CUA) on 23 March and at Chapingo (4 ppb) (CHA) on 25 March, located at the northeast and southwest region of the basin respectively. In addition, the transport patterns during this period in-dicate that the highest contributions results from the impingement of the ozone plume generated by the TIC precursors, mostly in late afternoon; whilst the smaller
contribu-15
tions results from remnant ozone masses from the previous day, mostly in the morning. On 23 and 25 March the regional transport of ozone is similar (Fig. 8c and d). First, the transport of precursors is to northern Hidalgo in the early morning and after some hours they are transported back to the south towards MCMA. However, they differ in the time
when wind direction shifts (roughly) from north to south. On 23 March this shift occurs
20
around 03:00 LST so that the precursors reach the basin by 09:00 LST. On 25 March this shift occurred around 10:00 LST so that ozone formation starts in Hidalgo rather than in the basin as on 23 March. As a result, on 23 March the ozone plume split in the MCMA with higher levels on the western ridge of the basin; however, on 25 March the plume reaches part of the lower half of the basin around the southeast region without
25
splitting and resulting in a wider impact (Fig. 8d). On this day, the estimated contribution at MILAGRO supersites T1 and T2 is 6 ppb and 4 ppb respectively.
ACPD
13, 26579–26625, 2013External industrial sources on the air quality of Mexico
V. H. Almanza et al.
Title Page
Abstract Introduction
Conclusions References
Tables Figures
◭ ◮
◭ ◮
Back Close
Full Screen / Esc
Printer-friendly Version Interactive Discussion
Discussion
P
a
per
|
D
iscussion
P
a
per
|
Discussion
P
a
per
|
Discuss
ion
P
a
per
|
region of the basin, together with the southwest and south-southeast regions of State of Hidalgo are the most impacted areas in the simulation period. This is consistent with the findings by Zambrano García and co-workers (Zambrano García et al., 2010). They used the epiphyticTillandsia recurvataas a biomonitor and reported that regions from the industrial south to the agricultural north in the Mezquital Valley (Tula) presented
5
high deposition of bioaccumulative pollutants (metals and PAHs), mainly attributed to industrial activities in the area. The model also suggests that even in small concen-trations, ozone could be transported to eastern Hidalgo, northwestern Tlaxcala and farther northeastern State of Mexico on 23 and 25 March. Thus, it is feasible that TIC can be exerting greater influence on rural areas or in NOx-limited regions within the
10
basin. This can be important to crops in the long term.
Flaring
In order to have a better understanding of ozone formation from Tula refinery, the con-tribution of flaring activities at the refinery is estimated. This process is one of the main emitters of soot, Volatile Organic Compounds (VOCs) and greenhouse gases within
15
the refinery. Our previous study showed that flaring activities at MHR can contribute to the total SO2levels at the supersites, in the present investigation we are interested to know if flaring also contributes to ozone levels. Tula refinery has three elevated flares and some ground flares, but in this work the focus is on elevated flares. In order to rep-resent flaring activities, the emission rates of some combustion by-products are based
20
on our previous study (Almanza et al., 2012). Briefly, the flame of an equivalent ele-vated flare representing sour gas flaring emissions from the refinery is modeled with a CFD combustion code. This simulation considers the interaction of the flame with the crosswind. The emission rates of some combustion species are estimated from the transient simulation. At this stage, only the emission rates of acetylene, ethylene
25
and NOx, are used to account for Highly Reactive VOCs (HRVOCs). Differences in
ACPD
13, 26579–26625, 2013External industrial sources on the air quality of Mexico
V. H. Almanza et al.
Title Page
Abstract Introduction
Conclusions References
Tables Figures
◭ ◮
◭ ◮
Back Close
Full Screen / Esc
Printer-friendly Version Interactive Discussion
Discussion
P
a
per
|
D
iscussion
P
a
per
|
Discussion
P
a
per
|
Discuss
ion
P
a
per
|
instance, ethylene from petrochemical industrial facilities can lead to high ozone when meteorological conditions are favorable (Wood et al., 2012). However, a comprehensive simulation accounting for more species is beyond the scope of the present investiga-tion.
WRF-Chem results suggest that during the simulation period, a contribution from
5
MHR flaring activities to the regional ozone levels is feasible (Fig. 8b), higher in the north region of the basin. It can represent up to 30 % of the maximum contribution from TIC and slightly higher at the outskirts. Figure 9 shows the estimated ozone concentra-tion at the T1 supersite from flaring activities at MHR (green), where the highest contri-bution on 25 March is the result of a direct impingement of the ozone plume. However,
10
this estimate is subject to the uncertainty of the emission rates from the combustion model, mainly the gas composition (0.7 mass fraction of methane, 0.2 of hydrogen sul-fide and 0.1 of nitrogen) and the chemical mechanism (only C1–C3 hydrocarbons). For instance, according to the national emissions inventory, the average emission rate for ethylene in the corresponding grid cell for Tula in the simulation domain is of 0.11 g s−1; 15
whilst the estimate of the combustion model is 20 g s−1for the three flares at MHR. In
this respect, Wood et al. (2012) estimates about 13 g s−1of ethylene from a flare in the
Houston area assuming only ethylene as the vent gas. They apply a correction factor to the reported emission rate of 0.45 g s−1. This rate is similar to the one reported in the
Mexican emissions inventory of 2006. Thus, underestimation in reported VOCs
emis-20
sion rates in Tula region is likely and perhaps influenced by assuming high combustion efficiency. As a result, the potential contribution from TIC to regional ozone levels could
be higher. The combustion efficiency in an open flame is affected by the crosswind
velocity so that higher wind velocities can result in higher emissions of VOCs. In addi-tion, an important factor not considered at all, is the frequent flame shifts resulting from
25
ACPD
13, 26579–26625, 2013External industrial sources on the air quality of Mexico
V. H. Almanza et al.
Title Page
Abstract Introduction
Conclusions References
Tables Figures
◭ ◮
◭ ◮
Back Close
Full Screen / Esc
Printer-friendly Version Interactive Discussion
Discussion
P
a
per
|
D
iscussion
P
a
per
|
Discussion
P
a
per
|
Discuss
ion
P
a
per
|
Regarding the episodic event from Tizayuca (Sect 3.2.1), an important implication related to flaring is that aside from a direct impact in air quality of surrounding regions in terms of SO2, potential emission events from TIC can influence ozone levels as
well. For instance, Murphy and Allen (2005), Nam et al. (2008), and Webster et al. (2007) have demonstrated that episodic events from petrochemical activities promote
5
high ozone levels in the Houston area. In Tula, Rivera et al. (2009) measured high emission rates of SO2 in the TIC of about 12.4 kg s−1 on 26 March, which could be
related to an emission event. Thus, episodic events at TIC are likely and could increase the contribution to both the MCMA and southern Hidalgo ozone levels.
Although the estimated combustion rates can be overestimated, the potential
contri-10
bution from TIC to the regional ozone levels is indicated. In addition, ozone contribu-tions from different flaring activities by the oil and gas industry in Mexico are feasible.
At present, a series of technological changes are undergoing in Tula refinery partly motivated by the construction of a new refinery in the area by 2017 (New Bicentenario Refinery, NBR). All distillation products will have ultra-low sulfur specifications. When
15
both refineries are fully operated, this could potentially impact the air quality, agriculture production, human health, and natural resources on both local and regional scales. For this reason, additional simulations are conducted in order to have a first estimate of the changes in regional SO2 levels. The modeling period includes a cold surge, a
repre-sentative meteorological condition when the TIC emissions are favored to transport to
20
the MCMA (Fast et al., 2007).
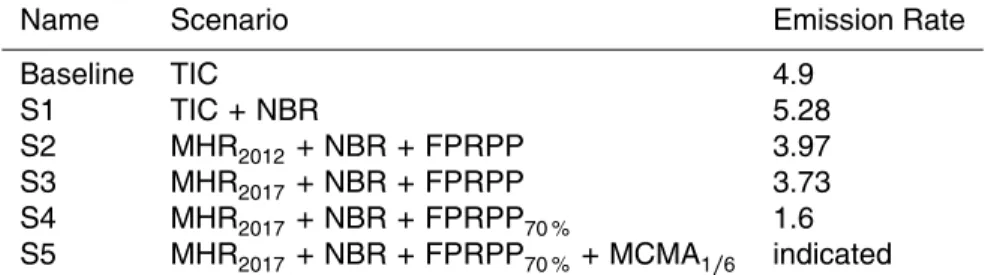
Five scenarios involving the MHR, FPRPP, NBR and local urban sources within the MCMA are considered. The emission rate for TIC is set as suggested by measurements during MILAGRO campaign (Rivera et al., 2009). The proportion of the refinery (38 %) and the power plant (62 %) to the total TIC emission rate is based on studies by Instituto
25
ACPD
13, 26579–26625, 2013External industrial sources on the air quality of Mexico
V. H. Almanza et al.
Title Page
Abstract Introduction
Conclusions References
Tables Figures
◭ ◮
◭ ◮
Back Close
Full Screen / Esc
Printer-friendly Version Interactive Discussion
Discussion
P
a
per
|
D
iscussion
P
a
per
|
Discussion
P
a
per
|
Discuss
ion
P
a
per
|
changes in both the existing refinery and the power plant. The second scenario (S2) considers just the reductions in MHR for year 2012 as conducted by PEMEX. These include processes improvement, fuel substitution, and plants optimization. Emissions from the power plant remain unchanged. The third scenario (S3) is similar to S2, but the reductions in MHR consider further technological improvements for year 2017. The
5
fourth scenario (S4) is similar to S3 but takes a 70 % reduction for the FPRPP assuming transition from heavy fuel oil to natural gas consumption. This scenario is based on past mitigation strategies undertaken at two power plants within the megacity. The Valle de Mexico and Jorge Luque Power Plants began a gradual substitution of fuel oil with natural gas in 1986 and completed in 1992. By 2000, diesel with sulfur content of
10
0.05 % was adopted in place of heavy fuel oil (Molina et al., 2004). Finally, the fifth scenario (S5) takes S4 and assumes a global reduction of urban sources emissions of about one sixth of the current value. This aims to represent full transition to ultra-low sulfur fuels within the MCMA which can be provided by the new refinery. Nowadays, there are ultra-low sulfur fuels in the MCMA, but not all the fleet is using them. Thus,
15
the aim of this scenario is limited to represent wider adoption of high quality fuels, not its introduction. Point sources within the MCMA remained unchanged.
The results from WRF-Chem modeling are presented in Fig. 10. It shows the vari-ation on average model concentrvari-ation with respect to the baseline case (no changes) for each scenario. Observations from 23 RAMA monitoring stations covering the five
20
main regions of the city plus measurements at the two MILAGRO supersites are used for this purpose: Vallejo (VAL), Tacuba (TAC), Enep–Acatlán (EAC), Tlalnepantla (TLA), Tultitlán (TLI), Atizapán (ATI), Los-Laureles (LLA), La-Presa (LPR), La-Villa (LVI), San-Agustín (SAG), Xalostoc (XAL), Aragón (ARA), Villa-de-las-Flores (VIF), La-gunilla (LAG), Merced (Mer), Hangares (HAN), Santa-Ursula (SUR), Pedregal (PED),
25
ACPD
13, 26579–26625, 2013External industrial sources on the air quality of Mexico
V. H. Almanza et al.
Title Page
Abstract Introduction
Conclusions References
Tables Figures
◭ ◮
◭ ◮
Back Close
Full Screen / Esc
Printer-friendly Version Interactive Discussion
Discussion
P
a
per
|
D
iscussion
P
a
per
|
Discussion
P
a
per
|
Discuss
ion
P
a
per
|
On average, S1 results in an increase of 2 %; whilst S2, S3, S4 and S5 results in a decrease of−7.31 %,−9.07 %,−24.36 % and−41.75 % on the average model
con-centration respectively. Thus, the MCMA responds differently to this set of reductions.
The upper half of the basin is more sensitive to regional reductions, whilst the lower half is more sensitive to local reductions. Regional reductions have a greater influence
5
when the power plant is included, partly explained by its higher proportion in the to-tal TIC emissions (62 %). In addition, plume impingements are favored with northerly winds, so that external emissions contribute mostly to the concentration peaks and much less to the diurnal cycle. This can explain the greater influence of local urban reductions in the lower part of the basin. Karydis et al. (2011) found that a 50 %
re-10
duction of SO2results in a 10 % reduction of sulfate in the MCMA and of 25 % in Tula. Therefore, in terms of SO2 levels a combination of reductions in the emissions of the
external sources and local urban sources within the basin could have more benefits than separate reductions.
At the same time, emissions of NOx and VOCs will also decrease as a result of
15
these technological changes. These emissions reductions could impact regional ozone levels. However, no simulations are included in this respect in the present study. Ozone formation under different reduction scenarios in both local and regional scales has
been conducted. For instance, Zavala et al. (2009) showed that model sensitivity to reductions in mobile sources could increase ozone levels in the MCMA. Zhang and
20
Dubey (2009) found that nighttime ozone levels increase with simultaneous reductions of NOx and VOCs with negligible effect on peak levels. Song et al. (2010) studied
the influence of net photochemical formation rates, radical primary sources and NOx oxidation rates on the VOCs and NOx reductions. They found that the urban region
of the MCMA is VOC-limited while rural areas and mountain regions are NOx-limited
25
and dependent of meteorological conditions. Thus, an increase in ozone peaks in the MCMA as a result of emissions reductions is likely in the MCMA.
ACPD
13, 26579–26625, 2013External industrial sources on the air quality of Mexico
V. H. Almanza et al.
Title Page
Abstract Introduction
Conclusions References
Tables Figures
◭ ◮
◭ ◮
Back Close
Full Screen / Esc
Printer-friendly Version Interactive Discussion
Discussion
P
a
per
|
D
iscussion
P
a
per
|
Discussion
P
a
per
|
Discuss
ion
P
a
per
|
secondary at present (with respect to their amount of total emissions), could become more relevant in the external emissions to the megacity in the mid- to long-term.
4 Conclusions
This study investigates the influence of regional external sources on the air quality of the Mexico megacity. An SO2 episodic event is identified on 24 March during
MI-5
LAGRO campaign, which started in the early morning and lasted for about 9 h. The estimated emission rate is remarkably high, about 2 kg s−1. The event covered T1
su-persite and the northeast region of the basin. The peak cannot be reproduced in the WRF-Chem simulations even when including multi-scale nudging. Back trajectories analyses suggest that the event originated in Tizayuca region, implying that important
10
emission sources can be overlooked if relying only in those from TIC, so that potential non-reporting or under-reporting of industrial emissions is feasible.
Since industrial activity in Tizayuca is developing at a relatively fast pace, its con-tribution to future air quality studies can be important. In this respect, the concon-tribution from cement plants is also investigated. Results suggest that this industry could have
15
an important contribution to the SO2air pollution of Mexico megacity even though their total emissions are three times lower than the refinery and the power plant together. It is observed that if northerly wind splits around Sierra de Guadalupe, transport of ce-ment emissions farther into the basin are favored, in particular central and southeast regions.
20
The influence of the Tula Industrial Complex in regional ozone levels is also investi-gated. The contribution to the MCMA is rather low, up to 4 ppb (CUA); whereas in the outskirts, around T1 and at T2 supersite, it can contribute 5 ppb to 6 ppb. Nevertheless, in the upper part of the northwest region of the MCMA and in the southwest and south-southeast regions of State of Hidalgo, the contribution could be about 10 ppb according
25
ACPD
13, 26579–26625, 2013External industrial sources on the air quality of Mexico
V. H. Almanza et al.
Title Page
Abstract Introduction
Conclusions References
Tables Figures
◭ ◮
◭ ◮
Back Close
Full Screen / Esc
Printer-friendly Version Interactive Discussion
Discussion
P
a
per
|
D
iscussion
P
a
per
|
Discussion
P
a
per
|
Discuss
ion
P
a
per
|
A first estimate of the contribution from flaring activities from Tula refinery is pre-sented. The emission rates of acetylene, ethylene and NOxare estimated with a CFD
combustion code. Results suggest that up to 30 % of total TIC’s contribution to regional ozone could be related to flaring activities. However, this requires more research since uncertainties in the combustion model can lead to overestimated emission rates.
Nev-5
ertheless, the result suggests that official reported rates could be underestimated and
possibly are assuming high combustion efficiencies. Thus, contribution from flaring
ac-tivities can be significant. In addition, episodic events could produce even more ozone in a regional scale, which in turn can be transported to the MCMA under appropriate meteorological conditions.
10
Finally, a brief discussion of the influence of undergoing technological changes on SO2levels is presented. Based on these results, it is apparent that the upper half of the
basin is more sensitive to reductions in external sources, whilst the lower half is dom-inated by reductions in local sources. This suggests that a combination of emissions reductions can have greater benefits on the regional SO2air quality. However, it could
15
also result in higher ozone levels at the same time. Since this study covers only one week simulation, further research incorporating cost-effectiveness of reductions within
a multi-pollutant framework and using longer simulation periods is needed. Neverthe-less, potential changes in the regional emission dynamics after the major external point sources reduce their emissions are likely.
20
Acknowledgements. Victor Almanza would like to thank Ed Scott Wilson Garcia for his help with MPICH, Moises Magdaleno for his support with IMPei, Miguel Zavala for his suggestions and discussions, Todd and Marilyn Nicholas for their recommendations and the IMP and CONACYT for their support. Jerome Fast was supported by the US Department of Energy’s Atmospheric System Research Program under Contract DE-AC06-76RLO 1830 at PNNL. L. Molina and G. 25
ACPD
13, 26579–26625, 2013External industrial sources on the air quality of Mexico
V. H. Almanza et al.
Title Page
Abstract Introduction
Conclusions References
Tables Figures
◭ ◮
◭ ◮
Back Close
Full Screen / Esc
Printer-friendly Version Interactive Discussion
Discussion
P
a
per
|
D
iscussion
P
a
per
|
Discussion
P
a
per
|
Discuss
ion
P
a
per
|
References
Allen, D., Murphy, C., Kimura, Y., Vizuete, W., and Edgar, T.: Variable Industrial VOC Emissions and their impact on ozone formation in the Houston Galveston Area, Draft Progress Report Texas Environmental Research Consortium Project H-13, 2004.
Almanza, V. H., Molina, L. T., and Sosa, G.: Soot and SO2 contribution to the supersites in 5
the MILAGRO campaign from elevated flares in the Tula Refinery, Atmos. Chem. Phys., 12, 10583–10599, doi:10.5194/acp-12-10583-2012, 2012.
Bei, N., Lei, W., Zavala, M., and Molina, L. T.: Ozone predictabilities due to meteorological uncertainties in the Mexico City basin using ensemble forecasts, Atmos. Chem. Phys., 10, 6295–6309, doi:10.5194/acp-10-6295-2010, 2010.
10
Butler, T. M. and Lawrence, M. G.: The influence of megacities on global atmospheric chemistry: a modeling study, Environ Chem, 6, 219–225, doi:10.1071/EN08110, 2009.
Butler, T. M., Stock, Z. S., Russo, M. R., Denier van der Gon, H. A. C., and Lawrence, M. G.: Megacity ozone air quality under four alternative future scenarios, Atmos. Chem. Phys., 12, 4413–4428, doi:10.5194/acp-12-4413-2012, 2012.
15
Centro Mario Molina: Proyecto de Investigación para la Valoración de Aspectos Ambientales Críticos en el desarrollo de Infraestructura de Refinación. IV, Programa de Gestión Ambiental y Social, 2010.
Chen, F. and Dudhia, J.: Coupling an advanced land-surface/hydrology model with the Penn State/NCAR MM5 modeling system. Part I: Model description and implementation, Mon. 20
Weather Rev., 129, 569–585, 2001.
Chen, S. H. and Sun, W. Y.: A one-dimensional time dependent cloud model. J. Meteor. Soc. Jpn., 80, 99–118, 2002.
Chow, J. C., Watson, J. G., Edgerton, S. A., Vega, E., and Ortiz, E.: Spatial differences in outdoor PM10 mass and aerosol composition in Mexico city, J. Air Waste Manage. Assoc., 25
52, 423–434, 2002.
de Foy, B., Lei, W., Zavala, M., Volkamer, R., Samuelsson, J., Mellqvist, J., Galle, B., Martínez, A.-P., Grutter, M., Retama, A., and Molina, L. T.: Modelling constraints on the emis-sion inventory and on vertical disperemis-sion for CO and SO2 in the Mexico City Metropolitan Area using Solar FTIR and zenith sky UV spectroscopy, Atmos. Chem. Phys., 7, 781–801, 30