ISSN 1945-5488
© 2009 Science Publications
Corresponding Author: James E. Larsen, Department of Finance and Financial Services, Raj Soin College of Business, Wright State University, Dayton, Ohio 45345 Tel: (937) 775-2870 Fax: (937) 554 3545
The Importance of Police Performance as a Determinant of
Satisfaction with Police
1
James E. Larsen and
2John P. Blair
1
Department of Finance and Financial Services, Raj Soin College of Business,
Wright State University, Dayton, Ohio 45345
2
Department of Economics, Raj Soin College of Business,
Wright State University, Dayton, Ohio 45345
Abstract:Problem statement: Citizen satisfaction with police performance is an important concern of public managers because police performance is central to citizens and accounts for a large share of urban budgets. Also, there is substantial disagreement in the literature regarding determents of citizen satisfaction. Approach: Logistic regression was used to investigate the results of three public opinion surveys, conducted biannually, to identify determinants of citizen satisfaction with police. Results: The explanatory power of the models was indicated by concordance of over .80. The findings indicated that satisfaction was largely determined by citizen perception of police behaviors. Four variables reflecting perceptions of police performance were particularly important: Response time to a crime in progress, visibility on the street, the quality of the relationship between the police and community and police efforts to reduce crime, indicating a chi square significance of <0.001. Almost all demographic and other individual factors, as well as subjective measures of crime severity in the respondent’s neighborhood were insignificant or less important. Conclusion/Recommendations: The findings suggested that public officials could improve citizen satisfaction by focusing on specific aspects of police behavior. Training programs should be oriented accordingly. Further research regarding how citizens interpret certain words, gestures, postures, or other behaviors by police promises to enhance satisfaction.
Key words: Logistic regression, police performance, satisfaction, survey
INTRODUCTION
Police service is one of the most high profile activities provided by municipalities. It accounts for a large percentage of local budgets and citizens typically place high values on police services. Furthermore, police/citizen tensions occasionally become political flash-points, particularly in minority communities. Because of the importance of police services to a well functioning city, a substantial literature evaluating these services has emerged. An important branch of this literature uses survey data to identify variables associated with citizen satisfaction with police. Satisfaction surveys attempt to measure perceptions of actual performance against expectations about what performance should be[7]. Roch and Poister[26] assert that when expectations and perceptions align, satisfaction is likely to be high. To the extent that policymakers seek to satisfy citizens, the results of citizen surveys provide important evaluative insight. Measures of public satisfaction with police are
also important because perceptions of police affect the nature of citizen cooperation[31].
Literature review: There have been numerous studies of survey data regarding citizen attitudes towards police. The factors examined include a plethora of demographic variables and other individual attitudes, neighborhood characteristics including measures of disorder, citizen’s perceptions of police performance and the nature of contact between police and respondents.
A variety of respondent demographic variables have been found to be associated with attitudes towards police. Unfortunately, such findings are of limited prescriptive value for policymakers because there is little, if anything, they can do to control factors such as the population’s age, gender or race. One of the most replicated findings is that African Americans are less satisfied with police services than other groups, particularly Whites. Thomas and Hyman[32] concluded that race was the best predictor of satisfaction in their sample. This finding has been widely replicated under a variety of circumstances and additional studies have shown that other minorities such as Latinos and Asians also expressed relatively low satisfaction with police services. For example, Cheurprakobkit[4] and Tuch and Weitzer[33] concluded that Hispanics view police services more favorably than Blacks, but still less favorably than Whites. However, in Detroit, where Whites were a minority, Frank, Brandl and Cullen[10] found that African Americans had a more favorable regard for police than Whites. Minority status may be associated with political alienation, which may explain why minority status is associated with low regard for police. Not surprisingly, the relationship between satisfaction and race appears to depend upon the situation. Kusow, Wilson and Martin[19] and Skogan[28], for example, found that race was insignificant when other contextual variables were included in their models.
Age and gender have also been studied extensively. Many studies, including ones conducted by Sampson and Bartusch[27], Kusow, Wilson and Martin[19] and Correia, Reisig and Lourich[6], indicate that older persons view police more favorably than younger persons. A few studies, however, including Cao, Frank and Cullen[3] did not find age to be important. Findings regarding the impact of gender also differ. Some researchers, including Cao, Frank and Cullen[3] found females to be more positively disposed toward the police compared to males, but others including Correia, Reisig and Lourich[6] found the opposite.
Citizen socio-economic status has also been studied, but the nature of the relationship between these variables and satisfaction with police is ambiguous, often depending on what other variables are considered.
Several researchers, including, Hagan and Albonetti[12] and Brown and Coulter[2] concluded that people with lower incomes rate police less favorably than those with higher incomes. A few studies, however, found a negative association between income and favorable opinions of police[36] and others found no significant relationship[6,22].
Individual attitudinal characteristics also have been shown to influence satisfaction with police. Hindelang[14] found that Republicans held more favorable attitudes towards police than Democrats, a proposition confirmed by Zamble and Annesley and Vaughn[35]. Perhaps these findings reflect poles on an authoritarian/antiauthoritarian continuum. Several researchers, including Kusow, Wilson and Martin[19] and Priest and Carter[23], found that fear of victimization was associated with negative attitudes towards police. Perhaps respondents felt that police were not doing a good job of protecting them and so had more negative attitudes, although this conclusion should be considered tentative.
Another individual characteristic is the degree to which the respondent is connected to the community. Social capital is identified by networks of individuals bound by trust, reciprocity and civic engagement. MacDonald and Stokes[20] measured social capital by respondent’s answers to a questionnaire about trust in neighbors and civic participation. They concluded that respondents with high levels of social capital tended to trust police more than individual who appear to be isolated from neighbors. They also found that lack of social capital in Black neighborhoods may partially explain the greater distrust of police among Blacks. Similarly, Jesillow, Neyer and Namazzi[17] found that people who participated in neighborhood programs such as neighborhood watch had more positive attitudes towards police.
although there does not appear to be a consensus on this point. It is difficult to draw generalizations about neighborhoods, however, since people tend to cluster in neighborhoods with residents who have similar individual characteristics. Thus, the significance of neighborhood may simply reflect underlying demographic features[35,36]. Brown and Benedict[1] summarized findings regarding neighborhood differences in attitudes towards police: “…indicate that infinite combinations of variables…affect neighborhood differences in perceptions of police”.
The extent of police related pathologies, normally experienced by residents in their neighborhood, is another potential determinant of satisfaction with police. Cao, Frank and Cullen[3] found that perceptions of neighborhood disorder and incivility have significant ability to explain citizen satisfaction with police. This finding suggests that citizen perception of police related conditions in their neighborhoods will be critical in the formulation of an individual’s satisfaction level. Similarly, researchers have concluded that residents who believe neighborhood crime rates are high had negative police evaluations[25]. Since “order” is an important policing outcome, some neighborhood findings are consistent with the idea that citizens evaluate police based upon perceptions of police related outcomes.
Consequences of police activity such as low neighborhood crime or arrest rates are distinct from perceptions of how citizens perceive police performance. Police could be performing well and still face high crime levels. Police performance is an important variable in many satisfaction studies and is one factor over which policymakers and individual officers have a high level of control. Cheurprakobkit and Bartsch[5] examined the importance to citizens of three aspects of police performance: (1) Friendliness as measured by questions on politeness, friendliness and putting one at ease, (2) Professional conduct factors as indicated by questions on honesty, professional knowledge, professional conduct, service quality and fairness, (3) Crime control/prevention as indicated by fighting crime, preventing crime and protecting citizens. They also rated citizen’s satisfaction for each variable so the measures could be ranked according to both satisfaction and importance. They found that crime control/prevention outcomes were most important to the respondents, but citizens were least satisfied with variables in this category. “Friendliness factor” variables were least important but scored well on the satisfaction scale.
Perceptions of performance formed through direct police contact have a strong influence on attitudes[17,24].
Not surprisingly, contacts in which individuals believe they have been mistreated are associated with lower levels of satisfaction. Contacts in which the police have been helpful or courteous are associated with high levels of satisfaction[11]. Similarly, individuals who initiated police contact tend to view police more favorably than individuals who were contacted by the police[4].
In his analysis of satisfaction with police encounters, Skogan[29] concluded that performance at the scene influenced citizen satisfaction regardless of whether police or citizens initiated the contact. Further he found that the manner in which police behaved during encounters swamped many demographic effects: “by-and-large, the actions and demeanor of police on the scene accounted for most of the differences in satisfaction associated with age, race and language” identified in other studies. Important attributes of police behavior found by Skogan included citizen perceptions that police paid attention to what they said, behaved politely, were helpful, responded quickly and were fair. Except for the importance of helpfulness (helpfulness was strongly significant) important performance variables reflected whether citizens believed the police behaved professionally, treated them with respect and cared about the resolution of the incident. Because most citizens have police encounters only occasionally, Skogan’s findings raise an important question regarding the determinants of general citizen satisfaction: will perceptions regarding police performance translate into higher levels of satisfaction among the general citizenry?
Summarizing a comprehensive literature review of attitudes towards police, Brown and Benedict[1] concluded that there has been a “lack of consensus” regarding key variables that determine public perceptions of police. Three important factors may contribute to the lack of scholarly consensus: (1) The vagaries of local data availability, (2) Changing attitudes among citizens and (3) Inconsistencies regarding methodology and model specification. Problems of local availability are well known to researchers and have made replications of other research difficult. Issues of changing attitudes and methodology warrant brief elaboration.
observers including Tuch and Weitzer[33], found that attitudes towards police are affected, at least in the short-run, by high profile instances of alleged police misconduct such as the Sean Bell, Abner Louima, or Mark Ferman incidents and when such incidents occur in media centered cities such as New York and Los Angles public opinion about police is likely to be adversely affected nationwide. Consequently, time consistency will be an important attribute of any model.
Results of some previous research may also be inconsistent due to multicolinearity. Many of the variables that have been used to explain citizen perceptions tend to be highly correlated, so variables may be “statistically significant” depending upon what other control variables are included or excluded. Theory regarding factors that determine attitudes towards police is inadequate and provides scant guidance as to which variables should be included in models. Consequently, a consensus about how to conceptualize the important determinants of citizen satisfaction with police has yet to emerge.
In light of previous research, this study tests the following hypotheses:
Ho : Citizen’s perception of police performance is more important than demographic or other individual characteristics, neighborhood factors and perceptions of police related disorder in determining citizen satisfaction with police services
Ho: The importance of police performance in explaining satisfaction with police services will be consistent over time
MATERIALS AND METHODS
Data for this study was derived from responses obtained from randomly selected adults living in Dayton, Ohio to a bi-annual public opinion survey conducted in 2001, 2003 and 2005. Telephone interviews were administered by professional interviewers at the Center for Urban and Public Affairs Office at Wright State University on behalf the City of Dayton, Ohio. While each survey contained over 120 questions covering a host of local issues, the present study focuses on questions pertaining to the respondent’s satisfaction with Dayton City police services. The questions for each of the three surveys are very similar and the wording of questions examined in this study are identical, so it is possible to compare the findings. The multi-year comparison provides an opportunity to determine whether the results are
transitory or consistent over time, providing a unique feature of this study.
The data enables consideration of a wide variety of variables found to be significant predictors of satisfaction in previous studies. The data represent responses from a single policing jurisdiction, so inter-jurisdictional differences in citizen satisfaction with police services cannot be tested. This aspect of the data, however, eliminates variation in satisfaction that may result from differences in factors such as police training, tax rates, dejure law enforcement procedures and levels of other public services.
The measure of police satisfaction, used as the dependent variable in this study, is based on responses to the survey question, “How satisfied are you with police services?” To operationalize responses, the values 4, 3, 2 and 1 were assigned to the variable PSAT, to reflect a response of “very satisfied,” “somewhat satisfied,” “somewhat dissatisfied,” and “very dissatisfied,” respectively. A statistical summary of PSAT is provided on the first numerical line of Table 1 and the independent variables are summarized on subsequent lines of the table. The 2005 survey included responses from 1,654 individuals and respondents to the 2003 and 2001 survey numbered 1,539 and 1,350, respectively. The statistical analysis, however, is limited to participants who provided responses to all the questions of interest. Specifically, the data presented is limited to the 1,184, 968 and 780 respondents who provided full data in 2005, 2003 and 2001, respectively. The mean satisfaction values for PSAT (3.182 in 2005, 3.045 in 2003 and 3.132 in 2001) suggest that, as a group, the respondents were generally satisfied with police services. This result is consistent with previous studies that show a generally positive attitude towards police.
Table 1: Statistical summary of survey data
2005 2003 2001
--- --- ---
Standard Standard Standard
Variable Description Mean deviation Mean deviation Mean deviation
PSAT How satisfied are you with police services? 3.182 0.951 3.045 0.865 3.132 0.909
DRUG Is drug sales and/or drug use a problem in your neighborhood? 2.700 1.170 2.416 1.214 2.455 1.216
BURG Is burglary a problem in your neighborhood? 2.495 1.078 2.382 1.124 2.332 1.125
VAND Is vandalism and/or graffiti a problem in your neighborhood? 2.181 1.090 2.010 1.124 2.065 1.107
LOUD Are cars or pedestrians with load radios a problem in your 2.453 1.144 2.395 1.198 2.559 1.170
neighborhood?
TRAF Is traffic a problem in your neighborhood? 2.122 1.121 2.059 1.158 2.121 1.146
PROS Is prostitution a problem in your neighborhood? 1.625 1.625 1.452 0.936 1.447 0.913
JUVI Is juvenile crime (menacing and uncivil juveniles) a problem 2.130 1.120 2.035 1.165 2.175 1.154
in your neighborhood?
RESP How satisfied are you with the response time of police officers 2.955 1.031 2.778 0.979 2.810 1.041 to a crime in progress?
VIS How satisfied are you with how often you see police 2.944 1.023 2.903 0.939 3.024 0.954
officers on the street?
EFFO How satisfied are you with the Police Department’s efforts 2.954 0.958 2.929 0.832 2.960 0.863
to reduce crime?
RELA How would you rate the relationship between the Dayton 2.532 0.866 2.557 0.851 2.508 0.819
police and the community?
FAIR Do you think the Dayton police are generally fair in their 0.721 0.449 0.767 0.423 0.726 0.446
dealings with people?
SAFE How safe do you feel in your neighborhood during evening 2.852 0.937 2.973 0.868 2.929 0.833
hours?
WHTE Caucasian 0.502 0.500 0.466 0.499 0.502 0.500
BLAK African-American 0.414 0.493 0.440 0.497 0.393 0.489
MARR Married 0.447 0.497 0.415 0.493 0.374 0.484
OWN Homeowner 0.696 0.460 0.661 0.473 0.644 0.479
MALE Male 0.368 0.482 0.352 0.478 0.362 0.481
LINC Annual income >$25,000 0.363 0.481 0.333 0.471 0.306 0.461
HINC Annual income <$75,000 0.106 0.308 0.091 0.288 0.066 0.248
NODP No high school diploma 0.137 0.344 0.170 0.376 0.145 0.352
DEGR College degree 0.248 0.432 0.218 0.413 0.206 0.405
AGE Respondent’s age? 52.603 17.809 50.541 18.525 48.531 17.228
HELP Have you or your family received from a priority board site 0.064 0.245 0.220 0.414 0.224 0.430
in the past 12 months?
SCAP Social capital index 8.732 2.870 8.359 2.794 8.520 2.931
CONT Have you or any household member had contact with any 0.423 0.494 0.431 0.495 0.461 0.499
Dayton police officer for any reason in the last 12 months?
TRAF Traffic stop 0.011 0.107 0.011 0.105 0.014 0.117
ASST Assisted by an officer 0.037 0.190 0.053 0.225 0.016 0.126
VICT Victim of a crime 0.071 0.257 0.057 0.232 0.028 0.166
QUES Questioned by Police 0.013 0.112 0.019 0.136 0.016 0.126
SOCL Socially nature of contact 0.080 0.272 0.072 0.259 0.051 0.219
REPT Reported a crime 0.141 0.348 0.140 0.347 0.189 0.392
Another individual level variable is a measure of the respondents’ social capital. SCAP is an index number constructed by the authors and designed to measure the extent of the respondent’s social connectivity to the neighborhood and community. Previous literature suggests a positive relationship between a respondent’s SCAP and satisfaction with police.
Other independent variables in the study include eight which indicate the respondent’s perception of the severity of neighborhood disorder. Survey participants were asked to rate how severe a problem they believed each of the following activities is in their neighborhood: drug sales/use, burglary, vandalism/graffiti, loud radios,
positive(respondents who perceive no problem have high police satisfaction levels) if respondents view the police as an important reason the criminal activity is not a problem in their neighborhood and, therefore, express satisfaction with police service. Alternatively, the relationship may be negative (respondent’s may express satisfaction with the police despite the problem) if the respondent also perceives that police are making a good effort at combating the criminal activity.
The eighth disorder variable, SAFE, was created to capture responses to the question, “How safe do you feel in your neighborhood during evening hours?” SAFE was coded as 4, 3, 2 or 1, given a response of “very safe,” “safe,” “unsafe,” and “very unsafe,” respectively. A priori, we would expect that satisfaction with police service would be positively related to SAFE.
Five variables examined perceptions of police performance. They were derived from responses to the following questions:
• How satisfied are you with the response time of police officers to a crime in progress?
• How satisfied are you with how often you see police officers on the street?
• How satisfied are you with the Police Department’s efforts to reduce crime?
• How would you rate the relationship between the Dayton police and the community?
• Do you think the Dayton police are generally fair in their dealings with people?
To operationalize responses to the first three questions, the variables RESP, VISI and EFRT were assigned a value of 4, 3, 2 or 1 given a response of “very satisfied,” “somewhat satisfied,” “somewhat unsatisfied,” or “very unsatisfied,” respectively. Identical values were assigned to RELA to reflect responses to the fourth question given a response of “excellent,” “good,” “fair” or “poor,” respectively. The binary variable, FAIR, was assigned a value of 1 to reflect a “yes” response or zero for a response of “no” to the fifth question.
The literature indicates that perceptions of police behavior may depend upon the nature of previous police contact. The binary variable, CONT, was included to determine if respondents with a household member who had recent contact with the police rated the police differently than those who had not had contact. CONT was assigned the value 1 if contact had occurred within the last twelve months and zero, otherwise. Those who had contact were asked to specify the nature of the contact and nine additional
binary variables were created to indicate that the contact resulted from either: Filing a report (REPT), a traffic stop (TRAF), receiving some sort of officer assistance (ASST), being involved in an accident (ACCD), witnessing a crime (WIT), being arrested (ARST), being a crime victim (VICT), being questioned by police (QUES), or if the contact were social in nature (SOCL). We anticipate that contact by itself will not be significant. If the situation is unpleasant for the citizen as in a traffic stop (TRAF) or being arrested (ARST) we anticipate a negative relationship. Positive satisfaction is a more likely outcome if the respondent was assisted by the police (ASST), or the result of social situations (SOCL). Other contact situations might be either positive or negative, depending upon the context.
Finally, seven binary variables (LOC1 through LOC7) representing geographic regions of the City are not shown in Table 1, but were included in the model to control for any variation in satisfaction with police services attributable to differences in the location of the respondent’s residence.
classification table which shows correct and incorrect classifications of the dependent variable. Goodness-of-fit tests such as the likelihood ratio test are available as indicators of model appropriateness, as is the Wald Chi Square statistic to test the significance of individual independent variables.
Preliminary analysis of the data indicated severe multicolinearity between many of the independent variables in our model. The problem of multicolinarity has also plagued previous research. Multicolinarity is probably one of the reasons that some previous research reached inconsistent conclusions. For these reasons the LOGISTIC procedure was employed using the STEPWISE option where we required that a variable be significant at the 5 percent level to enter and remain in the model. The LOGISTIC procedure is applied in three separate iterations to responses received in 2001, 2003 and 2005 to investigate the following model:
11 18 23
1 12 19
29 36
24 30 37
38
PSAT DEMO PRNP PERFORM
CONTACT LOCAT SAFE
SCAP
= Σβ + Σβ + β +
β + β + β +
β + ∈
(1)
Where:
PSAT = The respondent’s satisfaction with police services
β = The maximum likelihood estimators DEMO = A vector of eleven demographic
variables
PRNP = A vector of seven variables indicating perceived severity of neighborhood police related problems
PERFORM = A vector of five variables reflecting perceived police effort and performance, CONTACT = A vector of binary variables indicated the
nature of respondent-police contact, LOCATE = A vector of seven binary variables
indicating the general location of the respondent’s residence
SAFE = An indicator of how safe the respondent feels in their neighborhood at night SCAP = An index reflecting the degree of the
respondent’s social capital/community participation
Є = The error term
RESULTS AND DISCUSSION
The results of the LOGISTIC procedure indicate that each of the three models is a good predictor of satisfaction with police services. One of the quality
measures performed by the LOGISTIC procedure is to use the various dependent variables to predict a respondent’s satisfaction level and then compare the prediction with the respondent’s actual satisfaction level. When the predicted and actual levels are the same, the observation is said to be concordant. In 2005, 85.0% of 457,205 paired comparisons were concordant. In 2003, 85.2% of 305,894 paired comparisons were concordant and in 2001 86.2% of 199,845 paired comparisons were concordant.
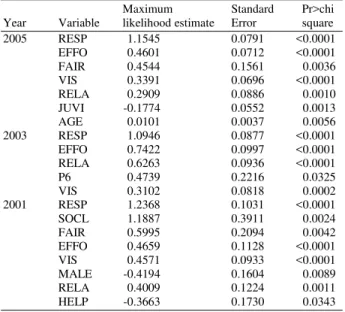
The logit results in Table 2, are shown by year and for each model in order of the absolute value of the variable’s maximum likelihood estimator. Examination of Table 2 shows several important findings. First, the results are similar for each of the three years and the variables with the most explanatory power in each of the models are those which measure the perceived performance of the police. Four of the five variables in this category entered each of the three models: RESP, VIS, RELA and EFFO. FAIR entered the model in both 2001 and 2005. In all three years the sign of each of these variables was positive, indicating that the higher a respondent rated any of these performance variables, the higher was their level of satisfaction with police services.
In each year, the perception of how quickly police responded to a reported crime (RESP) was the variable with the largest impact on satisfaction. In 2005, for example, the maximum likelihood estimator for RESP of 1.1545 indicates that for each unit increase in RESP, the logit will increase by 1.1545, holding everything else constant.
Table 2: Logistic regression results
Maximum Standard Pr>chi
Year Variable likelihood estimate Error square
2005 RESP 1.1545 0.0791 <0.0001
EFFO 0.4601 0.0712 <0.0001
FAIR 0.4544 0.1561 0.0036
VIS 0.3391 0.0696 <0.0001
RELA 0.2909 0.0886 0.0010
JUVI -0.1774 0.0552 0.0013
AGE 0.0101 0.0037 0.0056
2003 RESP 1.0946 0.0877 <0.0001
EFFO 0.7422 0.0997 <0.0001
RELA 0.6263 0.0936 <0.0001
P6 0.4739 0.2216 0.0325
VIS 0.3102 0.0818 0.0002
2001 RESP 1.2368 0.1031 <0.0001
SOCL 1.1887 0.3911 0.0024
FAIR 0.5995 0.2094 0.0042
EFFO 0.4659 0.1128 <0.0001
VIS 0.4571 0.0933 <0.0001
MALE -0.4194 0.1604 0.0089
RELA 0.4009 0.1224 0.0011
Few other variables entered any of the models and none entered more than one model. For example, of the perceptions of Police Related Neighborhood Problems (PRNP), JUVI-“juvenile crime is a problem in the neighborhood,” was the only variable to enter a model and it did so only in 2005. The negative sign on JUVI indicates that the lower the perceived severity of neighborhood juvenile crime, the more satisfied the respondent is with police. MALE and AGE were significant in 2001 and 2005, respectively and the negative sign for MALE and positive sign for AGE are both consistent with the findings of the plurality of previous studies that investigated these variables. Our measure of social capital, SCAP, also entered only the 2001 model. The positive sign on SCAP was as anticipated by MacDonald and Stokes[20]. The results suggest that social capital may not be consistently important, but it warrants further analysis including developing a better set of social capital indicators. Similarly, individuals who had received some sort of assistance from their local priority Board were less satisfied than others with the police service only in 2001.
Taken in their entirety, these findings provide strong support for the principal hypotheses that citizen perceptions of police performance will be major determents of citizen satisfaction.
CONCLUSION
The results of this study strongly support previous research that has pointed towards police performance as being very important in the formulation of citizen satisfaction. In this study, perceptions of response time to a crime in progress, how often police are seen on the street, the relationship between the police and community and police efforts to reduce crime were key performance indicators. These results were relatively consistent over a six year time frame. The consistently significant performance variables reflect perceptions that police are trying to do their job in a professional and diligent way with respect for citizens.
The fact that only one of the seven indicators of neighborhood disorder entered the models is notable. That variable, JUVI, entered only in the 2005 model. Citizens who perceive police related neighborhood problems as significant do not appear to be less satisfied with police services. Similarly, individual demographic and other characteristics were not consistently significant, although a few entered the model occasionally.
The dominance of police performance compared to perceptions of neighborhood disorder in determining
citizen evaluation of police may reflect a sophisticated understanding of what police actions can accomplish in the context of the myriad determinants of crime that include social, economic and even biological influences. The Uniform Crime Report cautions that crime rates “provide no insight into the many variables” that determine crime[34].
Our findings reinforce an existing challenge to policymakers by stressing the importance of focusing on how actual police conduct is translated into citizen perceptions of performance which in turn is reflected in satisfaction. Training programs should continue to emphasize how some behaviors are interpreted. Efforts to understand and explain how certain words, gestures, postures, or other behaviors might be interpreted may improve citizen satisfaction. At the same time, insincere or “mechanical” efforts to influence perceptions may be counterproductive. Certainly we do not suggest distorting effective practices just to enhance perceptions. For instance, we are not suggesting that favorable perceptions of response time be increased by adopting practices that otherwise are inefficient such as sending all available units, sirens blasting, to respond to a minor incident. While this might increase perceptions of response time, it would probably do more harm to the community than good.
Some evaluation research has paralleled the philosophical and ethical debate between deontological and teleological ethics. According to deontological orientation, actions are judged on their intentions. In contrast, teleological orientation places the evaluative emphasis on outcomes. Given this dichotomy, police services can be evaluated on whether they make good faith attempts to address problems as reflected by perceptions of performance and/or whether they actually prevented police related problems as indicated by measures of neighborhood disorder. Our findings suggest that citizens take a deontological orientation when evaluating satisfaction with police services. Perhaps citizens recognize that the extent of neighborhood crime is much less controllable than the ability to respond quickly, make legitimate efforts to reduce crime, develop good community relationships and establish a visible neighborhood presence.
REFERENCES
2. Brown, K. and P.B. Coulter, 1983. Subjective and objective measures of police service delivery. Public Administrat. Rev., 43: 50-58. DOI: 10.2307/975299
3. Cao, L., J. Frank and F.T. Cullen, 1996. Race, community context and confidence in police. Am.
J. Police, 15, 3-22. DOI:
10.1108/07358549610116536
4. Cheurprakobkit, S., 2000. Police-citizen contact and police performance: Attitudinal differences between hispanics and non hispanics. J. Crimin. Just., 28: 325-336. DOI: 10.1016/S0047-2352(00)00042-8
5. Cheurprakobkit, S. and R.A. Bartsch, 2001. Police performance: A model for assessing citizens’ satisfaction and the importance of police attributes.
Police Q., 4: 449-468. DOI:
10.1177/109861101129197941
6. Correia, M.E., M.D. Reisig and N. Lourich, 1996. Public perceptions of state police: An analysis of individual and contextual variables. J. Crimin. Just., 24: 17-28. DOI: 10.1016/0047-2352(95)00049-6
7. Cronin, J.J. and S.A. Taylor, 1992. Measuring service quality: A re-examination and extension. J. Market., 56: 55-68. DOI: 10.2307/1252296 8. Frank, J., S.G. Brandl and F.T. Cullen, 1996.
Reassessing the impact of race on citizens’ attitudes towards police: A research note. Just. Q., 13: 321-334. DOI: 10.1080/07418829600092961 9. Frank, J., B.W. Smith and K.J. Novak, 2005.
Exploring the basis of citizens’ attitudes toward police. Police Q., 8: 206-228. DOI: 10.1177/1098611103258955.
10. Hagan, J. and C. Albonetti, 1982. Race, class and the perception of criminal injustice in America. Am. J. Sociol., 88: 329-355. DOI: 10.1086/227674 11. Hawdon, J., 2003. Police-resident interactions and
satisfaction with police: An empirical test of community policing assertions. Crimin. Just.
Policy Rev., 14: 55-74. DOI:
10.1177/0887403402250919
12. Hindelang, J., 1974. Public opinion regarding crime, criminal justice and related topics. J. Res. Crime Delinquency, 11: 101-116. DOI: 10.1177/002242787401100202
13. Huebner, B.M., J.A. Schafer and T.S. Bynum, 2004. African American and White perceptions of police services: Within and between group variation. J. Crimin. Just., 32: 123-135. DOI: 10.1016/j.jcrimjus.2003.12.003
14. Jesilow, P., J. Meyer and N. Namazzi, 1995. Public attitudes towards the police. Am. J. Police, 14: 67-88. DOI: 10.1108/07358549510102767
15. Kelly, J.M., 2003. Citizen satisfaction and administrative performance measures: Is there really a link? Urban Affairs Rev., 38: 855-866. DOI: 10.1177/1078087403038006005
16. Kusow, A.M., L.C. Wilson and D.E. Martin, 1997. Determinants of citizen satisfaction with police: The effects of residential location. Policing Int. J. Police Strateg. Manage., 20: 655-664. DOI: 10.1108/13639519710192887
17. MacDonald, J. and R.J. Stokes, 2006. Race, social capital and trust in the police. Urban Affairs Rev., 41: 358-375. DOI: 10.1177/1078087405281707 18. Parker, K.D. and A.B. Onyekwuluje, 1995. African
American's attitudes toward the local police: A multivariate analysis. J. Black Stud., 25: 396-409. DOI: 10.1177/002193479502500308
19. Priest, T.B. and D.B. Carter, 1999. Evaluations of police performance in an African-American sample. J. Crimin. Just., 27: 457-465. DOI: 10.1016/S0047-2352(99)00016-1
20. Reisig, M.D. and M.E. Correia, 1977. Public evaluations of police performance: An analysis across three levels of policing. Policing Int. J. Police Strateg. Manage., 20: 311-325. DOI: 10.1108/13639519710169153
21. Reisig, M.D. and A.L. Giacomazzi, 1998. Citizen perceptions of community policing: Are attitudes towards police important. Policing: Int. J. Police Strateg. Manage., 21: 547-61. DOI: 10.1108/13639519810228822
22. Roch, C.H. and T.H. Poister, 2006. Citizens, accountability and service satisfaction: The influence of expectations. Urban Affairs Rev., 41: 292-308. DOI: 10.1177/1078087405281124 23. Sampson, R.J. and D.J. Bartusch, 1998. Legal
cynicism and (subcultural?) tolerance of deviance: The neighborhood context of neighborhood racial differences. Law Soc. Rev., 32: 777-804. DOI: 10.2307/827739
24. Skogan, W.G., 2005. Citizen satisfaction with police services: Individual and contextual effects. Police Stud. J., 7: 469-479. DOI: 10.1111/j.1541-0072.1978.tb01795.x
25. Skogan, W.G., 2005. Citizen satisfaction with police encounters. Police Q., 8: 298-321. DOI: 10.1177/1098611104271086
26. Tyler, T., 2004. Enhancing police legitimacy. Ann. Am. Acad. Polit. Soc. Sci., 593: 84-99. DOI: 10.1177/0002716203262627
27. Thomas, C.W. and J.M. Hyman, 1977. Perceptions of crime, fear of victimization and public perceptions of police performance. J. Police Sci.
Administrat., 5: 305-317.
28. Tuch, S.A. and R. Weitzer, 1997. Trends: Racial differences in attitudes toward the police. Public Opin. Q., 61: 642-663. DOI: 10.1086/297822 29. US Department of Justice, Federal Bureau of
Investigation, 2009. Uniform crime report: crime in the United States. Washington, DC. US
Department of Justice.
http://www.fbi.gov/ucr/ucr.htm
30. Vaughn, M.S., 1996. Police civil liability and the first amendment: Retaliation against citizens who criticize and challenge the police. Crime
Delinquency, 42: 50-75. DOI:
10.1177/0011128796042001004
31. Weitzer, R., 1999. Citizens’ perceptions of police misconduct: Race and neighborhood context. Just.
Q., 16: 819-846. DOI:
10.1080/07418829900094381
32. Weitzer, R., 2000. Racialized policing: Residents’perceptions in three neighborhoods. Law Soc. Rev., 34: 129-155. DOI: 10.2307/3115118 33. Weitzer, R. and S.A. Tuch, 1999. Race, class and
perceptions of discrimination by the police. Crime Delinquency, 45: 494-507. DOI: 10.1177/0011128799045004006