Do Police Reduce Crime? Estimates using the
Allocation of Police Forces after a Terrorist Attack
Rafael Di Tella Harvard Business School
and
May 29, 2003
Abstract
Ernesto Schargrodsky' UTDT
An important challenge in the crime literature is to isolate causal effects of police on crime. Following a terrorist attack on the main Jewish center in the city of Buenos Aires, Argentina, in July 1994, all Jewish institutions (including schools, synagogues, and clubs) were given 24-hour police protection. Thus, this hideous event induced a geographical allocation of police forces that can be presumed to be exogenous in a crime regression. Using data on the location of car thefts before and after the terrorist attack, we find a large deterrent effect of observable police presence on crime. The effect is local, with little or no appreciable impact outside the narrow area in which the police are deployed.
JEL: K42
Keywords: Crime, police, deterrence, natural experiment.
I. Introduction
Classical criminology assumes that criminals are rational beings who weigh the costs and benefits of their actions. Becker (1968) produced the first fully-fledged theory of crime based on rational behavior. His research led to a broad upsurge of articles about the economics of criminal behavior (see, for example, Ehrlich (1973), Witte (1980), McCormick and Tollison (1984), Ehrlich and Brower (1987), Andreoni (1991), Freeman (1996), Levitt (1997), Fajnzylber, Lederman and Loayza (2000), inter alia). One of the
central predictions of Becker' s theory is that crime will decrease when police presence increases. A basic problem with this prediction is that it has largely failed to find empírical support. In a survey of the literature, Cameron (1988) reports that in 18 out of 22 papers surveyed researchers found either a positive effect of police presence on crime or no relationship between these variables. More recent surveys by Marvell and Moody (1996) and Eck and Maguire (2000) reach similar conclusions, 80 percent of analyzed studies showing zero or positive effects of police presence on crime.
There is, however, a serious endogeneity problem with these studies that arises from the simultaneous determination of crime and police presence (see Fisher and Nagin, 1978). It is likely that the govemment of a city in which the crime rate increases will hire more police officers. Areas beset by high crime will thus end up with more police officers than areas with low crime rates, introducing a positive bias in the police coefficient in a crime regression. A central challenge in the crime literature has been to break this endogeneity in order to identify causal effects of police on crime.
strategies depend, crucially, on the assumption that the authorities are unable to forecast crime-fighting needs.'
Levitt (1997) develops a different approach using instrumental variables to break. simultaneity. He documents the presence of an electoral cycle in police hiring and uses the timing of gubematorial and mayoral elections to instrument for police presence in a pane! of 59 large V.S. cities from 1970-1992. Vsing 2SLS techniques, Levitt finds a
negative and significant effect of police on violent crime. The pattem across individual crime categories is surprising, with murder exhibiting the largest (and the only significant) coefficient, and with very imprecise estimates for the categories in which the rational model is presumed to be more relevant (e.g., property crimes). Still, the validity of the instrument might be questioned. The timing of elections may affect crime by way of variables other than the number of police officers on the street. Levitt avoids some of these concems by controlling for the unemployment rate and public spending, although there are other channels through which elections might affect reported crime. Police effort and crime reporting (as well as police hiring) may also respond to the timing of elections, particularly ifthe police are the target ofpolitical manipulation. Similarly, the behavior of judges and prosecutors may be affected by e!ections, something that could logically reduce criminal activity during such times.2
A more severe concem raised by McCrary (2002) is that Levitt's 2SLS estimates suffer from a computational error (see also Levitt's reply (2002)). When the mistak.e is corrected the replication results show no effect of police on crime at standard significance leveis. The state of the evidence leads Levitt (2002) to wonder: "If electoral cycles can provide no more than suggestive evidence of a causal impact of police on crime, are there other identification strategies that can do better?"
1 Criminologists often emphasize the benefits of anticipating crime pattems. Bayley (1998), for example, states "The key assumption behind srnarter law enforcement is that crime is not evenly scattered through time and space. Police are not faced with meeting ali crime threats everywhere all the time. Instead, each forrn of crime displays a particular pattem which, if understood, provides opportunities for law enforcement." (Bayley (1998), page 174). On the allocation ofpolice resources to protect high crime areas. often called "hot spots", see, for example, Sherrnan, Gartin and Buerger (1989), and Sherrnan and Weisburd (1995).
In this paper we present a different approach to estimate the causal effect of police on crime. On July 18, 1994 terrorists exploded a bomb that destroyed the Asociacion Mutual Israelita Argentina (A.M.l.A.), the main Jewish center in Argentina. Eighty-five people died and more than 300 were wounded in the attack. One week later the federal govemment assigned police protection to every Jewish and Muslim building in the country. Because the distribution ofthese institutions can be presumed to be exogenous in a crime regression, this hideous event constitutes a natural experiment whereby the simultaneous determination of crime and police presence can be broken.3
We colIected information on the number ofmotor-vehicle thefts per block in three neighborhoods in Buenos Aires before and after the terrorist attack. The information covers the nine-month period beginning April 1 and ending December 31, 1994. We also colIected information on the location of each Jewish institution in these neighborhoods. We then estimated the effect of police presence on car theft. Our difference-in-differences estimates show that blocks that receive police protection experience significantly fewer car thefts than the rest of the neighborhoods. The effect is large. Relative to the control group, car thefts falI by 75% in the blocks in which the protected institutions are situated. However, the effect is extremely local. We fmd no evidence that police presence in a given block reduces car theft one or two blocks away from the protected buildings.
In addition to the identification approach, our estimates have an important advantage over previous work. The literature reports considerable interest in identifying the mechanisms by which increased police presence reduces crime. Is it that greater numbers of police officers on the streets make criminal activity more risky (deterrence), or perhaps that the more police officers the more criminais are apprehended leaving fewer criminaIs to commit crimes (incapacitation)?4 In general, these two effects are quite difficult to distinguish using aggregate data. Being based on changes in crime levels in particular locations (i.e., the protected blocks) our approach cannot reflect changes in the
J On natural and randomized experiments, see the discussions in LaLonde (1986), Angrist (1990), Angrist
and Krueger (1991), Hamennesh (1999), and Sacerdote (2001).
4 Kessler and Levitt (1999) use Califomia's sentence enhancement laws for a selected group of crimes to
distinguish between incapacitation and deterrence. See also Levitt (1998). Articles studying responses to increases in detection probabilities include Bar-I1an and Sacerdote (2001), on red Iight running violations, and McConnick and Tollison (1984), on fouls committed by basketball players.
numbers of incarcerated criminaIs, which should affect all neighborhood. blocks, not just those containing Jewish institutions. Thus, all the effect of police on crime in our paper derives from deterrence.
The rest of the paper is organized as follows. In the next section we describe our data, while in section III we discuss our empirical strategy. The empirical results are presented in Section IV. Section V concludes.
11. Data Description
On July 18, 1994 a terrorist attack destroyed the main Jewish center (A.M.I.A.) in Buenos Aires, Argentina.5 Seven days later, on July 25, the federal governrnent decided to provide 24-hour police protection to more than 270 Jewish and Muslim institutions (including synagogues, mosques, clubs, cemeteries, and schools) in Argentina. Muslim institutions were protected for fear of potential retaliations after the Islamic organization, Hezbollah, clairned responsibility for the attack. Nearly ten years after the attack this protection is still provided.
A significant proportion of the protected buildings are Jewish institutions within Buenos Aires proper.6 Although providing this surveillance required the distraction of a non-negligible proportion of the police forces protecting the areas in which these buildings are located, the police forces made a serious effort to maintain previous leveIs of police presence in the rest of these neighborhoods. Governrnent officials worried that compromising police protection throughout the neighborhoods might generate in the residents ill feelings towards the Jewish community.7 Because the personnel commitment could not be met with the normal number of police assigned to these neighborhoods, the
5 This was the second terrorist attack in the city of Buenos Aires. The Israeli embassy had been destroyed
on March 17, 1992. In the months immediately following this first attack, the most prominent Jewish centers, including A.M.LA., had been given more attention by officers on patrol. But surveillance was not generalized and dec\ined gradually. Information on these attacks can be found in www.atentado-amia.com.ar, www.daia.org.ar, and www.bnaibrith.org.
6 Approximately 85% ofthe Jewish population ofthe country lives in Buenos Aires and its suburbs.
7 Institutional information for this paper was gathered through a series of interviews with key informants,
increased police presence was achieved with officers reassigned from, for example, administrative tasks at the Central Police Department, the Communications Division, and the Mounted Police.8
The data analyzed in this paper are from three non-contiguous, Buenos Aires neighborhoods that collectively represent about 3.2% of the city's area and account for 6.9% of its population. One police station is located in each neighborhood.9 The neighborhoods were selected on the basis of three criteria: they were the areas with the largest numbers of Jewish institutions in the City;IO significant portions of the neighborhoods were not close to a protected institution (more than 50% of blocks are more than two blocks removed from a protected institution), providing a control group for our study; three was the maximum number of police stations for which we were able to convince police authorities to provide us data. I I There are a total of 876 blocks in these
three neighborhoods. The block constitutes the unit of observation for our study.
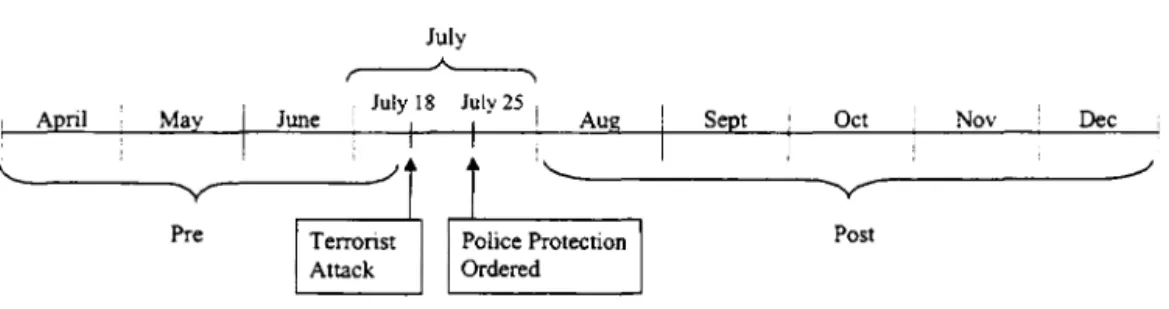
We obtained all the information available to the police (with the exception of the victim's name) about each auto theft in these neighborhoods for the nine-month period starting April 1, 1994 and ending December 31, 1994. Figure 1 presents a timeline ofthe events in our study. April 1 to July 17 constitutes the period before the terrorist attack. The interim period of July 18 to July 31 includes a first week during which surveillance had not yet been introduced and a second week during which police began to implement the protection policy. By the end of the last week of July police protection was fully functioning and known to the publico Finally, August 1 to December 31 covers the period of police protection.
consideration as weIl as a former federal judge, a former federal prosecutor, and the director of a non-governrnental organization devoted to protecting civil rights.
8 For example, more than one third of approximately 200 police officers stationed in Once, one of the neighborhoods with the highest density of Jewish institutions, had to be reassigned to protection duties. The personnel necessary to maintain the previous levei of police presence in the rest of the neighborhood was puIled from outside ofthis police station.
9 There are 53 police stations in Buenos Aires. Pelacchi (2000) provides an in-depth discussion of the institutional features of crime and the police force in Argentina.
lO There are no Muslim institutions in the neighborhoods considered in our study.
11 The police stations' daily records, which record auto-thefts on the same pages as reports of every other type of crime or incident, are not available to the public. The Chief of the Federal Police had to issue a special authorization instructing police station personnel to transcribe the data for uso
Figure 1: Timeline of Events
July
セ@
April May June July 18 I July 25 I i ' Aug Sept Oct Nov Dec
GMMMMMMMセ@ V
'---
'v""" MMMMMMMMMMMMMMMセ@Pre Post
Although victims' tendency to under-report often results in official records underestimating crime leveIs, this is a minor problem for car thefts in Buenos Aires for two reasons. One, police intervention is required to activate car insurance against theft, a type of insurance carried by most car-owners in Buenos Aires (89% according to victimization surveys, see Ministerio de Justicia, 2000). Two, because criminaIs often use stolen cars in the commission of other crimes, victims who report car thefts to police forestalI confusion about their involvement in such crimes. The same victimization study cited above reports that 87% of Buenos Aires car thefts are reported to the police, compared to only 29% for alI types of crime. A further advantage of auto-theft data is that this category of crime is expected to be more sensitive to police presence.12 Most robberies occur after a brief period of surveillance of the intended victim.13 CriminaIs
concentrating their attention on mobile victims might miss the presence of police. Property (e.g., a parked car), on the other hand, being stationary enables criminaIs to gather information on areas in which they intend to commit crimes.
Car theft information obtained from the police includes the address at which the stolen vehicle was parked, make and year of the vehicle, day and time of the report, and whether the robbery was violent. During the period of analysis 794 non-armed car thefts
were reported in these neighborhoods. 14 Although they norrnally occur in the middle of blocks, car thefts in many cases are reported at comers so as to facilitate victims' verbal descriptions of crime locations at the time they file police reports. We assigned one quarter of each car theft reported at a comer to each of the intersection' s four blocks. 15
The completed data set included inforrnation on the geography of these neighborhoods, in particular, the precise location of each Jewish institution. There are 45 protected institutions in this part of the city. Thirty-seven of them are within these neighborhoods, while the rest are near the boundaries (but less than three blocks away).16 The geographical distribution of blocks, institutions, and car thefts is summarized in Table Ai in the Appendix. 17
We measure for each block In our sampie the distance to the nearest Jewish institution, whether or not the building is within our neighborhoods. We distinguish among blocks that contain a Jewish institution, blocks that are one block away from the nearest Jewish institution, and blocks that are two blocks away from the nearest Jewish institution, and compare these with blocks that are more than two blocks away from the nearest Jewish institution.
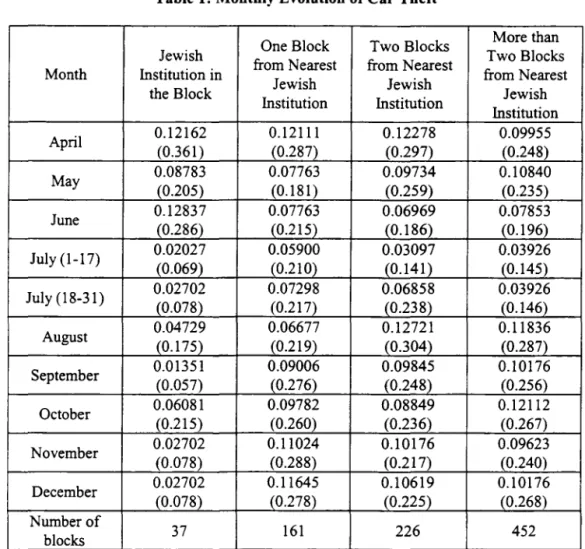
Table i presents means (and standard deviations) of auto thefts for each month for each type of block. The bottom row tallies the number of blocks of each type. For the month of July we consider, separately, the period before and after the terrorist attack. For
14 We exclude a small number (63) ofarmed robberies reported during this period as well as 86 misreports
that correspond to non-existing or incomplete addresses or to car thefts that occurred outside of our sample neighborhoods (i.e., that were reported to the wrong police station).
IS This procedure assigns some fractions of thefts to blocks outside the boundaries of the neighborhoods under study, which reduces the total number of car thefts from 794 to 778.75. With few exceptions, Buenos Aires is a perfect grid city, with streets crossing perpendicularly at comers. Each block is 100 meters (110 yards) long. Measurement error in the dependent variable tends to overestimate the standard errors of the regression coefficients.
16 None ofthe protected institutions in our sample is located at a comer.
17 The lowest levei of aggregation for which population census inforrnation is available in Argentine cities is
census fraetions (fracciones censales), which cover approximately eight to ten contiguous hectares. Using the 1991 census, we compare socioeconomic variables potentially related to crime victimization and car ownership. Tests ofmeans reveal no statistical differences between census fractions that contain and do not contain Jewish institutions along the following dimensions: age and years of education of the household head; percentage of women; percentage of households below the poverty line; percentage of overcrowded households; and home ownership rate. The only dimension along which these census fractions differed was employment rate of the household head: 94.1 and 94.9, respectively, for fractions with and without Jewish institutions. We interpret these results as evidence that the surveillance policy was random1y assigned across socioeconomic characteristics.
the post-July period, the table shows that blocks occupied by a Jewish institution experienced a lower leveI of car thefts than the control group (i.e., blocks more than two blocks away from the nearest Jewish institution). A similar reduction is not observed for blocks that are one or two blocks away from the nearest Jewish institution. In particular, eomparisons of means indicate that average car theft in blocks with protected institutions is significantly less than average car theft for the control group for every month after July, with the exception of October. Although casual inspection of the data for blocks that contain a Jewish institution also suggests a decline for the first days of July (before the attack), the difference with the control group is not statistically significant for this period. Indeed, for every period prior to the terrorist attack we cannot reject that the car-theft mean for the blocks with Jewish institutions is equal to the mean for the control group.
Figure 2 plots the same information at a more disaggregated leveI, namely, by week. The series are obviously more volatile for the aggregates that average a smaller number ofblocks (see the bottom row ofTable 1). The horizontallines represent the pre-and post-attack average leveIs for each block type. Prior to the attack there are no discernible differences in these averages across the different types of blocks. After the attack, however, average car thefts for blocks that eontain Jewish institutions evolve around a lower mean. A verage leveIs of car thefts for the other types of blocks do not seem to change after the attack.
lU. Empirical Strategy
Our purpose is to identify the causal effect of poliee presence on car thefts. Using the total number of car thefts per block during each month from April to December as the dependent variable gives us a panel with nine observations for each block.18 We exclude ear thefts that occurred between July 18 and July 31.19 Controlling for month and individual effects, we obtain the difference-in-differences estimators of the effect of police on crime using the following model:
18 Of course, our monthly leveI of aggregation is arbitrary. We obtain similar results when we aggregate the data, for example, at the weekly leveI. Ali results reported but not presented are available upon request.
where:
Car Theftit
=
ao Same Bloek Polieej , + ai One Bloek Polieej , ++
a
2Two Bloeks Po/ieej, + M, + Fj + Bit,Car Theftit is the number of car thefts in block i for month t;
Same-Bloek Polieeit is a dummy variable that equals 1 for the months after the terrorist attack (August, September, October, November, and December) if there is a protected institution in the block, O otherwise;
One-Bloek Polieeir is a dummy variable that equals 1 after the terrorist attack (August, September, October, November, and December) ifthe bIock is one block away from the nearest protected institution, O otherwise;
Two-Bloeks Polieeit is a dummy variable that equaIs 1 after the terrorist attack (August, September, October, November, and December) if the block is two bIocks away from the nearest protected institution, O otherwise;
Mr is a month fixed effect;
Fi is a block fixed effect;
ê;r is the error term.20
The empirical exercise exploits three aspects of our data. First, it uses the fact that the geographical distribution of police forces induced by the surveillance poIicy is exogenous to the distribution of crime. Officers are pIaced in those bIocks to protect a potential terrorist target, not in response to leveIs of common crime. Second, the avaiIability of data before and after the terrorist attack enables us to include bIock fixed effects that controI for time-invariant influences. Finally, having data on blocks with and without protected institutions allows us to define a treatment and a control group so that we can include time effects that controI for any aggregate shocks in the evolution of crime (including any trends over time).
20 Standard errors are Huber-White (i. e., heteroskedasticity consistent) unless specified.
lt is worth noting that we estimate the effect of police presence on crime absent
direct data on the distribution of police forces. In our study the post-attack distribution of the protected institutions stands in for the presence of police forces. Indeed, our paper could be construed to be an instrumental variables application. If a portion of the police force is endogenously allocated to fight common crime, whereas another portion is exogenously deployed to protect the Jewish buildings, we could use the surveillance policyas an instrument for police presence. A two-stage exercise, however, would require detailed data on the distribution of police forces per block at any given time, information that is confidential. Although it is possible to calculate the reduced form regression of the outcome on the instrument, it is not feasible to estimate the instrumented two-stage regression.
A natural question with respect to our empirical approach is the extent to which police officers deployed to protect Jewish and Muslim institutions are effective anti crime agents. Although policemen in this role have limited scope for pursuing suspected criminaIs outside their assigned areas, they can nevertheless interfere with crimes committed near their posts and communicate the presence of suspicious-Iooking individuais to policemen patrolling the neighborhood. Moreover, criminais probably expect the police to intervene. From a more practical point of view, there is anecdotal evidence of arrests made by policemen on duty guarding these institutions.21
IV. The Effect of Police 00 Crime
IV.A. Basic Estimates
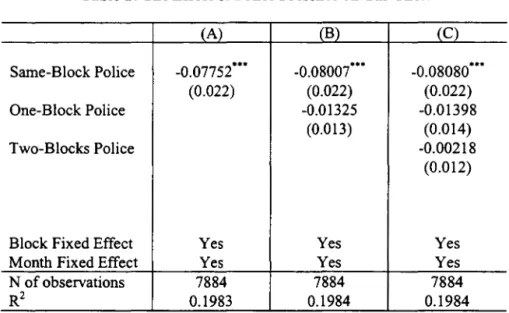
Table 2 reports our basic regression results. Colurnn (A) uses only the nearest measure of police presence, Same-Block Police, a dummy that takes the value 1 for every month after the attack for every block in which there is a Jewish institution. This regression considers all the rest of the neighborhoods as our control group. The coefficient on Same-Block Police is negative and significant.
Regression (B) includes a larger measure of distance .to a protected institution,
One-Block Po/ice. This variable captures the effect of police presence on the six adjacent
blocks that are one block away from each block occupied by a guarded institution. The
effect of Same-Block Police is negative, significant, and marginally larger in absolute size
than the one reported in column (A). The effect of One-Block Po/ice (the effect on
immediately neighboring blocks) is not significant. It indicates that blocks one block
removed from a protected institution do not experience significant1y fewer car thefts than
the rest of the neighborhood.
Regression (C) includes a third measure of proximity to a guarded institution,
Two-Blocks Police. This measure takes the value I during the post-attack period for alI
the blocks that are two blocks away from the nearest Jewish institution. The significance
of Same-Block Police remains below the 1 % leveI, whereas the coefficients on One-Block
Po/ice and Two-Blocks Po/ice are not significant. For blocks within the immediate radius
of the protected institutions (one or two blocks removed) car thefts are not fewer than for
the non-treatment group (i.e., the rest of the neighborhood).22 We later introduced
additional treatment dummies (Three-Blocks Police, Four-Blocks Police, and so forth),
but their coefficients were not significant1y different from zero.
Our results suggest that the introduction of a fixed and observable police presence
generated a significant decline in car thefts in the protected blocks but no effect one or
two blocks away relative to the rest of the neighborhoods. For the rest of the paper we
focus on this specification, which takes as our control group blocks more than two blocks
away from the guarded buildings. Our results do not change when we treat one and two
blocks removed blocks as part of the control group (or if we restrict the control group to
an even more distant area).
The effect of police presence in the same block is quite large in economic terms. It
indicates a reduction of 0.081 car thefts per month in the blocks that received direct
police protection. The average number of car thefts per month per block from August
reported in Villa Luro and Once (where a police officer protecting a Jewish institution was stabbed in a struggle with a thiefwho was robbing a nearby grocery store; the burglar was later arrested).
22 Similar results are obtained if we include a set of durnmy variables that measure the distance in blocks to
the Jewish institutions rather than the block fixed effects. As suggested by Figure 2, none ofthese dummies is significant.
through December for all blocks more than two blocks away from a protected institution is 0.108. Relative to this average, car theft declines by 75% in blocks in which a protected institution is situated.
The estimated drop in crime in protected blocks can be approximated into an elasticity of crime with respect to police presence. The estimated percentage change in car theft is -75%. To calculate the percentage change in police presence, we note, for example, that in the Once neighborhood approximately 200 officers were deployed prior to the attack. Assuming that Buenos Aires policemen work eight-hour shifts and an average of 21 days per month, there are approximately 47 officers on patrol at any given time. Inasmuch as Once comprises 153 blocks, the average presence of officers per block is 0.31. Roughly approximated, the change in police presence is (1-0.31)/0.31=2.23, for an approximate elasticity of car theft with respect to police of -0.33. It might also be appropriate to reduce the number of policemen present at any given time by the proportion of patrol officers relative to officers performing other duties (e.g., adrninistrative or investigative tasks). Bayley suggests 60% as a reasonable number for this proportion in the United States (see chapter 2 in Bayley (1998». Using these estimates the elasticity of car theft with respect to police is -0.17.
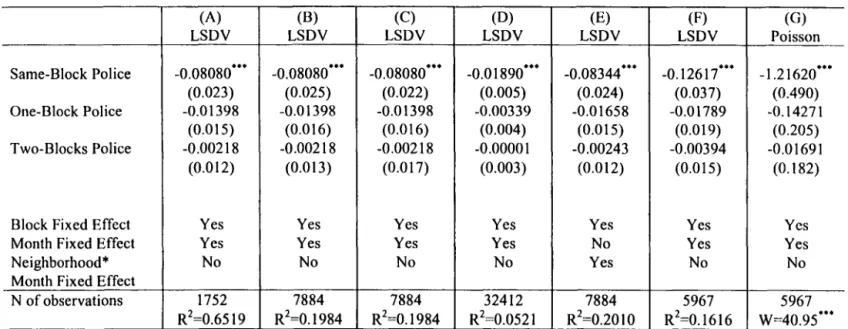
IV.B. Robustness
In this section we present further tests to help assess the validity of our results. For example, a simple potential objection is that, because the protection policy also imposed parking restrictions right in front of some of the protected institutions, the policy might have led mechanically to a depressed number of victims. To address this issue, we measured the forbidden parking space in front of each institution. This area represents, on average, 11 % ofthe total parking space for protected blocks.23 Under a linear relationship this factor could explain a 0.012 reduction in the number of car thefts (11 % of 0.108, the average number of car thefts for the control group). We reject at the 1 % significance leveI that our estimated coefficient equals this value.
A related issue is that drivers may have preferred to avoid parking near the protected institutions for fear of another terrorist attack. To address this concern, in Table 3 we estimate the evolution of our police coefficients over time after the terrorist attack. If fear of another terrorist attack was preventing neighbors from parking in these blocks, we should expect the effect to diminish over time.24 Yet, our coefficients on Same-Block Po/ice remain constant over the period of analysis. Moreover, both the Israeli embassy and the A.M.l.A. terrorist attacks were focused on the target buildings (surrounding buildings in the block were not destroyed), so the impact of fear of future attacks should be concentrated on parking spaces direct1y in front of the Jewish institutions.25 Interestingly, Table 3 reports for August, the first month after the attack, a negative and significant coefficient on One-Block Police, leading us to speculate that criminaIs needed time to realize that the police guards were actually restricted to their posts; subsequent1y, the policemen show no effect in deterring crime one block away.
23 This figure represents an upper Iimit of the parking restrictions generated by the terrorist attack inasmuch as parking in front of some of the institutions was already restricted before the attack.
24 Similarly, it may be argued that after the attack common criminaIs experienced a bloom of civility that led them to avoid committing crimes in front of buildings of the Jewish community. Again, we would expect such a bloom to fade over time. Reduced crime in New York City immediately after the terrorist attack of September lI, 2001 was attributed to a rise in civility (see, for example, "US Crime Rate Up, Ending Decade ofDecline," Christian Science Monitor, June 25, 2002).
25 lt should also be emphasized that finding a legal parking space in these neighborhoods is often difficult,
thus reducing the incidence of this problem. On the severe parking conditions in Buenos Aires, see, for example, La Nacion, March 5, 2001.
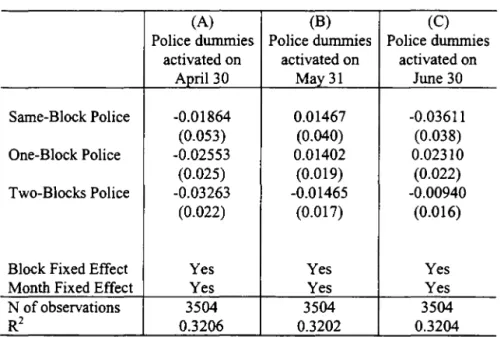
We also investigate whether blocks close to a Jewish institution exhibit a different crime dynamic than the rest of the neighborhood in the period before the terrorist attack.
If crime was diminishing in blocks occupied by Jewish institutions before the attack, perhaps we are capturing a spurious correlation. To analyze this issue, we consider a sample that starts on April 1 and ends on July 17. We then re-estimate our basic regression redefrning our Same-Block Police, One-Block Police, and Two-Blocks Po/ice
dummy variables to take the value 1 at the end of April (column (A) of Table 4). We do this for each month prior to the attack (i.e., end of May in column (B) and end of June in column (C)). In this way, we reproduce our exercise as ifthe terrorist attack had occurred during the pre-treatment period. The non-significant results in Table 4 validate our exercise in the sense that they reveal no special crime dynamics affecting our treatment group before the terrorist attack.
The question of whether the timing of the change in the evolution of car thefts around Jewish institutions coincides with the date police protection was deployed can be approached as a test for the timing of a structural break in the model presented in Section Ill. We estimate a series of models with treatment dummies defined for every possible breakdate. We then calculate the sum of squared errors for each mode!. The least squares breakdate estimate is the date for which the sum of squared errors associated with the model is minimized (Bai, 1994; Bai, 1997; Bai, Lumsdaine and Stock, 1998; Hansen, 2001). Considering the full sample period (all observations from April 1 to December 31, including the July 18 to July 31 ínterim period), we first perform this exerci se redefining the treatment dummies to take the value 1 at the end of each month. The sum of squares errors is minimized by the regression that considers the end of July to be the breakdate. To gain precision, we also perform the exercise at a week1y levei of aggregation. In this case, the breakdate estimator corresponds to the end of the fourth week of July. Thus, at both frequencies of aggregation the least squares breakdate estimates coincide with the actual date police protection was deployed to the Jewish institutions.
In the presence of positive serial correlation, a potential concern is that OLS
the treatment is serially correlated, as is the case for the proxy for police presence that we use in our exercise. We employ two solutions (discussed in Bertrand, Duflo and Mullainathan (2001» to solve this problem for large sample sizes such as ours. First, we collapse the data for each block into two observations (pre- and post-periods). In column (A) of Table 5, we regress the monthly averages of car thefts per block for the pre- and post-attack periods on the treatment variable. The results remain unaltered. The second solution is to allow for an arbitrary covariance structure within blocks over time. This is presented in column (B) of Table 5, which shows that our results are unaffected when standard errors are computed through clustering on blocks?6
Another concern is the possible presence of spatial correlation across blocks of the same neighborhood that could be commonly affected by local shocks. To address this issue, in column (C) of Table 5 the standard errors are calculated through clustering on neighborhood-month combinations. This does not affect the significance of our results. The nurnber of clusters, however, could be considered insufficient when we cluster on the 27 neighborhood-month combinations. In column (D) we show that the results do not change when we consider weekly observations and cluster on the 111 week-neighborhood combinations. As another strategy to control for the potential presence of local shocks, in colurnn (E) we include neighborhood-month fixed effects rather than our month fixed effects. Our results again remain unaltered.
In colurnn (F) we repeat the analysis, excluding blocks in which no thefts occurred throughout the period of analysis. Introducing police protection in these blocks should have no effect, the nurnber of car-thefts already being bounded at zero. As expected, the coefficient is larger (more negative) when we exclude the 213 no-theft blocks (24% of our sample). This coefficient corresponds to a drop in car theft of 89% relative to the
26 The variance fonnula for the calculation of the clustered standard errors is given by
Z
=
qc(X1Xt'(fUh'Uh)(X1Xt';
where: Uh=
LU
j ; Gf, G], "', GM are the clusters; M is theセ@ セセ@
N-1 M
number of clusters; U j
=
(y j - X jb)x j; and qc= ----;
while Yj, Xj' b, x, N and k followN-kM-1
standard econometric notation (for further details, see STATA (2001), page 87). This variance estimator coincides with the Huber-White variance estimator when each cluster contains one observation.
control group. Finally, a Poisson specification presented in colurnn (G) shows our results to be robust to estimation using count data models.27
IV.C. Further Resu/ts
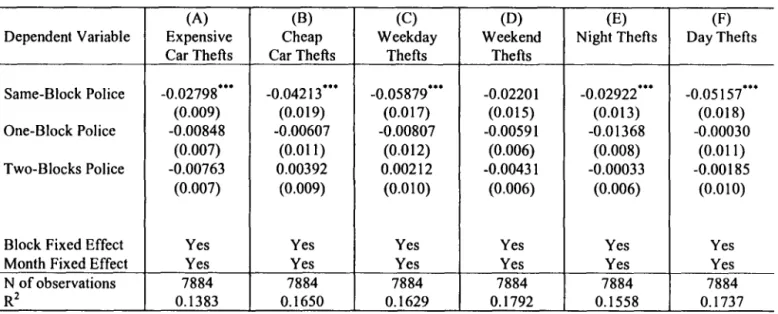
Using standard information from the used car market we exploit our data on car make and year to construct an estimate of the value of the stolen cars. We then analyze, in Table 6, the differential deterrent effect ofpolice presence (splitting the sample between cheap and expensive cars). We perform similar analyses for weekday and weekend and night and day thefts. The Same-Block Po/ice coefficients show no statistically significant
differences in the effect of police presence on crime by car value, day of the week, or time of day (after normalizing the coefficients by the average number ofthefts of each type). 28
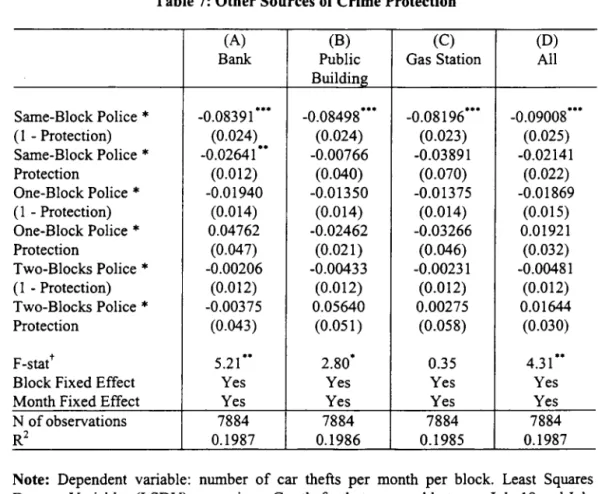
For some of the blocks to which police were assigned post-attack some source of crime protection was already in place. In Table 7 we compare the effect of the additional police protection for blocks occupied by a bank, public building (including foreign embassies), gas station, or any of these buildings relative to other guarded blocks not previously provided this security. The first two cases (bank and public building) indicate some police protection already in the block. The latter case (gas station) implies significant light and movement during the entire day. As expected, the coefficient on additional police presence is always smaller in size when previous sources of crime protection were already present in the block. The effect of police presence for previously protected blocks is significantly different from zero only in blocks that have a bank (see Colurnn (A», at which police are present only during office hours and often inside the building.
27 Similar results are obtained using a Negative Binomial modeJ.
IVD. Discussion
The focus of our paper is to estimate the causal effect of police on crime and to explore the internaI validity of our estimates. It is also worth discussing briefly the public finance question (i.e., whether treatment benefits outweigh costs) and the externaI validity of our results (i.e., whether they have predictive value). Although a full evaluation is not possible, some of the information that we have available is worth considering.
A starting point for the cost-benefit analysis is the direct cost of police surveillance relative to car values. During this period, a Buenos Aires policeman was earning on average a monthly wage of $800. Given that policemen work eight-hour shifts and average 21 work days per month, the monthly cost of providing police protection for one block is approximately $3,428. Our estimates suggest that police presence in a block would induce a reduction of 0.081 of a car theft per month. The average value of the stolen cars in our sample is $8,403.29 Thus, in terms of the reduction in auto-theft exclusively, the protection policy was not cost-effective. Of course, visible police protection provides other social benefits besides a lower rate of car theft, such as deterring other types of crime not considered in our study (e.g., burglaries or terrorist attacks). lmportantly, incapacitating criminaIs is likely to substantially benefit society, whereas our estimates capture only deterrence effects. A fuII analysis, moreover, would need to assess the psychological benefits to typical citizens of feelings of greater security consequent to observing the presence of police. Crime reduction in the protected blocks, however, could simply reflect the displacement of criminal activity to other areas of the city. Indeed, we found some evidence consistent with this displacement hypothesis. For a number of specifications we detected an increase in car theft two blocks away from protected institutions, although this is not a robust finding of our paper.30
29 If some stolen cars are recovered in working condition, then only a fraction of their value should be counted. Official publications put the proportion of cars stolen in Buenos Aires that are never recovered at 60% (Ministerio de lusticia (2000». One should also count, however, the amount oftime consumed by the recovery process and the cost of any needed repairs.
30 For example, using a binary Logit model that treats equally any positive number of thefts or assigning
each theft reported at a comer as one theft in each of the four blocks of that intersection. Comish and Clarke (1987) and Hesseling (1994) survey the criminology Iiterature on displacement. Ayres and Levitt (1998), Lott (1998), and Duggan (200 I) study the effect of introducing unobservable protection devices (Lojack and concealed handguns) with potentially positive extemalities. Similarly, in our study, observable police presence might induce negative extemalities in neighboring areas. Given the growth in private expenditures
Another way to evaluate the impact of the policy, relevant for the public finance question, is to determine whether total car thefts in Buenos Aires were affected as much as or less than the reduction in the blocks that contain protected institutions. Unfortunately, reliable monthly data for car thefts citywide in Buenos Aires are unavailable. The annual published crime data show a general upward trend in car thefts and other property crime during the 1990s in the city of Buenos Aires (that is less apparent in the rest of the country). The year 1994 was not an outlier in this processo One should also note that these crime increases were concentrated in Iow-income urban areas (e.g., Di Tella, Galiani and Schargrodsky, 2002), whereas the neighborhoods considered in our study were middle-to-high income areas. Final1y, the protected blocks probably represent too small a share of the city, meaning that, given the noise in the official statistics and the trends affecting the leveI and the distribution of crime during the period, it is unclear whether the impact of our natural experiment can be perceived at the aggregate leveI.
With respect to the externaI validity of our findings, a number of issues are worth mentioning. First, the standing-policeman technology we analyze is similar to that used for private security in the most affluent neighborhoods of Buenos Aires. In these areas booths for private security guards are placed at each comer approximately 100 meters from one another.31 If privately provided surveillance covers all parts of the block (i.e.,
there are no blind spots) and there are no advantages to having a section of the block protected by two security guards (i.e., overlapping protection), then the maximum protection distance is about 50 meters, the distance from the security guard's booth to the house furthest from his surveillance. Interestingly, our results are consistent with the coverage solution reached by the private security market.
Second, our results involving a technology based on policemen in a fixed location might be relevant in the analysis of other forms of police presence such as officers on
to reduce crime, and the fact that this spending often involves observable crime deterrence activities (such as the use of private armed security), the distributional impact of crime across income leveis is worth studying.
patro!. Switching to mobile policemen is unlikely to induce a different response in car theft given that the act of breaking into a car is of extremely short duration. Because criminaIs check that there are no policemen watching when they start the process, the likelihood of discovery conditional on no monitoring at the start of the break-in is virtually zero. Our key informants have emphasized in interviews that it is well understood in police circles that the probability of a policeman on patrol actually witnessing a crime being committed is quite low. The most likely case is that someone who has witnessed a crime calls the police.32 Furthermore, the kind of police presence we analyze is visible. An altemative, to deploy police agents in plain clothes, would make breaking into a car more risky for criminals.33 Such benefits, however, might be offset by the dissatisfaction of cÍtizens who value knowing that they are under police protection. Another potential cost is that it could make reporting crimes to nearby police more difficult for victims and by-standers. Interestingly, policy-makers' tendency to address public pressure for more protection from crime by deploying more visible police on the streets could imply counter-productive police reallocations.34 Given the highly local impact of street deployments, it would be interesting to obtain estimates of the effect of extra policemen on investigative tasks.
32 A recent article in The Economist (February 24, 2001) makes a similar point: ''Sut putting more police on the beat will probably not have much impact on crime figures. A single patrolling officer typicaIly covers an area containing 18,000 inhabitants, 7,500 houses, 140 miles of pavements, 85 acres of parks, 77 miles of roads, 23 pubs and 10 schools. The chance of that officer actually catching an offender red-handed is extremely smaJl. A Home Office study estimates that a patrolling policeman in London might expect to pass within 100 yards of a burglary in progress once every eight years, and even on that occasion is very unIikely to realize that a crime is taking place, let alone catch the burglar."
33 The article cited in the previous footnote aIso discusses the use of officers in plain cIothes as an anti-crime strategy.
34 A similar point is raised by a former policeman in an open letter to the Washington Post: ''The other altemative was to "get officers from behind desks" to walk foot patrols, allegedly at no additional cost. But while this second method seemed more paIatable, it had hidden costs that undermined the police departrnent's ability to solve and prevent crimes. Most of the so-called desk officers were performing important investigative and support functions that happen to occur out of public sight. In each staffing cycJe in which desk officers were put on the street, the police department's ability to solve crimes such as murder, robbery, rape and assault was diminished." "Citizen Police for the City", The Washington Post, September 10, 2000. The literature on crime distinguishes between two different forms of law enforcement: monitoring and investigation (see, for example, Mookherjee and Png (1992)). An important difference between the two is that in the latter the police wait until the crime is committed and reported and only theil proceed to investigate and enforce the law, whereas monitoring entails watching over potential targets at the times crimes can be committed.
v.
ConclusionsA crucial challenge in the literature on crime is to obtain an estimate of the effect of increased police presence. In this paper, we have tackled this question exploiting a natural experiment. On July 18, 1994 a terrorist cell exploded a bomb that destroyed the main Jewish center in the city ofBuenos Aires, killing 85 people and wounding more than 300. Following the attack a police officer was stationed in front of each Jewish and Muslim institution in the country. Because the distribution of these institutions can be presumed to be exogenous in a crime regression, it is possible to use this hideous event to break the simultaneous determination of crime and police presence.
We collected data on the precise locations of car thefts in three neighborhoods in Buenos Aires before and after the attack. We find a large, negative, and highly local effect of police presence on car theft. Blocks that receive police protection experience 0.081 fewer car thefts per month than blocks that do not. The post-attack average number of car thefts per block for our control group is 0.108, so police protection induces a decline in auto theft of approximately 75%. Blocks one or two blocks away from where protection is provided, however, do not experience fewer car thefts relative to the rest of the neighborhood. These results are robust to alternative specifications and do not seem to be generated by spurious correlations associated with different crime dynamics for the treatment and control groups or by serial or spatial correlations that could be inflating the statistical significance of the results. The empirical strategy employed in our paper, premised on policemen standing guard, suggests that estimated effects correspond exclusively to deterrence effects.
Our results, in brief, suggest that a posted and visible police guard exerts a large, negative, local effect on auto theft and little or no effect outside a narrow area.
Appendix:
Table AI: Neigbborbood Distribution ofBlocks, Institutions and Car Tbefts
N eigbborboods Belgrano Villa Crespo Once Total
Blocks 463 260 153 876
Institutions 9 14 22 45
Inside 7 13 17 37
In boundaries 2 1 5 8
Car Thefts 530 191 73 794
April l-July 17 197 73 24 294
July 18-July 31 30 9 7 46
August l-December 31 303 109 42 454
References
Andreoni, James (1991) "Reasonable Doubt and the Optimal Magnitude of Fines: Should the
Penalty Fit the Crime?", RAND Journal of Economics, 22 (3), 385-395.
Angrist, Joshua (1990) "Lifetime Earnings and the Vietnam Era Draft Lottery: Evidence from
Social Security Administrative Records", American Economic Review, 80 (3), 313-336.
Angrist, Joshua and Alan Krueger (1991) "Does Compulsory School Attendance Affect
Schooling and Earnings?", Quarterly Joumal of Economics, 106 (4), 979-10 14.
Ayres, Ian and Steven Levitt (1998) "Measuring Positive Extemalities from Unobservable
Victim Precaution: An Empirical Analysis of Lojack", Quarter/y Joumal of Economics,
113 (1), 43-77.
Bai, Jushan (1994) "Least Squares Estimation of a Shift in Linear Processes", Joumal of Time
Series Analysis, 15 (5),453-472.
Bai, Jushan (1997) "Estimation of a Change Point in Multiple Regression Models", Review of
Economics and Statistics, 79 (4), 551-563.
Bai, Jushan, Robin Lumsdaine and James Stock (1998) "Testing For and Dating Common Breaks
in Multivariate Time Series", Review ofEconomic Studies, 65 (3), 395-432.
Bar-Ilan, Avner and Bruce Sacerdote (2001) "The Response to Fines and Probability of Detection in a Series ofExperiments", NBER 8638.
Bayley, David (1998) "Introduction to Chapter 2: Patrol" in David Bayley (editor), What Works in Policing, Oxford University Press
Becker, Gary (1968) "Crime and Punishment: An Economic Approach", Joumal of Political
Economy, 76 (2), 169-217.
Bertrand, Marianne, Esther Duflo and Sendhil Mullainathan (2001) "How Much Should We Trust Differences-in-Differences Estimates?", mimeo.
Cameron, Samuel (1988) "The Economics of Crime Deterrence: A Survey of Theory and
Evidence", Kyklos, 41 (2),301-323.
Corman, Hope and H. Naci Mocan (2000) "A Time-Series Analysis of Crime, Deterrence, and
Drug Abuse in New York City", American Economic Review, 90 (3),584-604.
Cornish, Derek and Ronald Clarke (1987) "Understanding Crime Displacement: An Application
ofRational Choice Theory", Criminology, 25, 933-947.
Di Tella, Rafael, Sebastian Galiani and Ernesto Schargrodsky (2002) "Crime Victimization and Income Distribution", mimeo, Inter-American Development Bank.
Duggan, Mark (2001) "More Guns, More Crime", Joumal of Political Economy 109 (5),
1086-1114.
Eck, John and Edward Maguire (2000) "Have Changes in Policing Reduced Violent Crime? An Assessment of the Evidence" in Alfred Blumstein and Joel Wallman (editors), The Crime Drop in America, New York: Cambridge University Press.
Ehrlich, Isaac (1973) "Participation in lllegitimate Activities: A Theoretical and Empirical
Investigation", Joumal of Political Economy, 81 (3),521-565.
Ehrlich, Isaac and George Brower (1987) "On the Issue of Causality in the Economic Mode! of Crime and Law Enforcement: Some Theoretical Considerations and Experimental
Evidence", American Economic Review, 77 (2), 99-106.
Fajnzylber, Pablo, Daniel Lederrnan and Norrnan Loayza (2000) "Crime and Victimization: An
Economic Perspective", Economia, I (1),219-302.
Fisher, Franklin and Daniel Nagin (1978) "On the Feasibility of Identifying the Crime Function
Freeman, Richard (1996) "Why Do So Many Young American Men Commit Crimes and What Might We Do About It?", Journal ofEconomic Perspectives, 10 (I), 25-42.
Hamermesh, Daniel (1999) "The Art ofLabormetrics", NBER 6927.
Hansen, Bruce (2001) "The New Econometrics of Structural Change: Dating Breaks in U.S. Labor Productivity", Journal ofEconomic Perspectives, 15 (4), 117-128.
Hesseling, Rene (1994) "Displacement: A Review ofthe Empirical Literature", in Ronald Clarke (editor), Crime Prevention Studies,
m,
197-230.Kessler, Daniel and Steven Levitt (1999) "Using Sentence Enhancements to Distinguish between Deterrence and Incapacitation", Journal of Law and Economics, 42 (1), 343-363.
LaLonde, Robert (1986) "Evaluating the Econometric Evaluations of Training Programs with Experimental Data", American Economic Review, 76 (4), 604-620.
Levitt, Steven (1997) "Using Electoral Cycles in Police Hiring to Estimate the Effect af Police on Crime", American Economic Review, 87 (3), 270-290.
Levitt, Steven (1998) "Why Do Increased Arrest Rates Appear to Reduce Crime: Deterrence, Incapacitation ar Measurement Errar?", Economic Inquiry, 36 (3), 353-372.
Levitt, Steven (2002) "Using Electoral Cycles in Police Hiring to Estimate the Effect af Police on Crime: Reply", American Economic Review, 92 (4), 1244-1250.
Lott, John (1998) More Guns. Less Crime, The University of Chicago Press: London.
Marvell, Thomas and Carlisle Moody (1996) "Specification Prablems, Police LeveIs, and Crime Rates", Criminology, 34 (4), 609-646.
McCormick, Robert and Robert Tollison (1984) "Crime on the Court", Journal of Political Economy, 92 (2), 223-235.
McCrary, Justin (2002) "Using Electoral Cycles in Police Hiring to Estimate the Effect af Police on Crime: Comment", American Economic Review, 92 (4),1236-1243.
Ministerio de Justicia (2000) "Estudio de Victimización en Centros Urbanos de la Argentina", ITÚmeo.
Mookherjee, Dilip and Ivan Png (1992) "Monitoring vis a vis Investigation in the Enforcement of Law", American Economic Review, 82 (3), 556-565.
Pelacchi, Adrian (2000) Tratado sobre la Seguridad Pública, voI. 318, Editorial Policial.
Posner, Richard (1993) "What Do Judges and Justices Maximize?", Supreme Court Economic Review,3 (O), 1-41.
Sacerdote, Bruce (2001) "Peer Effects With Random Assignrnent: Results for Dartmouth Roommates", QuarterlyJournal ofEconomics, 116 (2),681-704.
Sherman, Lawrence, Patrick Gartin and Michael Buerger (1989) "Hot Spots ofPredatary Crime: Routine Activities and the Criminology ofPlace", Criminology, 27 (I), 27-55.
Sherman, Lawrence and David Weisburd (1995) "General Deterrent Effects of Police Patrol in Crime "Hot Spots": A Randomized, Controlled Trial", Justice Quarter/y, 12 (4),
625-648.
STATA (2001) Stata Reference Manual, Release 7 Volume 3 Q-St, Stata Press: College Station Texas.
Witte, Ann (1980) "Estimating the Economic Model of Crime with Individual Data", Quarter/y Journa/ofEconomics, 94 (1),155-167.
Table 1: Monthly Evolution ofCar Theft
One Block Two Blocks Morethan
Jewish from Nearest from Nearest Two Blocks
Month Institution in Jewish Jewish from Nearest
the Block Institution
Institution Institution Jewish
April 0.12162 (0.361) 0.12111 (0.287) 0.12278 (0.297) 0.09955 (0.248) May 0.08783 (0.205) 0.07763 (0.181) 0.09734 (0.259) 0.10840 (0.235)
June 0.12837 (0.286) 0.07763 (0.215) 0.06969 (0.186) 0.07853 (0.196)
July(1-17) 0.02027 0.05900 0.03097 0.03926
(0.069) (0.210) (0.141) (0.145)
July (18-31) 0.02702 (0.078) 0.07298 (0.217) 0.06858 (0.238) 0.03926 (0.146)
August 0.04729 (0.175) 0.06677 (0.219) 0.12721 (0.304) 0.11836 (0.287) September 0.01351 (0.057) 0.09006 (0.276) 0.09845 (0.248) 0.10176 (0.256)
October 0.06081 (0.215) 0.09782 (0.260) 0.08849 (0.236) 0.12112 (0.267)
November 0.02702 0.11024 0.10176 0.09623
(0.078) (0.288) (0.217) (0.240)
December 0.02702 (0.078) 0.11645 (0.278) 0.10619 (0.225) 0.10176 (0.268) Numberof
37 161 226 452
blocks
Table 2: The Effect of Police Preseoce 00 Car Theft
(A) (B) (C)
Same-Block Police -0.07752'" -0.08007'" -0.08080'"
(0.022) (0.022) (0.022)
One-Block Police -0.01325 -0.01398
(0.013) (0.014)
Two-Blocks Police -0.00218
(0.012)
Block Fixed Effect Yes Yes Yes
Month Fixed Effect Yes Yes Yes
N of observations 7884 7884 7884
R2 0.1983 0.1984 0.1984
Note: Dependent variable: number of car thefts per month per block. Least Squares Dummy Variables (LSDV) regressions. Car thefts that occurred between July 18 and July 31 are excluded. Huber-White standard errors are in parentheses .••• Significant at the 1 % leveI.
Table 3: The Effect of Police Presence on Car Theft - Monthly Coefficients
Same-Block Police - August -0.07914"
(0.037) Same-Block Police - September -0.09633'"
(0.026)
Same-Block Police - October -0.06840
(0.042)
Same-Block Police - November -0.07729'"
(0.027) Same-Block Police - December -0.08282'"
(0.027)
One-Block Police - August -0.05400"
(0.023)
One-Block Police - September -0.01411
(0.024)
One-Block Police - October -0.02570
(0.024)
One-Block Police - November 0.01160
(0.026)
One-Block Police - December 0.01228
(0.026)
Two-Blocks Police - August 0.01009
(0.023)
Two-Blocks Police - September -0.00207
(0.022)
Two-Blocks Police - October -0.03138
(0.019)
Two-Blocks Police - November 0.00677
(0.019)
Two-Blocks Police - December 0.00566
(0.020)
Block Fixed Effect Yes
Month Fixed Effect Yes
N of observations 7884
R2 0.1997
Table 4: Car Thefts Before the Terrorist Attack
(A) (B) (C)
Poliee dummies Poliee dummies Poliee dummies aetivated on aetivated on aetivated on
April30 May_31 June 30
Same-Block Poliee -0.01864 0.01467 -0.03611
(0.053) (0.040) (0.038)
One-Bloek Poliee -0.02553 0.01402 0.02310
(0.025) (0.019) (0.022)
Two-Blocks Poliee -0.03263 -0.01465 -0.00940
(0.022) (0.017) (0.016)
Bloek Fixed Effeet Yes Yes Yes
Month Fixed Effeet Yes Yes Yes
N of observations 3504 3504 3504
R
2 0.3206 0.3202 0.3204Note: Dependent variable: number of ear thefts per month per bloek. Least Squares Dummy Variables (LSDV) regressions. Sample period: April l-July 17. The variable Same-Block Po/ice in eolumn (A) equals 1 between April 30
and July 17 (for bloeks that eontain a Jewish institution) and O otherwise. The same is true for One-Block Police, and Two-Blocks Police (for bloeks one
bloek away from the nearest Jewish institution and blocks two blocks away from the nearest Jewish institution, respeetively). Column (B) redefines these variables using May 31, and column (C) uses June 30. Huber-White standard errors are in parentheses.
Table 5: Robustness
(A) (B) (C) (O) (E) (F) (G)
LSOV LSOV LSOV LSOV LSOV LSOV Poisson
Same-Block Police -0.08080·" -0.08080··· -0.08080··· -0.01890··· -0.08344··· -0.12617*·· -1.21620···
(0.023) (0.025) (0.022) (0.005) (0.024) (0.037) (0.490)
One-Block Police -0.01398 -0.01398 -0.01398 -0.00339 -0.01658 -0.01789 -0.14271
(0.015) (0.016) (0.016) (0.004) (0.015) (0.019) (0.205)
Two-Blocks Police -0.00218 -0.00218 -0.00218 -0.00001 -0.00243 -0.00394 -0.01691
(0.012) (0.013) (0.017) (0.003) (0.012) (0.015) (0.182)
Block Fixed Effect Yes Yes Yes Yes Yes Yes Yes
Month Fixed Effect Yes Yes Yes Yes No Yes Yes
Neighborhood* No No No No Yes No No
Month Fixed Effect
N of observations 1752 7884 7884 32412 7884 5967 5967
R2=0.6519 R2=0.1984 R2=0.1984 R2=0.0521 R2=0.201O R2=0.1616 W=40.95···
Note: In regression (A) the dependent variable is the monthly average number of car thefts per block before and after the terrorist
attack. In regression (O) the dependent variable is the number of car thefts per week per block. In the rest of the table the dependent
Table 6: Expensive vs. Cheap, Weekday vs. Weekend, and Night vs. Day
(A) (8) (C) (O) (E) (F)
Oependent Variable Expensive Cheap Weekday Weekend Night Thefts OayThefts
Car Thefts Car Thefts Thefts Thefts
Same-B1ock Police -0.02798·" -0.04213··· -0.05879"· -0.02201 -0.02922·" -0.05157···
(0.009) (0.019) (0.017) (0.015) (0.013) (0.018)
One-B1ock Police -0.00848 -0.00607 -0.00807 -0.00591 -0.01368 -0.00030
(0.007) (0.011) (0.012) (0.006) (0.008) (0.011)
Two-B1ocks Police -0.00763 0.00392 0.00212 -0.00431 -0.00033 -0.00185
(0.007) (0.009) (0.010) (0.006) (0.006) (0.010)
810ck Fixed Effect Yes Yes Yes Yes Yes Yes
Month Fixed Effect Yes Yes Yes Yes Yes Yes
N of observations 7884 7884 7884 7884 7884 7884
R2 0.1383 0.1650 0.1629 0.1792 0.1558 0.1737
. -- - - _ .. - _ ... _ .
-Note: Oependent variable: number of car thefts of each type per month per block. Least Squares Oummy Variables (LSOV) regressions. Car thefts that occurred between July 18 and July 31 are excIuded. Expensive cars are those valued above the mean sample value ($8,403). The sample covers 244.25 expensive car thefts and 446.25 cheap car thefts. The post-July means of expensive and cheap car thefts for the control group are 0.039 and 0.065, respectively. Car model and, thus, value is not available for ali reported car thefts. Weekday car thefts are those reported from Monday through Friday. The sample covers 518.25 weekday car thefts and 214.5 weekend car thefts. The post-July means of weekday and weekend car thefts for the control group are 0.078 and 0.030, respectively. Night car thefts are those reported between 10 p.m. and 10 a.m. The sample covers 239.75 night car thefts and 493 day car thefts. The post-July means of night and day car thefts for the control group are 0.035 and 0.073, respectively. Huber-White standard errors are in parentheses .••• Significant at the I % leveI.
Table 7: Other Sources of Crime Protection
(A) (B) (C) (D)
Bank Public Gas Station All
Building
Same-Block Police
*
-0.08391··· -0.08498··· -0.08196··· -0.09008···(1 - Protection) (0.024) (0.024) (0.023) (0.025)
Same-Block Police
*
-0.02641·· -0.00766 -0.03891 -0.02141Protection (0.012) (0.040) (0.070) (0.022)
One-Block Police
*
-0.01940 -0.01350 -0.01375 -0.01869(1 -Protection) (0.014) (0.014) (0.014) (0.015)
One-Block Police
*
0.04762 -0.02462 -0.03266 0.01921Protection (0.047) (0.021) (0.046) (0.032)
Two-Blocks Police
*
-0.00206 -0.00433 -0.00231 -0.00481(1 - Protection) (0.012) (0.012) (0.012) (0.012)
Two-Blocks Police
*
-0.00375 0.05640 0.00275 0.01644Protection (0.043) (0.051) (0.058) (0.030)
F-statt 5.21·· 2.80· 0.35 4.31··
Block Fixed Effect Yes Yes Yes Yes
Month Fixed Effect Yes Yes Yes Yes
N of observations 7884 7884 7884 7884
R
2 0.1987 0.1986 0.1985 0.1987Note: Dependent variable: number of car thefts per month per block. Least Squares Dummy Variables (LSDV) regressions. Car thefts that occurred between July 18 and July
31 are excluded. Protection equals 1 when a Bank (Column A), a Public Building
(Column B), a Gas Station (Column C), or any of these (Column D) is located in the
block, O otherwise.
t
NulI hypotheses: Same-Block Police*
(1 - Protection) =Figure 2 - Weekly Evolution of Car Thefts
0.08 .i, 5.
0.06
0.04
0.02
o
IPRE-..
\T'f
ACK
']
22 >.
:;
..
...
'"
>.:;
..
[POST-ATTACK
I
-0.02 , I' I'
2 3 4 5 6 7 8 9 10 11 12 13 14 15 16 17 18 19 20 21 22 23 24 25 26 27 28 29 30 31 32 33 34 35 36 37 38 39
April May June
---Jewish Institution in the Block
---One Block from Nearest Jewish Institution ---Two Blocks from Nearest Jewish Institution ---More than Two Blocks from Nearest Jewish Institution
July Augusl Week
Seplember Oclober November December
- - O - -Pre and Post Means for Jewish Institution in the Block
- . -ir .. Pre and Post Means for One Block from Nearest Jewish Institution
.• O- .. Pre and Post Means for Two Blocks from Nearest Jewish Institution - -セM - . Pre and Post Means for More than Two Blocks from Nearest Jewish Institution - -
-Note: Per-block weekly average of car Ihefts for blocks Ihal conlain a Jewish inslitulion (37), blocks lha I are one block away from lhe nearesl Jewish inslilulion (161), blocks Ihal are Iwo blocks away from lhe nearesl Jewish inslilulion (226), and blocks Ihal are more Ihan Iwo blocks away from lhe nearesl Jewish inslilulion (452). The horizonlal means are calculaled excluding car Ihefts Ihal occurred belween July 18 and July 31.
FUNDAÇÃO GETULIO VARGAS BIBLIOTECA
ESTE VOLUME DEVE SER DEVOLVIDO À BIBLIOTECA NA ULTIMA DATA MARCADA
セNcィ。ュN@ PtEPGE SA S311d
Autor: Schargrodsky. Ernesto
Título: Do police reduce crime? : estimates using the 317610
1IIIIIIIIIml
FGV - BMHS
91347
N" Pat.:317610/03