ISSN 1546-9239
© 2012 Science Publications
Corresponding Author: Salah El-Din El-Assal, Department of Genetics, Faculty of Agriculture, Cairo University, El-Gamaa Street, P.O. Box12613 Giza, Egypt
724
Discrimination Capacity of RAPD, ISSR and SSR
Markers and of their Effectiveness in Establishing Genetic
Relationship and Diversity among Egyptian and Saudi Wheat Cultivars
Salah El-Din El-Assal and Ahmed Gaber
Department of Genetics, Faculty of Agriculture,
Cairo University, El-Gamaa Street, P.O. Box12613 Giza, Egypt
Abstract: Problem statement: Yield crop cultivars and landraces are valuable sources of genetic variations that the knowledge and implication of these variations are critical in the plant breeding programs. our major objective of this study is investigating the discriminating capacity of RAPD, ISSR and SSR markers and of their effectiveness in establishing genetic relationship and diversity among Egyptian and Saudi wheat cultivars. Approach: Eleven wheat cultivars and landraces collected from Egypt and Saudi Arabia, five Egyptian wheat (Sakha 93, Sods 1, Sods 4, Gmiza 9 and Sohag 3) and six Saudi wheat landrace cultivars (Hmees, Al-Kaseem, Hegazi, Abo-Sakr, Dubai 1 and Nagran) were characterized using RAPD, ISSR and SSR molecular markers as efficient tools. Ten and nine oligonucleotide primers of RAPD and ISSR respectively and four primer pairs of SSR were used in wheat samples analysis. Only clear and repeatable band profile of 6 RAPD, 8 ISSR and 2 SSR primers were obtained. In RAPD analyses, 74 out of 141 bands (52%) were polymorphic. Results: The number of alleles ranged from 8-21 per primer, with an average of 14.1 per primer. In ISSR analyses, a total of 78 alleles were detected, along with 36 alleles (46%) were polymorphic. The number of alleles per primer ranged from 5-10 with an average of 8.6 alleles per ISSR primer. SSR reactions recorded 6 alleles, of which 5 alleles (83%) were polymorphic. Cluster analysis was conducted using Unweighted Pair Group Method that depends on Arithmetic Average (UPGMA). The dendrogram cluster diagram classified the evaluated genotypes in three major clusters corresponding to the cultivation regions. The first group contains Sakha 93, Sods 1 and Sods 4 with more than 80% Genetic Similarity (GS). The GS between Sakha 93 and Sods 1, Sakha 93 and Sods 4 or Sods 1 and Sods 4 were 83.6%, 83.9 and 85.4 respectively. The second group contains Gmiza 9 and Sohag 3 with GS 83.1%. The third group contains most of the Saudi landrace cultivars, Hmees, Al-Kaseem, Dubai 1, Abo-Sakr and Nagran, which are genetically closed to each other with GS of 81%. The last Saudi wheat landrace cultivar, Hegazi, was falling outside the three major clusters, revealing around 78% similarity with the rest of the five Saudi landrace cultivars. Conclusion/Recommendations: These analyses fit together with geographical distribution of the 11 wheat cultivars and landraces. Moreover, some morphological characterizations as fresh and dry or flowering time between the selected cultivars were analyzed under different salt concentration. We recognized differences in the fresh and dry weight between the selected cultivars. Wheat cultivars Sods 4 and Sohag 3 were the most sensitive cultivars to the salt treatment, while Sods 1 and Sakha 93 cultivars were less sensitive to the salt treatments. Additionally, Sods 4 and Sakha 93 cultivars were the earliest among the five wheat cultivars (flowering time 68.0±5.04 and 71±6.97 days respectively), while Sohag 3 and Gmiza 9 have flowered later than the other five cultivars (111±12 and 105±11.1) respectively. In conclusion, the long term objective of this study was to use these fingerprints to identify molecular markers that co-segregate and could be used in isolating gene(s) which controlling some important traits.
Key words: Genetic Similarity (GS), Random Amplified Polymorphic DNA (RAPD), Inter-Simple Sequence Repeat polymorphic DNA (ISSR), Simple Sequence Repeat (SSR), Landrace Cultivars (LCs)
INTRODUCTION
Wheat (Triticum aestivum L.) is one of the leading cereals in the world and the most important human food
725 world populations and unacceptance of them resulted in reducing of cereal production and was followed by misinterpretation and starvation.
The logic remedy of this problem is conservation of cultivars and landraces and prevention of disappearance of these native resources. The genetic variability of wheat cultivars and landraces has been affected by various factors throughout their evolutionary history. In autogamous crops, out-crossing and fitness-relevant mutations generate intra-population diversity, whereas directed natural or human selection effects lead to an increase in inter-population diversity. In fact, wide range of genetic diversity is critical to maintaining, enhancing and developing of wheat yield in relation of different condition, for instance, it may provide new sources of resistance and tolerance against biotic and abiotic stresses. Wheat cultivars and landrace cultivars are genetically diverse and dynamic populations but are still morphologically recognizable because of certain integrity. Thousands of Landrace Cultivars (LCs) in wheat are stored in seed banks worldwide but the majority is inadequately described for an efficient exploitation in plant breeding. High costs and time lags associated with the extensive search for useful characteristics lead to the fact that breeders rarely resort to these genetic resources. Subsequently, intensively prebreeding approaches are required to transfer desired genes from an improved LC material into advanced breeding lines (Dreisigacker et al., 2005). Plant genome has been characterized with large size and complex organization. Formerly, morphological analysis and sometimes cytogenetic, pedigree or chemical analysis were used in order to study of plant diversity (Volis et al., 2001). Molecular markers can support a more detailed characterization of genetic resources. A vast potential lies in their ability to identify the structure of genetic diversity within and among accessions, which can be great importance for the optimization of collections, the planning of seed regeneration and the successful implementation of prebreeding approaches.
In the past, the complexity of the wheat genome led to a delay in development and application of molecular markers in this crop, so that it lags behind rice, barley and maize in the availability of markers for different agronomic traits. The utility of markers in wheat for analysis of the inheritance of traits and for understanding genome structure and organization is now well established. Molecular markers provide a direct measure and go beyond indirect diversity measures based on agronomic traits or geographic origin. Applying molecular markers and recognition of polymorphic nucleotide sequences dispersed throughout
the genome have provided new possibility for evaluating genetic diversity and determining of inter- and intra-species genetic relationships (Gostimsky et al., 2005; Karakas et al., 2010). Several PCR based molecular markers are available for investigation of genetic diversity such as Simple Sequence Repeat (SSR) (Tautz, 1989), Random Amplified polymorphic DNA (RAPD) (Okumus, 2007; Rahman et al., 2006; Williams et al., 1990), Amplified Fragment Length Polymorphism (AFLP) (Vos et al., 1995), Inter-Simple Sequence Repeat polymorphic DNA (ISSR) (Zietkiewicz et al., 1994), Sequence Tagged Sites (STS), Random Amplified Microsatellite Polymorphism (RAMP) and so on (Altintas et al., 2008; Ercan et al., 2010). It has been shown that different markers might reveal different classes of variation (Russell et al. 1997). It is correlated with the genome fraction surveyed by each kind of marker, their distribution throughout the genome and the extent of the DNA target which is analyzed by each specific assay. These molecular markers had been used in wheat for detecting genetic diversity, genotype identification, genetic mapping (Tanyolac, 2003).
In this study, we have collected 11 wheat cultivars, five Egyptian wheat cultivrs (Sakha 93, Sods 1, Sods 4, Gmiza 9 and Sohag 3) and six Saudi wheat landrace cultivars from different King Saudi of Arabia research centers (Hmees, Al-Kaseem, Hegazi, Abo-Sakr, Dubai1 and Nagran). In a previous study, we found that among the six Saudi cultivars Nagran was the most salt sensitive and late flowering, while Hegazi was the most salt tolerant and early flowering. Therefore, the five Egyptian wheat cultivars were investigated in this study for the morphological characterization under different concentrations of NaCl (50, 150 and 250 mM) and also the five Egyptian cultivars were cultivated under short-day conditions to estimate the differences in flowering time. In addition, our major objective of this study is investigating the discriminating capacity of RAPD, ISSR and SSR markers and of their effectiveness in establishing genetic relationship and diversity among Egyptian and Saudi wheat cultivars.
MATERIALS AND METHODS
726 93 and Gmiza 9, while Sods 1 and Sods 4 are tolerant to high temperature and high salinity.
Salt treatment: Five Egyptian wheat cultivars, Sohag 3, Sods 1, Sods 4, Gmiza 9 and Sakha 93, have been cultivated in two different locations of the greenhouse, under 22°C and Short-days conditions (8 h light/16 h dark). The seeds of the 5 wheat cultivars were subjected to different concentrations of NaCl (50, 150 and 250 mM). The seeds were germinated first and irrigated with tap water for two weeks. The indicated salt concentrations were gradually added to the irrigation water. After 45 days of salt application, Fresh Weight (FW), Dry Weight (DW) and Length (L) of wheat plants were measured as tools to evaluate the level of plant salt tolerance.
Flowering time estimation: The Five different wheat cultivars, Sakha 93, Sods 1, Sods 4, Gmiza 9 and Sohag 3, were planted in two different locations of the greenhouse. The plants were cultivated in Short-days conditions (8 hr’s light/16 hr’s dark) and irrigated with normal tap water in order to avoid any effect of NaCl on flowering time pathway genes. Moreover, flowering time was estimated for the salt treatment 250 mM plants, in order to study the effect of salt stress on flowering time.
Isolation and purification of genomic DNA from wheat cultivars: Fresh young healthy wheat leaves were collected from the studied wheat landraces and cultivars, then grounded to powder with liquid N2 using a mortar and pestle. Genomic DNA was isolated from leaf samples using the procedure described by DNeasy Plant Mini Kit protocol (QIAGEN, Germany).
RAPD analysis
PCR reaction and condition: A total of 10 random primers were used to detect the polymorphism among the 11 wheat cultivars and landraces. The sequence of the 10 primers that produce a clear sociable and reproducible banding pattern is shown in (Table 1). The amplification performed in a 25 L−1 reaction volume containing about 3 L−1 (10 ng L−1) genomic DNA, 3 L−1 primer (50 ng L−1) (Operon Technologies Inc.) and 19 L master mix (Promega). The PCR temperature profile was applied through a Gene Amp® PCR System 9700 (Perkin Elmer, England). The thermal cycler was programmed with an initial step of 5 min at 94°C; the amplification reaction was carried out using 40 cycles of 60 sec at 94°C, an annealing step of 1 min at 37°C and an elongation step of 1 min at 72°C and finally a 7 min extension at 72°C. The amplification products were resolved by electrophoresis in a 1.5% agarose gel containing ethidium bromide (0.5 g mL−1) in 1X TBE buffer at 95 volts. PCR products were visualized on UV light and photographed using a gel documentation system (Bio-Rad® Gel Doc-2000).
Table 1: Sequences and polymorphism level detected by the ten decamer arbitrary primers that have been used for RAPD analysis
No.
Primer No. of of polymorphic Polymorphism
name sequence Primer amplicons bands (%)
OPA-17 5-GACCGCTTGT-3 21 18 86
OPB-01 5-GTTTCGCTCC-3 11 0 0
OPB-06 5-TGCTCTGCCC-3 14 14 100
OPC-05 5-GATGACCGCC-3 14 12 43
OPC-08 5-TGGACCGGTG-3 8 0 0
OPE-13 5-CCCGATTCGG-3 10 0 0
OPE-16 5-GGTGACTGTG-3 13 0 0
OPF-20 5-GGTCTAGAGG-3 15 12 86
OPG-09 5-CTGACGTCAC-3 14 13 93
OPH-01 5-GGTCGGAGAA-3 11 5 45
Total 141 74 52
Table 2: List of Primers that have been used for ISSR analysis (Sofalian et al., 2008)
No. of No. Primer Primer amplicons of polymorphic Polymorphism
name sequence bands (%)
ISSR 1 (UBC 876) (GGGGT)3G 1 6 50 ISSR 2 (UBC 815) (TC)8A 7 3 43 ISSR 3(UBC 852) (GATA)2 13 13 100
(GACA)2
ISSR 4 (UBC 834) (GA)8TT 12 5 42 ISSR 5 (UBC 840) (CT)8TT 5 0 0 ISSR 6 (UBC 845) CAT(CA)7T 9 4 44 ISSR 7 (UBC 822) (AG)8TT 6 2 33 ISSR 8 (UBC 814) (CT)8A(CT)8G 7 2 29 ISSR 9 (UBC 881) (TC)8AA 7 1 14
Total 78 36 46
ISSR analysis: Nine ISSR primers were tested using a specific and optimal annealing temperature for each one (Table 2). PCR reactions were performed in a volume of 20 L−1 in Eppendorf thermocycler. The reaction mixture contained 0.6 L−1 (50 ng L−1) of each primer, 100 M of each deoxinucleotide, 0.5 units of Go Taq polymerase (Promega), 10× Taq buffer containing 2.5 mM MgCl2 and 10 ng of template DNA. Amplification reaction was 94°C/5 min, followed by 30 cycles of 94°C/1 min, 48-60°C (specific for each primer)/1 min and 72°C/2 min and ending with an extension step of 72°C/7 min. PCR products were analyzed using 2% agarose electrophoresis gels stained with ethidium bromide and only bands with high intensity and well separated were selected.
727 Table 3: SSR markers and corresponding primers used in this study
(Somers et al., 2004)
No. of Polymorphi
Marker No. of polymorph sm
name Primer amplicons ic bands (%)
F-TCAGCAAC 3 2 67
Wmc5 AAACATGCTCGG
96 R-CCCGTGTAGGCG
GTAGCTCTT
F-ACAAACGGT 3 3 100
Wmc6 GACAATGCAAGGA
03 R-CGCCTCTCTC
GTAAGCCTCAAC
Total 6 5 83
PCR products were evaluated by electrophoresis, on 2% agarose gels in 0.5× TBE buffer, stained with ethidium bromide and were recorded as BioPrint images.
Data scoring and statistical analysis: Clear and distinct amplification products were scored as ‘1’ for presence and ‘0’ for absence of bands. Bands of the same mobility were scored as identical. The Genetic Similarity coefficient (GS) between two genotypes was estimated according to Dice coefficient (Sneath and Sokal, 1973). The similarity matrix was used in the cluster analysis. The cluster analysis was employed to organize the observed data into meaningful structures to develop taxonomies. At the first step, when each accession represents its own cluster, the distances between these accessions are defined by the chosen distance measure (Dice coefficient). However, once several accessions have been linked together, the distance between two clusters is calculated as the average distance between all pairs of accessions in the two different clusters. This method is called Unweighted Pair Group Method using Arithmetic Average (UPGMA) (Sneath and Sokal, 1973).
RESULTS
Morphological characterization:
Effect of different salt concentrations on fresh and dry weight: In this study, the five Egyptian wheat cultivars, Sohag 3, Sods 1, Sods 4, Gmiza 9 and Sakha 93, were cultivated under 22°C and short-day conditions (8 h light/16 h dark). Watering treatment with four different concentrations of Sodium Chloride (zero (control), 50, 150 and 250 mM), was started after two weeks of germination. The most salt resistant and salt sensitive cultivars, also the early flowering and late flowering cultivars have been recognized. This experiment has repeated twice in two different locations of the greenhouse, in order to avoid any environmental effect on the results.
The different five wheat cultivars have irrigated with four different concentrations of Sodium Chloride ((zero (control), 50, 150 and 250 mM)), for 100 days. The FW has measured direct after cut for eight different plants, while the DW measured after 48 h of drying on
80°C. We couldnot realize before salt treatment any significant differences in Fresh Weight (FW) and Dry Weight (DW) (data not shown).
The average Fresh Weight (FW) for the five cultivars (Gmiza 9, Sakha 93, Sods 1, Sods 4 and Sohag 3) were 0.51±0.22; 0.45±0.17; 0.42±0.11; 0.50±0.19 and 0.55±0.12 respectively. While the average dry weight (DW) for the five cultivars were 0.30±0.16; 0.29±0.14; 0.26±0.11; 0.31±0.07; and 0.29±0.06 respectively.
During the salt treatment, we recognized differences in the fresh weight and dry weight between the five cultivars. The effect was clear after 45 days of watering with different salt concentrations. Wheat cultivar Sods 4 was the most sensitive cultivar to the salt treatment, comparing to the control plants (Fig. 1). The FW and DW of Sods 4 cultivar has affected hardly after treatment and the difference was significant between the control plants comparing to the different salt concentrations, especially the highest (250 mM). The averages of Sods 4 FW were 17.1±3.29; 7.25± 2.56; 7.5±2.65 and 7.13±2.52 with treatments (zero (control), 50, 150 and 250 mg L−1) respectively. The averages of Sods 4 DW were 13.0±2.25; 5.06±1.79; 5.13±1.8 and 5.13±1.8 with treatments (zero (control), 50, 150 and 250 mM) respectively.
Wheat cultivars Gmiza 9 and Sohag 3 have showed moderated effect of salt treatments on (FW) and (DW), while Sods 1 and Sakha 93 cultivars were less sensitive to the salt treatments. Sods 1 were the most salt resistant comparing to the rest of wheat cultivars. The averages of Sods 1 FW were 17.0±4.51; 16.1±3.67; 14.3±3.45 and 13.5±1.13 with treatments (zero (control), 50, 150 and 250 mM) respectively. The averages of Sods 1 DW were 14.9±3.12; 14.0±2.56; 13.1±2.43 and 13.0±0.73 with treatments (zero (control), 50, 150 and 250 mM) respectively.
Effect of different salt concentrations on plant length: We have measured the plant length for the five cultivars in two times. The first time was two weeks after germination (before starting the salt treatment). There were no significant difference in plant length for the five wheat landraces and cultivars (data not shown). The averages of the five cultivars (Gmiza 9, Sakha 93, Sods 1, Sods 4 and Sohag 3) were 13.4±2.8; 12.7±2.92; 16.3 ±0.86; 12.1±2.01 and 14.1±2.73 respectively.
728
Fig. 1: Effect of different Sodium Chloride concentration treatments on Fresh Weight (FW) and Dry Weight (DW) of five wheat cultivars. Black bars are (FW) and gray bars are (DW). T-test; comparing to the control treatment, (*) Significant difference at 95% confidence interval
729 Fig. 3: Flowering time of five wheat cultivars. Black
columns represent the control plants, while gray columns represent the salt stressed plants.T-test; comparing to the control treatment, (*) Significant difference at 95% confidence Interval
The plant length of cultivar Sohag 3 was very sensitive to the salt treatment and has affected hardly. The averages of Sohag 3 plants length are 52.3±1.83; 26.0± 2.3; 24.0±0.78 and 19.0±1.92 with treatments (zero (control), 50, 150 and 250 mM) respectively (Fig. 2). The wheat cultivar Gmiza 9 does not show extreme response to the salt treatment and the effect was moderated, comparing to the rest of wheat cultivars. The effect of salt treatments on plant length has confirmed the effect of salt treatments on FW and DW. These results have supported the direct correlation between the plant size or plant length with plant fresh weight and dry weight.
Flowering time of five wheat cultivars: Plants of five different cultivars were planted in two different locations of the greenhouse, under short day conditions (8 hr’s light/16 hr’s dark). To avoid the effect of salt treatments on flowering time genes behavior, we have used tap water for irrigating the control plants. Moreover, flowering time was estimated for the salt treatment 250 mM, in order to study the effect of salt stress on flowering time. Data were collected from 8 different plant replicates. As shown in in control plants (Fig. 3), Sods 4 and Sakha 93 were the earliest among the five wheat cultivars (flowering time 68.0±5.04 and 71±6.97 days respectively) and significantly different than the rest of the five wheat cultivars. Additionally, Sohag 3 and Gmiza 9 have flowered later than the other five cultivars (111±12 and 105±11.1) respectively. Under salt stress (250 mM Nacl irrigation), the flowering time of cultivar Sohag 3 has affected hardly and flowered significantly earlier than the control plants of the same cultivar, while the rest of the five Egyptian cultivars did not show response to the salt stress.
Molecular characterization: The use of molecular markers was aiming to show fast and reliable discrimination of any variations. In this kind of
molecular markers the DNA of eleven wheat cultivars and landraces, Sakha 93; Sods 1; Sods 4; Gmiza 9; Sohag 3; Hmees; Al-Kaseem; Hegazi; Dubai 1; Abo-Sakr and Nagran, were used as templates for 10 RAPD, 9 ISSR and 3 SSR reactions (Table 1-3).
RAPD-PCR fingerprinting of wheat cultivars and landraces: In this study, 10 RAPD primers were used for estimating of genetic diversity of plant genotypes, butonly the polymorphic ones were used for analyzing. The RAPD-PCR results using primer (OPA-17) has showed a total of 21 bands in the 11 used wheat cultivars and landraces ranged from 100 bp-1900 bp. four common bands were observed in all landraces and exhibited 14% monomorphism, while the other 18 fragments have showed 86% polymorphism among the 11 wheat cultivars (Fig. 4A). This primer detected a unique fragment, over 1 kbp size, specific to Sohag 3 cultivar. A total of fourteen fragments have showed 100% polymorphism among the 11 used wheat cultivars and landraces with primer (OPB-06) are exhibited in (Fig. 4B). The molecular size of the 14 PCR products ranged from 100 bp-2100 bp. Also this primer recognized a unique fragment, between200 and 300 bp, specific to Sohag 3 cultivar.
The results of RAPD-PCR with primer (OPC-05) are depicted in Fig. 4C. The PCR products were 14 fragments. Twelve fragments showed polymorphism among the six landraces, exhibiting more than 43% polymorphism. Two products were monomrphic among the used cultivars and landraces. A unique fragment has recorded between 400 and 500 bp., specific to Sods 4 and Hmees cultivars. Also a 300 bp. fragment detected in the genetic background of Sohag 3 and Hmees cultivars. A total of fifteen bands in the 11 used cultivars and landraces with primer (OPF-20) are illustrated in Fig. 4D. The molecular size of the 15 PCR products ranged from 200-1900 bp. Twelve of them showed 86% polymorphism among the wheat landraces. Fourteen PCR fragments with primer (OPG-09) are depicted in Fig. 4E. Thirteen of them showed 93% polymorphism among the wheat landraces. RAPD’s reaction using primer (OPH-01) is exhibited in Fig. 4F. This primer recorded a unique fragment, larger than 1 kbp., specific to landrace cultivar Hegazi. The molecular size of 11 PCR products ranged from 400 bp-2000 bp. Five out of the 11 fragments has showed more than 45% polymorphism among the used cultivars and landraces. Also this primer recorded a unique fragment, lower than 500 bp., specific to Sods 4 cultivar.
730
Fig. 4: RAPD fingerprinting of 11 Egyptian and Saudi wheat cultivars and landraces. MW: is 1 kb. ladder. (1) Sakha 93; (2) Sods 1; (3) Sods 4; (4) Gmiza 9; (5) Sohag 3; (6) Hmees; (7) Al-Kaseem; (8) Hegazi; (9) Dubai 1; (10) Abo-Sakr; (11) Nagran. (A) Primer OPA-17; (B) Primer OPB-06; (C) Primer OPC-05; (D) Primer OPF-20; (E) Primer OPG-09; (F) Primer OPH-01. (-PCR) is the negative control
731 ISSR-PCR fingerprinting of wheat cultivars and landraces: The ISSR-PCR reaction of primer (ISSR 1 (UBC 876)) has recorded 12 fragments ranged from 200 bp-800 bp. Six of them showed 50% polymorphism among the wheat landraces (Fig. 5A). A unique band with molecular weight between 500 and 600 bp. was detected in this primer, specific to landrace cultivar Hmees. A total of 7 bands in the 11 used landraces with primer (ISSR 2 (UBC 815)) are exhibited in (Fig. 5B). Four common bands were observed in all landraces and exhibited almost 57% monomorphism, while the other 3 fragments have showed around 43% polymorphism among the 11 landraces. A unique band with molecular weight between 300 and 400 bp. was detected in this primer, specific to landrace cultivars Al-Kaseem and Hegazi. The PCR products of primer (ISSR 3 (UBC 852)) were 13 fragments. The product fragments recorded 100% polymorphism among the 11 landraces (Fig. 5C). This primer has showed a specific product for cultivar Sohag 3 and landrace Abo-Sakr, with size around 650 bp. Another product around 400 bp., specific to cultivars Sakha 93, Sods 1 and Sods 4. The results of (ISSR 4 (UBC 834)) are depicted in Fig. 5D. Five fragments among the total of twelve bands in the used landraces have recorded 42% polymorphism. Nine PCR fragments with primer (ISSR 6 (UBC 845)) are depicted in (Fig. 5E). Four of them showed 44% polymorphism among the wheat landraces. The fragments ranged between 250 bp. to 2100 bp. This primer has showed a product specific to Abo-Sakr and Nagran cultivar, with size around 500 bp. Another product around 300 bp., specific to cultivar Hegazi was recorded. Reaction of primer (ISSR 7 (UBC 822)) has recorded a total of 6 bands among the used landraces. The molecular size of 5 PCR products ranged from 200 bp-1900 bp. Two out of the 6 fragments showed more than 33% monomorphism, while the other 4 fragments have showed almost 66% polymorphism among the 6 landraces (Fig. 5F). The ISSR-PCR reaction of primer (ISSR 8 (UBC 814)) has recorded 7 fragments ranged from 150 bp-2200 bp. Two of them showed 29% polymorphism among the wheat landraces (Fig. 5G). A total of 7 bands in the 11 used landraces with primer (ISSR 9 (UBC 881)) are exhibited in (Fig. 5H). Six of fragments were common among the used cultivars and landraces and showed 86% monomorphism. ISSR 5 (UBC 840) primer recorded five product fragments. All of the 5 bands were observed in all wheat cultivars and landraces and exhibited 100% monomorphism (data not shown).
Total number of amplified products was 78 bands ranging from 150 to 2200 bp and 36 bands (46%) of them were polymorphic. Maximum and minimum
bands generated by ISSR 3(UBC 852) (13 bands & 100% polymorphic) and ISSR 5 (UBC 840) (five band and monomorphic), respectively. The average of amplified and polymorphic bands per each primer was 8.7 and 4.0, respectively. Amplified bands information related to each primer is giving in Table 2. The studied primer sequences were composed of di-, tri-, tetra- and panta-nucleotide repeat sequences. The polymorphism observed in the case of tri, tetra and panta-nucleotide repeat primers (ISSR 6 (UBC 845, ISSR 3(UBC 852 and ISSR 1 (UBC 876)).
SSR analysis fingerprinting of wheat cultivars and landraces: In the present study, four primer pairs flanking simple sequence repeats that employed to investigate the level of polymorphism among the 11 wheat landraces, only two of them showed clear and reproducible products (Table 3). The PCR product obtained using the primers pair for marker Wmc596 is depicted in Fig. 6A. The PCR products were 3 fragments. Two of them exhibited more than 67% polymorphism among the used cultivars and landraces. The PCR product obtained using the primers pair for marker Wmc603is illustrated in Fig. 6B. The products were three fragments, revealed 100% polymorphism among the 11 wheat cultivars and landraces.
Genetic relationships as revealed by RAPD, ISSR and SSR markers and cluster analysis: To examine the genetic relationships among the 11 wheat cultivars and landraces, the data scored from the 10, 9 and 2 RAPD, ISSR and SSR primers respectively were compiled and analyzed using the Dice similarity coefficient. The genetic similarity matrices based on the Dice coefficients are shown in Table 4.
Table 4: Genetic similarity (GS) matrices computed according to Dice coefficient from RAPD, ISSR and SSR markers of 11 Egyptian and Saudi wheat cultivars and landraces (1) Sakha 93; (2) Sods 1; (3) Sods 4; (4) Gmiza 9; (5) Sohag 3; (6) Hmees; (7) Al-Kaseem; (8) Hegazi; (9) Dubai 1; (10) Abo-Sakr; (11) Nagran
1 2 3 4 5 6 7 8 9 10 11
732
Fig. 6: SSR fingerprinting of 11 Egyptian and Saudi wheat cultivars and landraces. MW: are 1 kb. ladder. (1) Sakha 93; (2) Sods 1; (3) Sods 4; (4) Gmiza 9; (5) Sohag 3; (6) Hmees; (7) Al-Kaseem; (8) Hegazi; (9) Dubai 1; (10) Abo-Sakr; (11) Nagran. (A) Primer Wmc596; (B) Wmc603. (-PCR) is the negative control
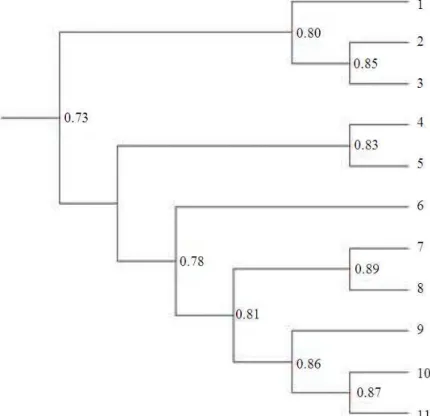
Fig. 7: RAPD’s, ISSR’s and SSR,s phylogenetic analysis among 11 Egyptian and Saudi wheat cultivars and landraces. (1) Sakha 93; (2) Sods 1; (3) Sods 4; (4) Gmiza 9; (5) Sohag 3; (6) Hmees; (7) Al-Kaseem; (8) Hegazi; (9) Dubai 1; (10) Abo-Sakr; (11) Nagran
The data showed genetic similarity ranged between 58.8 % and 88.7%.The highest genetic similarity was 88.7% between Hmees and Al-Kaseem, while the lowest genetic similarity was 58.8% between Gmiza 9 and Nagran landraces.
UPGMA clustering dendrogram based on DICE similarity index was obtained (Fig. 7). The dendrogram cluster diagram classified the evaluated genotypes in three major clusters corresponding to the cultivation
733 divided into two subclusters, the first subcluster contains Hmees and Al-Kaseem landrace cultivars with GS of 88.7%, while the second subgroup consists of four landraces, Dubai 1, Abo-Sakr and Nagran with GS more than 86%. The last Saudi wheat landrace cultivar, Hegazi, was falling outside the three major clusters, revealing around 78% similarity with the rest of the five Saudi landrace cultivars. The RAPD’s, ISSR’s and SSR’s have confirmed each other and the combined results were realistic, when the dendrogram clearly separates the analyzed wheat landraces into four major groups and these analysis logically close to the nature distribution (geographical distribution) of the studied 11 wheat cultivars and landraces.
DISCUSSION
In this study, some morphological and molecular characterizations were applied, in order to be used as different tools for wheat cultivars and landraces breeding programs and improvement. The morphological analysis of different wheat cultivars recognized that there is a direct relationship between the effect of salinity on plant growth and productivity (Fig. 1-3). The recorded effects of the salinity stress on fresh and dry weight, plant length and flowering time of the different wheat cultivar plants was in agreement with previous research (Cutler et al., 2010 and Kumar and Wigge, 2010). They recorded that the growth and productivity of plants are greatly affected by environmental factors such as drought, low temperature and soil salinity and they adapt their growth and development in response to perceived stress. To withstand environmental stresses, plants have evolved highly integrated sensing and response signaling pathways that regulate developmental processes, such as growth and flowering. In general, a stress signaling pathway of plants comprises a sensor, signal transduction and a response. The sensor perceives adverse environmental conditions (Cutler et al., 2010). In Arabidopsis thaliana, several perception and signaling pathways have been identified for the response to high salinity in soil, including the salt overly sensitive pathway and the phytohormone abscisic acid (ABA)-dependent and-independent transcriptional regulation pathways (Mahajan et al., 2008). Moreover, they report that floral initiator Shk1 Kinase Binding protein1 (SKB1) and Histone4 arginine3 (H4R3) symmetric dimethylation (H4R3sme2) integrate responses to plant developmental progress and salt stress. SKB1 associates with chromatin and thereby increases the H4R3sme2 level to suppress the transcription of Flowering Locus C (FLC) and a number of stress-responsive genes. During salt stress, the H4R3sme2 level is reduced, as a
consequence of SKB1 disassociating from chromatin to induce the expression of FLC and the stress-responsive genes. Mutation of SKB1 results in salt hypersensitivity, late flowering and growth retardation. In agreement with these previous findings, the wheat cultivar Sohag 3 that show reduction in DW, FW and plant length in response to salt stress, also showed earliness in flowering time. In disagreement with the previous results, the DW, FW and plant length of some cultivars such as Sods 4 was hardly affected, but the flowering time did not respond to the salt stress. According to the study of (Pandey et al., 2009), these results might be due to a mutation in one of sensing and response signaling pathway genes that mediating regulation of developmental processes, such as growth and flowering time.
RAPDs were proved to be useful as genetic markers in the case of self-pollinating species with a relatively low level of intraspecific polymorphism, such as hexaploid wheat and cultivated wheat. Although major bands from RAPD reactions are highly reproducible, minor bands can difficult to repeat due to random priming nature of this PCR reaction and potential confounding effects associated with co-migration with other markers (Tessier et al., 1998). In present study, RAPD analyses revealed, 74 out of 141 bands (52%) were polymorphic. The number of alleles ranged from 8 to 21 per primer, with an average of 14.1 per primer (Table 1). This data was close to the study of (Sun et al., 1998), when detected 62.5% polymorphism among 46 genotypes of T. aestivum and T. spelta.
734 a common ancestor between the wheat cultivars or landraces which led to a narrow genetic diversity.
It was reported that SSRs are highly variable and therefore able to distinguish closely genetically related plant genotypes (Manifesto et al., 1999). According to Somers et al. (2004) the used SSR markers are closely linked in a position close to the centromere of wheat chromosome 7A. in the present research, the number of alleles per marker ranged from 2 to 3 with an average of 2.5 alleles per locus (Fig. 6). Microsatellites are typically multiallelic markers (Matsuoka et al., 2002) with heterozygosity values much higher than those of RFLPs (McCouch et al., 1997).
CONCLUSION
In conclusion, the use of molecular genetic markers such as RAPD, ISSR and SSR has verified a considerable genetic diversity and genetic relationship within and between Egyptian and Saudi wheat cultivars (Fig. 4-6). Surprisingly, we discovered that the high level of diversity seemed to be in contrast with the high selfing rate in wheat plants. These results were in agreement with previous results found in Pakistani wheat cultivars analyzed with protein markers (Tahir et al., 1996) and Italian wheat cultivars analyzed with RAPDs (Barcaccia et al., 2002). Therefore, the higher diversity observed within and among the Egyptian and Saudi wheat cultivars can be explained by a long evolutionary history in both countries.
Our study provides the first analysis of genetic variability and relationship between Egyptian wheat cultivars and Saudi Arabian wheat landraces. It demonstrated the potential efficiency of molecular markers in wheat cultivars and landraces classification and indicated the feasibility of a comprehensive effort to determine the relationships among wheat landraces using some morphological and molecular markers. Landraces can still be found in isolated and marginal areas, such as mountains and oases where traditional landraces are still grown. Very little is known about the genetic diversity present in these wheat landrace. Further collection, evaluation and utilization of local germplasm, is clearly a high priority in wheat improvement.
REFERENCES
Akkaya, M.S., A.A. Bhagwat and P.B. Cregan, 1992. Length polymorphisms of simple sequence repeat DNA in soybean. Genetics, 132: 1131-1139. Altintas, S., F. Toklu, S. Kafkas, B. Kilian and A.
Brandolini, 2008. estimating genetic diversity in durum and bread wheat cultivars from turkey using AFLP and SAMPL markers. Plant Breed., 127: 9-14. DOI: 10.1111/j.1439-0523.2007.01424.x
Barcaccia, G., L. Molinari, O. Porfiri and F. Veronesi, 2002. Molecular characterization of emmer (Triticum dicoccon Schrank) Italian landraces. Genet. Resour. Crop. Evol., 49: 417-428.
Cutler, S.R., P.L. Rodriguez, R.R. Finkelstein and S.R. Abrams, 2010. Abscisic acid: Emergence of a core signaling network. Annu. Rev. Plant Biol., 61: 651-679. Dreisigacker, S., P. Zhang, M.L. Warburton, B.
Skovmand and D. Hoisington et al., 2005. Genetic diversity among and within CIMMYT wheat landrace accessions investigated with SSRs and implications for plant genetic resources management. Crop Sci., 45: 653-661. DOI: 10.2135/cropsci2005.0653
Ercan, S., F. Ertugrul, Y. Aydin and F. Akfirat-Senturk
et al., 2010. An EST-SSR marker linked with yellow rust resistance in wheat. Biol. Plantarum, 54: 691-696. DOI: 10.1007/s10535-010-0122-z Gostimsky, S.A., Z.G. Kokaeva and F.A. Konovalov,
2005. Studing plant genome variation using molecular markers. Russ. J. Genet., 41: 480-492. PMID: 15909909
Karakas, O., F. Gurel and A. A. Uncuoglu, 2010. Exploiting a wheat EST database to assess genetic diversity. Genet. Mol. Biol., 33: 719-730. DOI: 10.1590/S1415-47572010005000094
Kumar, S.V. and P.A. Wigge, 2010. H2A.Z-containing nucleosomes mediate the thermosensory response in Arabidopsis. Cell, 140: 136-147. DOI: 10.1016/j.cell.2009.11.006
Mahajan, S., G.K. Pandey and N. Tuteja, 2008. Calcium- and salt-stress signaling in plants: Shedding light on SOS pathway. Arch. Biochem. Biophys., 471: 146-158. PMID: 18241665
Manifesto, M.M., A.R. Schlatter, H.E. Hopp, E.Y. Suarez and J. Dubcovsky, 1999. bread wheat (triticum aestivum) fingerprinting using microsatellites. Proceedings of the Plant and Animal Genome VI, Conference, Jan. 17-21, Town and Country Hotel, San Diego, California.
Matsuoka, Y., S.E. Mitchell, S. Kresovich, M. Goodmann and J. Doebley, 2002. Microsatellites in Zea – variability, patterns of mutations and use for evolutionary studies. Theor. Applied Genet., 104: 436-450.
McCouch, S.R., X. Chen, O. Panaud, S. Xu and Y. Temnykh et al., 1997. Microsatellite marker development, mapping and applications in rice genetics and breeding. Plant Mol. Biol., 35: 89-99. DOI: 10.1023/A:1005711431474
735 Okumus, A., 2007. Genetic variation and relationship
between Turkish flint maize landraces by RAPD markers. Am. J. Agric. Biol. Sci., 2: 49-53. DOI: 10.3844/ajabssp.2007.49.53
Pandey, S., D.C. Nelson and S.M. Assmann, 2009. Two novel GPCR-type G proteins are abscisic acid receptors in Arabidopsis. Cell, 136: 136-148. DOI: 10.1016/j.cell.2008.12.026
Rahman, M.A., S.M.M. Rahman, M.A. Jalil, S.N. Uddin and M.M. Rahman, 2006. Molecular characterization of black Bengal and Jamuna Pari goat breeds by RAPD markers. Am. J. Anim. Vet. Sci., 1: 17-22. DOI: 10.3844/ajavsp.2006.17.22 Sofalian, O., Chaparzadeh, N., javanmard, A., and
M.S., Hejazi, 2008. Study the genetic diversity of wheat landraces from northwest of Iran based on ISSR molecular markers. Int. J. Agric. Biol., 10: 465-468.
Sneath, P.H.A. and R.R. Sokal, 1973. Numerical Taxonomy: The Principles and Practice of Numerical Classification. 1st Edn., Freeman, San Francisco, pp: 573.
Somers, D.J., P. Isaac and Keith Edwards, 2004. A high-density microsatellite consensus map for bread wheat (Triticum aestivum L.). Theor. Applied Gen., 109: 1105-1114. DOI: 10.1007/s00122-004-1740-7
Song, Q.J., E.W. Fichus and P.B. Cregan, 2002. Characterization of trinucleotide SSR motifs in wheat. Theor. Applied Genet., 104: 286-293. PMID: 12582699
Sun, X.M., D.D. Patel, B.L. Knight and A.K. Soutar, 1998. Influence of genotype at the Low Density Lipoprotein (LDL) receptor gene locus on the clinical phenotype and response to lipid-lowering drug therapy in heterozygous familial
hypercholesterolaemia. Familial
hypercholesterolaemia regression study group. Atherosclerosis, 136:175-85. PMID: 9544745
Tahir, M., T. Turchetta, R. Anwar and D. Lafiandra, 1996. Assessment of genetic variability in hexaploid wheat landraces of Pakistan based on polymorphism for HMW glutenin subunits. Genet. Resour. Crop Evol., 43: 221-220. DOI: 10.1007/BF00123273
Tanyolac, B., 2003. Inter-simple sequence repeat (ISSR) and RAPD variation among wild barley (Hordeum. vulgare subsp. spontaneum) populations from west Turkey. Genet. Resour. Crop Evol., 50: 611-614. DOI: 10.1023/A:1024412814757
Tautz, D., 1989. Hypervariability of simple sequences as a general source for polymorphic DNA markers. Nucl. Acids Res., 17: 6463-6471. PMID: 2780284 Tessier, C., J. David, P. Thes, J.M. Boursiquot and A.
Charrier, 1998. Optimization of the choice of molecular markers for varietal identification in Vitis vinifera. Theor. Applied Genet., 98: 171-178. DOI: 10.1007/s001220051054
Volis, S., S. Mendlinger, Y. Turuspekov, U. Esnazaov and S. Abugalieva et al., 2001. Allozyme variation in turkmenian populations of wild barley, Hordeum spontaneum koch. Ann. Bot., 87: 435-446. DOI: 10.1006/anbo.2000.1354
Vos, P., R. Hogers, M. Bleeker, M. Reijans and T. Van Der Lee et al., 1995. AFLP: A new technique for DNA fingerprinting. Nucleic Acids Res., 23: 4407-4414. PMID: 7501463
Williams, J.G., A.R. Kubelik, K.J. Livak, J.A. Rafalski and S.V. Tingey, 1990. DNA polymorphisms amplified by arbitrary primers are useful as genetic markers. Nucl. Acids Res., 18: 6531-6535. PMID: 1979162