Exploiting a wheat EST database to assess genetic diversity
Ozge Karakas
1, Filiz Gurel
2and Ahu Altinkut Uncuoglu
11
The Scientific and Technological Research Council of Turkey, Marmara Research Center,
Genetic Engineering and Biotechnology Institute, Gebze-Kocaeli, Turkey.
2
Department of Molecular Biology and Genetics, Istanbul University, Istanbul, Turkey.
Abstract
Expressed sequence tag (EST) markers have been used to assess variety and genetic diversity in wheat (Triticum aestivum). In this study, 1549 ESTs from wheat infested with yellow rust were used to examine the genetic diversity of six susceptible and resistant wheat cultivars. The aim of using these cultivars was to improve the competitiveness of public wheat breeding programs through the intensive use of modern, particularly marker-assisted, selection tech-nologies. The F2individuals derived from cultivar crosses were screened for resistance to yellow rust at the seedling
stage in greenhouses and adult stage in the field to identify DNA markers genetically linked to resistance. Five hun-dred and sixty ESTs were assembled into 136 contigs and 989 singletons. BlastX search results showed that 39 (29%) contigs and 96 (10%) singletons were homologous to wheat genes. The database-matched contigs and sin-gletons were assigned to eight functional groups related to protein synthesis, photosynthesis, metabolism and en-ergy, stress proteins, transporter proteins, protein breakdown and recycling, cell growth and division and reactive oxygen scavengers. PCR analyses with primers based on the contigs and singletons showed that the most polymor-phic functional categories were photosynthesis (contigs) and metabolism and energy (singletons). EST analysis re-vealed considerable genetic variability among the Turkish wheat cultivars resistant and susceptible to yellow rust disease and allowed calculation of the mean genetic distance between cultivars, with the greatest similarity (0.725) being between Harmankaya99 and Sönmez2001, and the lowest (0.622) between Aytin98 and Izgi01.
Key words:biodiversity, EST, genetic diversity,Triticum, yellow rust. Received: October 29, 2009; Accepted: June 24, 2010.
Introduction
Wheat (Triticum aestivumL.) is one of the most im-portant crops in the world and is grown in all agricultural regions of Turkey. The total area cultivated worldwide and in Turkey is 210 and 9.4 million ha, respectively (Zeybek and Yigit, 2004). The allohexaploid wheat genome (2n = 6x = 42) is one of the largest among crop species, with a hap-loid size of 16 billion bp (Bennett and Leitch, 1995), and its genetics and genome organization have been extensively studied using molecular markers (Yuet al., 2004; Ercanet al., 2010; Akfirat-Senturket al., 2010).
PCR-based molecular markers such as simple se-quence repeats (SSR) (Plaschke et al., 1995), restriction fragment length polymorphism (RFLP) (Nagaoka and Ogi-hara, 1997), amplified fragment length polymorphism (AFLP) (Gülbitti-Onariciet al., 2007), selective amplifica-tion of microsatellite polymorphic loci (SAMPL) (Altintas et al., 2008) and random amplified polymorphic DNA (RAPD) (Asifet al., 2005) are easy to use and show a high
degree of polymorphism. A number of wheat genetic maps have been constructed using PCR based markers (Liet al., 2007).
In recent year, expressed-sequence tags (ESTs) have become a valuable tool for genomic analyses and are cur-rently the most widely used approach for sequencing plant genomes, both in terms of the number of sequences and to-tal nucleotide counts (Rudd, 2003). EST analysis provides a simple strategy for studying the transcribed regions of genomes, and renders complex, highly redundant genomes such as that of wheat amenable to large-scale analysis. The number of ESTs and cDNA sequences in public databases such as GenBank has increased exponentially in recent few years, and EST-based markers have been used to distin-guish varieties and assess genetic diversity in wheat (Kan-tetyet al., 2002; Leighet al., 2003).
Yellow rust, a destructive disease of wheat triggered by the biotrophic fungusPuccinia striiformisf. sp. tritici (Chen 2005), is the most frequent and important cereal dis-ease in Turkey, where it causes grain yield losses of 40%-60% and lowers the quality of cereal products (Zeybek and Yigit, 2004). In this study, an EST database for yellow rust-infested wheat was used, in conjunction with a
multi-Genetics and Molecular Biology, 33, 4, 719-730 (2010)
Copyright © 2010, Sociedade Brasileira de Genética. Printed in Brazil www.sbg.org.br
Send correspondence to Ahu Altinkut Uncuoglu. Deputy Director of the Genetic Engineering and Biotechnology Institute, Marmara Re-search Center, TUBITAK, P.O. Box 21, 41470 Gebze-Kocaeli, Tur-key. E-mail: ahu.uncuoglu@mam.gov.tr.
variate statistical package (MVSP v.3.1), to assess the ge-netic diversity of yellow rust resistant and susceptible wheat genotypes. For this, EST sequences were assembled into longer contiguous sequences (contigs) using Vector NTI 10.0 software. Difficulties related to sequencing errors and the determination of orthology associated with the use of ESTs for systematics can be minimized by using several reads to assemble contigs and EST clusters for each region (Parkinsonet al., 2002; Torreet al., 2006). The knowledge gained about the genetic constitution and relationships of genotypes using this approach should prove useful in the optimization of wheat breeding programs.
Materials and Methods
Plant material and evaluations
Six homozygous bread wheat genotypes (three yel-low rust-resistant cultivars: PI178383, Izgi01, Sönmez2001, and three yellow rust-susceptible cultivars: Harmankaya99, ES14, Aytin98) were obtained from the Anatolian Agricultural Research Institute, Eskisehir, Tur-key. The resistance of the parental cultivars and F2 genera-tion was tested in greenhouses by applying uredospores. Two weeks after the inoculation the infection was scored on a scale of 0-9 (McNealet al., 1971), with scores of 0-6 indicating a low infection and 7-9 indicating a high infec-tion. The disease score for PI178383, Izgi01 and Sönmez2001 was 0 while that of Harmankaya99, ES14 and Aytin98 was 8, this confirming the resistance and suscepti-bility of the parental genotypes.
Analysis of wheat yellow rust ESTs
ESTs from a yellow rust-infected wheat cDNA li-brary (TA117G1X) were selected from the GrainGenes website and processed by means of VecScreen database searches to remove undesired vector fragments from the se-quences. The Vector NTI 10.0 contig express program (InforMax, Bethesda, MD, USA) was used to construct contig tags from the EST sequences and the Contig Express module was used to assemble small fragments in text or chromatogram formats into contigs (Lu and Moriyama, 2004). Singletons were constructed from unassembled ESTs. The EST sequences were aligned and analyzed with ClustalW v.1.82 to identify conserved domains. Functional annotation was done using the BlastX algorithm of the Ba-sic Alignment Search Tool (Altschulet al., 1990). PCR primers for the contigs and singletons selected for further characterization were designed with Primer Premier 5.0 and Primer 3.0 software (Figure 1). EST-derived contig and singleton primers were used to assess the genetic diversity of the six wheat genotypes.
PCR analyses of contigs and singletons
Total genomic DNA was extracted from the leaves of resistant and susceptible plants using the method of
Wei-ning and Langridge (1991) as modified by Song and Henry (1995). Genomic DNA amplifications with sense and anti-sense primers were done using a PTC-100 MJ thermocycler (MJ Research, Watertown, MA) in a 25mL reaction
vol-ume. Each reaction contained 1XTaq buffer (MBI Fer-mentas, Germany), 2.5 mM MgCl2 (MBI Fermentas), 0.2 mM dNTP (MBI Fermentas), 400 nM of forward primer, 400 nM of reverse primer, 0.625 U ofTaq polymer-ase/mL (MBI Fermentas) and 100 ng of genomic DNA. The
thermal cycling parameters were: 3 min at 94 °C (initial de-naturation), 37 cycles of 1 min at 94 °C, 1 min at 40-58 °C (depending on the annealing temperature) and 1 min at 72 °C, followed by a final extension at 72 °C for 10 min. PCR products were separated in 2% agarose gels, stained with ethidium bromide and examined under UV light.
Genetic similarity estimation and cluster analyses
Each contig and singleton band was scored as absent (0) or present (1) for the different cultivars and the data were entered into a binary matrix as discrete variables (‘1’ for presence and ‘0’ for absence of a homologous fragment). Only distinct, reproducible, well-resolved fragments were scored and the data were analyzed using MVSP 3.1 software (Kovach, 1999). This software package was also used to
cal-720 Karakaset al.
culate Jaccard (1908) similarity coefficients to construct a dendrogram by a neighbour-joining algorithm.
Results
Assembly of contigs and blast analysis
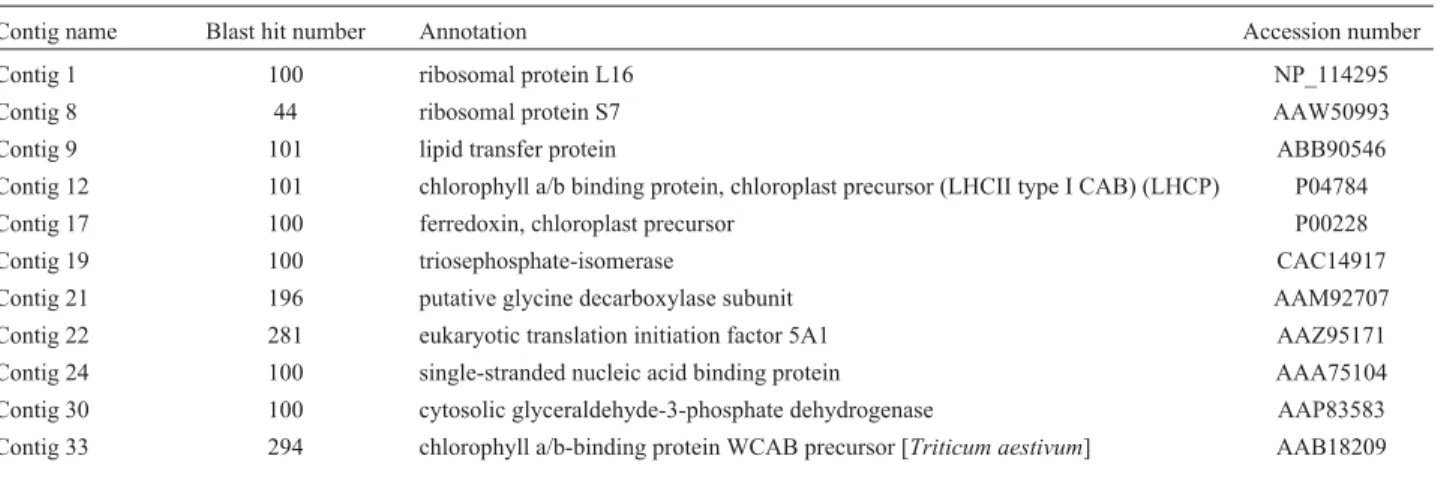
Table 1 summarizes the characteristics of the data-base used in this analysis. 1549 ESTs were selected from a yellow rust-infested wheat cDNA library (TA117G1X) and used to assemble 136 contigs. The number of individual ESTs belonging to each contig ranged from 2 to 57. Single-tons were derived from unassembled ESTs and accounted for 72.63% of ESTs. Tables 2 and 3 show the results of the NCBI database searches done using the contig and single-ton sequences. The BlastX searches revealed that 39 contigs (29%) were homologous to wheat genes (Figure 2). Contigs 3, 4, 11, 13, 16 and 112 did not match any organ-ism. Contig 77 matched a sequence of unknown function (data not shown) while other contigs (71%) showed homo-logy to genes of known function. The BlastX search also showed that 96 singletons (10%) were homologous to wheat genes (Figure 3), whereas 147 singletons (14%) did not match any organism and had no functional annotation (data not shown). The 39 contigs and 96 singletons that
matched wheat proteins were assigned to eight functional groups that included protein synthesis, photosynthesis, me-tabolism and energy, stress proteins, transporter proteins, protein breakdown and recycling, cell growth and division and reactive oxygen scavengers. Photosynthesis was the major functional category of contigs, with nine proteins (22%), whereas cell growth and division was the smallest, with one protein (3%) (Figure 2). Metabolism was the ma-jor functional category of singletons, with 37 proteins (38%), whereas protein breakdown and recycling and cell growth and divison were the smallest functional categories, with three proteins (3%) (Figure 3). Tables 4 and 5 show the sense and antisense primers used to assess the genetic diversity of wheat cultivars; these primers were designed
A wheat EST database for diversity 721
Table 1- General characteristics of ESTs from yellow rust-infested wheat (Triticum aestivum).
Database characteristics
Library name TA117G1X
Stage
-Total number of ESTs 1,549
Contigs 136
Total contig size (bp) 80,241
Unigenes 1,125 (72.6%)
EST contigs 560
Singletons 989 (63.8%)
Contaminated ESTs 16
Figure 2- Classification of contigs homologous to proteins of known function.
Figure 3- Classification of singletons homologous to proteins of known function.
Table 2- Contigs that showed homology to genes with proteins matchingTriticum aestivumidentified in a BlastX search of the NCBI database.
Contig name Blast hit number Annotation Accession number
Contig 1 100 ribosomal protein L16 NP_114295
Contig 8 44 ribosomal protein S7 AAW50993
Contig 9 101 lipid transfer protein ABB90546
Contig 12 101 chlorophyll a/b binding protein, chloroplast precursor (LHCII type I CAB) (LHCP) P04784
Contig 17 100 ferredoxin, chloroplast precursor P00228
Contig 19 100 triosephosphate-isomerase CAC14917
Contig 21 196 putative glycine decarboxylase subunit AAM92707
Contig 22 281 eukaryotic translation initiation factor 5A1 AAZ95171
Contig 24 100 single-stranded nucleic acid binding protein AAA75104
Contig 30 100 cytosolic glyceraldehyde-3-phosphate dehydrogenase AAP83583
722 Karakaset al.
Contig name Blast hit number Annotation Accession number
Contig 34 65 jasmonate-induced protein AAR20919
Contig 35 44 oxygen-evolving enhancer protein 2, chloroplast precursor (OEE2) Q00434
Contig 39 100 geranylgeranyl hydrogenase AAZ67145
Contig 40 100 chlorophyll a/b-binding protein WCAB precursor AAB18209
Contig 46 102 chlorophyll a/b-binding protein WCAB precursor AAB18209
Contig 49 31 oxygen-evolving complex precursor AAP80632
Contig 52 9 metallothionein-like protein 1 (MT-1) P43400
Contig 55 198 glycine-rich RNA-binding protein BAF30986
Contig 57 100 type 1 non-specific lipid transfer protein precursor CAH04983
Contig 58 33 RUB1-conjugating enzyme AAP80608
Contig 63 103 oxygen-evolving enhancer protein 1, chloroplast precursor (OEE1) (33 kDa subunit of oxygen evolving system of photosystem II) (OEC 33 kDa subunit) (33 kDa thylakoid membrane protein)
P27665
Contig 65 101 acidic ribosomal protein P2 AAP80619
Contig 66 199 cyclophilin A-1 AAK49426
Contig 73 190 dehydroascorbate reductase AAL71854
Contig 75 63 metallothionein AAP80616
Contig 80 33 wali7 AAC37416
Contig 90 52 putative membrane protein ABB90549
Contig 91 100 cold shock protein-1 BAB78536
Contig 93 155 Ps16 protein BAA22411
Contig 96 109 elongation factor 1-alpha (EF-1-alpha) Q03033
Contig 99 72 histone H1 WH1A.2 AAD41006
Contig 105 131 ribulose-bisphosphate carboxylase (EC 4.1.1.39) small chain precursor (clone pWS4.3) - wheat
RKWTS
Contig 110 82 cytochrome b6-f complex iron-sulfur subunit, chloroplast precursor (Rieske iron-sulfur protein) (plastohydroquinone:plastocyanin oxidoreductase iron-sulfur protein) (ISP) (RISP)
Q7X9A6
Contig 113 103 lipid transfer protein 3 AAP23941
Contig 122 163 ribulose-1,5-bisphosphate carboxylase/oxygenase small subunit BAB19814
Contig 133 100 ribosomal protein L36 AAW50980
Contig 135 100 60s ribosomal protein L21 AAP80636
Contig 136 100 histone H2A.2.1 P02276
Table 2 (cont).
Table 3- Singletons showing homology to genes with proteins matchingTriticum aestivumidentified in a BlastX search of the NCBI database.
Singleton name Blast hit number Annotation Accession number
CA599282 199 ATP synthase CF1 alpha subunit NP_114256
CA599218 88 ribulose-1,5-bisphosphate carboxylase/oxygenase small subunit BAB19811
CA598725 191 ribosomal protein L14 NP_114294
CA597765 119 RuBisCO large subunit-binding protein subunit alpha, chloroplast precursor (60 kDa chaperonin subunit alpha) (CPN-60 alpha)
P08823
CA597760 100 type 1 non-specific lipid transfer protein precursor CAH69210
CA597766 3 aintegumenta-like protein ABB90555
CA597808 116 geranylgeranyl hydrogenase AAZ67145
CA597830 100 14-3-3 protein AAR89812
CA597851 49 plastid glutamine synthetase isoform GS2c AAZ30062
CA597983 100 GRAB2 protein CAA09372
CA598020 103 protein H2A.5 (wcH2A-2) Q43213
CA598034 100 histone deacetylase AAU82113
A wheat EST database for diversity 723
Singleton name Blast hit number Annotation Accession number
CA598128 100 probable light-induced protein AAP80856
CA598130 100 tubulin beta-2 chain (beta-2 tubulin) Q9ZRB1
CA598143 172 thioredoxin M-type, chloroplast precursor (TRX-M) Q9ZP21
CA598151 100 lipid transfer protein precursor AAG27707
CA598174 200 S28 ribosomal protein AAP80664
CA598181 110 pathogenisis-related protein 1.2 CAA07474
CA598182 2 pathogenisis-related protein 1.2 CAA07474
CA598187 98 VER2 BAA32786
CA598196 1 putative cytochrome c oxidase subunit AAM92706
CA598235 100 plasma membrane intrinsic protein 1 AAF61463
CA598239 151 triosephosphate translocator AAK01174
CA598244 14 glycosyltransferase CAI30070
CA598256 100 heat shock protein 80 AAD11549
CA598258 22 fasciclin-like protein FLA26 ABI95416
CA598286 80 elongation factor 1-beta (EF-1-beta) P29546
CA598296 106 beta-1,3-glucanase precursor AAD28734
CA598314 11 oxygen-evolving enhancer protein 2, chloroplast precursor (OEE2) Q00434
CA598347 114 putative ribosomal protein S18 AAM92708
CA598359 198 sucrose synthase type I CAA04543
CA598366 105 receptor-like kinase protein AAS93629
CA598421 121 ribulose-bisphosphate carboxylase (EC 4.1.1.39) small chain precursor (clone pWS4.3)
RKWTS
CA598422 75 wali5 AAA50850
CA598432 99 ribosomal protein P1 AAW50990
CA598476 100 LRR19 AAK20736
CA598485 100 ribulose-bisphosphate carboxylase CAA25058
CA598489 64 histone H2A AAB00193
CA598518 157 phosphoribulokinase; ribulose-5-phosphate kinase CAA41020
CA598523 100 ribosomal protein L19 AAP80858
CA598557 79 type 2 non-specific lipid transfer protein precursor CAH69201
CA598577 252 ferredoxin, chloroplast precursor P00228
CA598584 258 putative fructose 1-,6-biphosphate aldolase CAD12665
CA598630 101 translationally-controlled tumor protein homolog (TCTP) Q8LRM8
CA598637 100 histone H2A AAB00193
CA598672 100 lipid transfer protein ABB90546
CA598674 100 glutathione transferase F6 CAD29479
CA598677 100 ribulose-1,5-bisphosphate carboxylase/oxygenase small subunit BAB19812
CA598687 55 wali6 AAC37417
CA598691 100 type 1 non-specific lipid transfer protein precursor CAH04983
CA598694 45 cold-responsive LEA/RAB-related COR protein AF255053
CA598700 195 fructan 1-exohydrolase CAD48199
CA598719 24 50S ribosomal protein L9, chloroplast precursor (CL9) Q8L803
CA598755 100 type 1 non-specific lipid transfer protein precursor CAH69190
CA598762 95 cysteine synthase (O-acetylserine sulfhydrylase) (O-acetylserine (thiol)-lyase) (CSase A) (OAS-TL A)
P38076
CA598818 100 putative fructose 1,6-biphosphate aldolase CAD12665
CA598837 126 glutathione S-transferase AAD56395
CA598848 167 glyceraldehyde-3-phosphate dehydrogenase AAW68026
based on the contig and singleton sequences that were ho-mologous to wheat genes.
EST-derived contig and singleton polymorphisms
PCR analyses with the contig and singleton primers showed that the most polymorphic functional categories
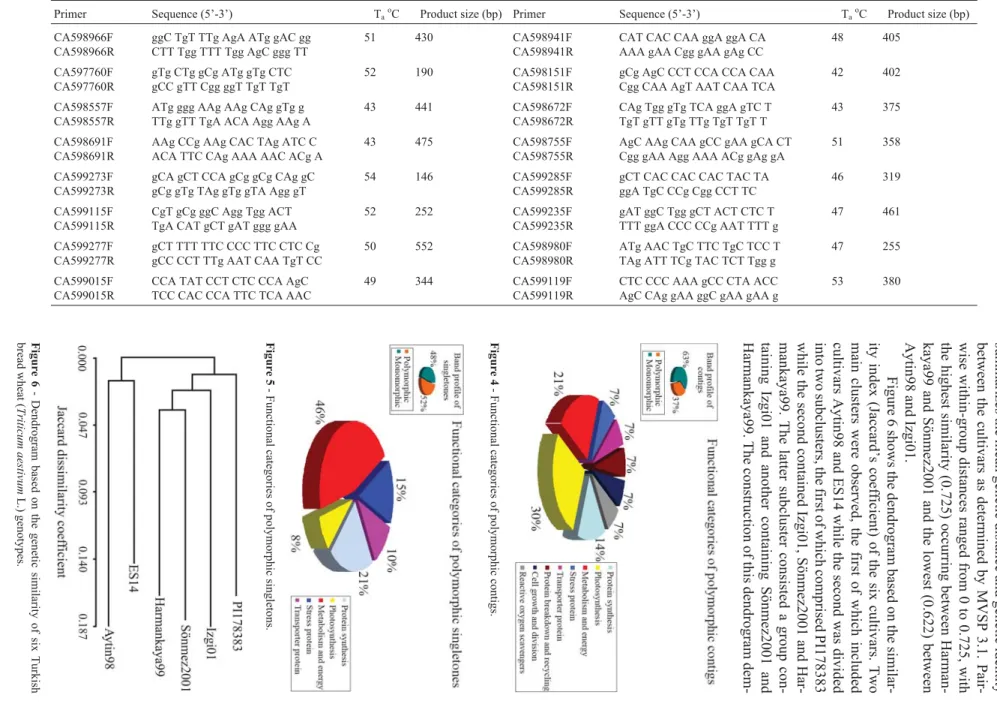
were photosynthesis (30%) and metabolism and energy (46%) for contigs and singletons, respectively (Figures 4 and 5). Of the 39 contig and 92 singleton primers used to characterize the genetic diversity of the six wheat geno-types, 14 contig and 48 singleton primers were polymor-phic in susceptible and resistant wheat cultivars. Table 6
724 Karakaset al.
Singleton name Blast hit number Annotation Accession number
CA598850 42 putative proteinase inhibitor-related protein AAS49905
CA598919 43 ferredoxin-NADP(H) oxidoreductase CAD30024
CA599166 137 cold acclimation induced protein 2-1 AAY16797
CA599172 135 stress responsive protein AAY44603
CA599235 100 beta-expansin TaEXPB3 AAT99294
CA599238 77 oxygen-evolving enhancer protein 2, chloroplast precursor (OEE2) (23 kDa subunit of oxygen evolving system of photosystem II) (OEC 23 kDa subunit) (23 kDa thylakoid membrane protein)
Q00434
CA599257 101 glyceraldehyde-3-phosphate dehydrogenase AAW68026
CA599262 196 histone H2A.2.1 P02276
CA599265 2 phosphoglycerate kinase, chloroplast precursor P12782
CA599271 100 ribosomal protein L18 AAW50985
CA599273 68 outer mitochondrial membrane protein porin (voltage-dependent anion-selective channel protein) (VDAC)
P46274
CA599277 103 putative SKP1 protein CAE53885
CA599285 154 putative lipid transfer protein ABB90547
CA598802 100 ribosomal protein L11 AAW50983
CA598930 100 thioredoxin h CAB96931
CA598940 199 cyc07 AAP80855
CA598941 298 calcium-dependent protein kinase ABY59005
CA598949 100 putative 40S ribosomal protein S3 AAM92710
CA598961 100 ribosomal protein L13a AAW50984
CA598962 57 reversibly glycosylated polypeptide CAA77237
CA598966 282 MAP kinase ABS11090
CA598975 105 (1,3;1,4) beta glucanase CAA80493
CA598980 31 minichromosomal maintenance factor AAS68103
CA599013 100 D1 protease-like protein precursor AAL99044
CA599015 17 putative beta-expansin BAD06319
CA599032 114 tonoplast intrinsic protein ABI96817
CA599049 41 porphobilinogen deaminase AAL12221
CA599099 100 gamma-type tonoplast intrinsic protein AAD10494
CA599101 100 small GTP-binding protein AAD28731
CA599103 19 pre-mRNA processing factor AAY84871
CA599107 82 sedoheptulose-1,7-bisphosphatase, chloroplast precursor (sedoheptulose bisphosphatase) (SBPase) (SED(1,7)P2ase)
P46285
CA599110 199 ribulose bisphosphate carboxylase small chain PWS4.3, chloroplast precursor (RuBisCO small subunit PWS4.3)
P00871
CA599114 3 metallothionein-like protein 1 (MT-1) P43400
CA599115 176 type 1 non-specific lipid transfer protein precursor CAH69199
CA599119 5 putative high mobility group protein CAI64395
CA599121 51 putative proteinase inhibitor-related protein AAS49905
CA599135 257 putative cellulose synthase BAD06322
A wheat EST database for diversity 725
Table 4- Contig primers used for genomic amplifications.
Primer Sequence (5’-3’) TaoC Product size (bp) Primer Sequence (5’-3’) TaoC Product size (bp)
Contig 1F Contig 1R
ACA gAT AgA AgC Agg ACg AA AAg ggT TgA Agg AAT TAT TgT C
50 370 Contig 58F Contig 58R
ggg CAA gAA gAA ggA AgA gg TgA ggg TTA ggg AAg ggA gA
50 267
Contig 8F Contig 8R
CCT CCA CTT CgC TgC TCC CT gCT CCT ggT TgC CgT TCT CC
53 168 Contig 63F Contig 63R
CAg ggA ggT CgC AAg CAA TCA ACC CAA CgT ACg CAT
48 898
Contig 9F Contig 9R
CAA ACT CgA TAg ggA Tgg C gCT TgA TTT gCA TAT Tgg gAC
50 340 Contig 65F Contig 65R
gCT gCC TAT CTg CTT gCT T CCT TTC TCC Agg gAC CTT T
48 295
Contig 12F Contig 12R
ACg CAC ATC ggA CAC gC CAg CTC CCg gTT CTT gg
53 336 Contig 66F Contig 66R
gCg CAT CgT gAT ggA gCT Tgg gAg CCT TTg TTg TTg g
53 302
Contig 17F Contig 17R
gCC ACC TTC TCA gCC ACA TTC gCC ggA ACA CCA AAC
49 366 Contig 73F Contig 73R
CTg gTT TgC TAC TCC Tgg T Tgg CAT CCT TTg TTC TTT C
46 417
Contig 19F Contig 19R
gCg gCA ACT ggA AAT g AgC CCT TgA gCg gAg T
50 350 Contig 75F Contig 75R
gAg ATg gAC gAg ggA gTg AA ATg ggg TCT CCC TTg TTC TT
50 499
Contig 21F Contig 21R
gCC CTC AAg ATT TCA AgC Ag ggg TTT TCg gAC AgT TTT gA
50 516 Contig 80F Contig 80R
gCC AAg gAg TgA ggA Agg TCg ATT CAC ggA ggA gCA
50 412
Contig 22F Contig 22R
ggA CAC CgA TgA gCA CCA AAg TTg ggA ggT TTC Agg
48 363 Contig 90F Contig 90R
gAT TCg CAT CgC AgC ACA gCg gTT AAA CAg ACC CAg T
50 409
Contig 24F Contig 24R
ggT Tgg CTT CTC CTC CCC T CgA gCT TCC TTg CCg TTC A
51 331 Contig 91F Contig 91R
TTT Tgg TCC TTC ggT TTC g TCC TCC Tgg TgC ggT gA
55 248
Contig 30F Contig 30R
gTT gAT gAg gAC CTT gTT TC TTg TTC ggg ggT TTT ATT TT
44 450 Contig 93F Contig 93R
TTC AgC gAg CAC ggC AAA g gAC ACA Agg ATg gAT ggg A
49 307
Contig 33F Contig 33R
ATg TCC CTC TCC TCg ACC TT AgT ggA TCA CCT CgA gCT TC
51 291 Contig 96F Contig 96R
CTg CTg CTg CAA CAA gAT g gTT CCA ATg CCA CCA ATC T
48 302
Contig 34F Contig 34R
ACT TCC gCA gCC TgT ACC TT CCA ACA ATT AgC CCA CTC AC
53 302 Contig 99F Contig 99R
gCA TCT CCC CTC gAT TCC TA CgA CCC CgC TCT TCT CCT TC
51 250
Contig 35F Contig 35R
CAA Tgg CgT CCA CCT CCT gC AgT CCg gTg ATg gTC TTC TTg g
53 444 Contig 105F Contig 105R
CCg ATA ATA CAA TAC CAT TAC TCC TTT TTT gAC CTC
40 434
Contig 39F Contig 39R
ggT gTT CTA CCg CTC CAA gAC gCC CAT TAC CCT TTT
48 354 Contig 110F Contig 110R
CAT CTC gCT CCC CAC CTT TTT gCC CTT TgT TTg TTT
40 356
Contig 40F Contig 40R
ACC CAC TAT ACC CAg gAg gC TCA gAA Cgg gAA gAA gCA gA
51 338 Contig 113F Contig 113R
CAA AAA TAg CgT gCA Agg Tg TTg TTT CCA gTT Tgg TTg gA
50 304
Contig 46F Contig 46R
gCA Agg Cgg TgA AgA ACg CCC TTT ggA CAg gAA CCC
49 506 Contig 122F Contig 122R
AgC AAg gTT ggC TTC gTC CCg AgA ATT AAC AgC Agg AC
50 474
Contig 49F Contig 49R
CTC gTg CCg AAg ACA gAA A CCC TCC CTT Tgg TTg gTT
48 578 Contig 133F Contig 133R
CgT TAg CAg gAg CgA gTg gAg CAA ATC CAg CgA CCT
49 196
Contig 52F Contig 52R
TTg ggT TCA CAg ATT Tgg Agg gAA gCA ATT AAC Agg gAC ACg
50 432 Contig 135F Contig 135R
gCC gCA CAA gTT CTA CCA Cg ggA TTg ggA gTg ACg gTT CT
51 311
Contig 55F Contig 55R
gAg TAC CgC TgC TTC gTC CCA CCT CCg CCA CTg AA
53 286 Contig 136F Contig 136R
CAC CCA CTC CCA AAC CCT C gAT TTC AAg CAA gAA CCA A
44 337
Contig 57F Contig 57R
CAC ggT TTC CAg CAA gCA TTg gCg TTC Agg gTC CTC
726
Karakas
et
al.
Table 5- Singleton primers used for genomic amplifications.
Primer Sequence (5’-3’) TaoC Product size (bp) Primer Sequence (5’-3’) TaoC Product size (bp)
CA598034F CA598034R
AgC CTA AAA AAA AgC ATA Agg AgT CCC gTC AAA AAA
38 418 CA598930F CA598930R
gTg gAC CAT gCA gAT CgA gg ggg ggC AAT TTT TAT TTT Ag
46 366
CA598174F CA598174R
gAC CAA gAA CCg TCT CAT C TCA AgT CTC ACA ACA TCA A
43 263 CA598143F CA598143R
gAT CAA gTg CTg CAA ggT gA TTg TTA TAA Cgg CgC ATC AA
50 279
CA598286F CA598286R
gTT CTC CgA CCT CCA CAC gTC ATC ATC TTC ATC CTT
42 278 CA599110F CA599110R
TCg gCT ACC ACC gTC gCA CC ACC CTC AAT Cgg CCA CAC CT
58 138
CA598347F CA598347R
ggA ACg CAC CTC CTC CCC TC CCA gTC CCg gCA CCT TTg AA
54 326 CA599107F CA599107R
Agg ACA CCA CgA gCA TC CCC CTT ggg AAC AgC Ag
51 241
CA598432F CA598432R
CgC TgA AgA gAA gAA ggA CgC ATA ggA ggA ACC CAC
47 122 CA599218F CA599218R
CCT CCT CTC CTC CgA TAA TA ACA TAg gCA gCT TTC CCA CA
49 420
CA598523F CA598523R
ggA ggA ggA gAg Cgg Cgg C ATA TCC CAg gAg TgA ACg g
50 262 CA598196F CA598196R
ggT CgT TTC gCT CTC CCC ATT TCT CCT CAg CTg gTT
44 158
CA598719F CA598719R
gCC TCA TCC CCC TCC TCC Gc CgA TTC gCT CTT gCT TCC AC
52 266 CA599282F CA599282R
gCg TAg TTC AAg Tgg ggg AAA AAT CAT TTA ggg ggg
42 490
CA598762F CA598762R
ACg gCg ggA Tgg ggg Agg TTT gCT Tgg gAC gAT gAA
44 224 CA598296F CA598296R
gCA CTg CTg gTg gAg ATg gTT Cgg ACg gAT TgA ggC
50 278
CA599271F CA599271R
TCg gCA CgA ggg TAA gAA g AgT TTg gAg CAA Cgg gAg T
49 483 CA598421F CA598421R
CTC CTC TCC TCC gAT AAT A TTg ACC TTC CCT CCC ACC T
47 461
CA598802F CA598802R
gCT CgT CCT CAA CAT CTC TTT CAC CTT CAg gCC ACT
50 214 CA598485F CA598485R
ACC gTT gCT gAC gCT gCC CCC CCA TTg TTC CCC ATT
49 324
CA598725F CA598725R
CAg CgA TAT gCT CgT ATT gg CTC TCA ATT CCT Cgg CAA TC
50 345 CA598584F CA598584R
CCC CTg Agg TgA TTg CTg TCg CCC TTg TAg gTg CCA
50 306
CA599103F CA599103F
TgT CgT CTg CgT ATT ggT g Cgg ACT Tgg TgA CTT gCT A
51 201 CA598818F CA598818R
TCC TTg CTg CCT gCT ACA TCC TCC ATT CTC Cgg TTC
49 362
CA598961F CA598961R
ggA ggA AAA gAg gAA ggA TCA AAT gAg TgT CgC AgA
48 272 CA598677F CA598677R
CgA CTA CCT TAT CCg CTC C ggg TTA CTC CCT TTT TTg A
45 209
CA598949F CA598949R
gTT TgT gAg CgA Tgg CgT TT ATT gAC TTC AgC CTT Tgg gg
51 324 CA598518F CA598518R
TCg gCA CgA ggg AgA AgC ATC ggA Agg Agg TAA AAC
44 444
CA597765F CA597765R
TgA TTT CCT TTA TgC TTg Tg gCT TgT TgC TTg gTg ggg Tg
44 234 CA598700F CA598700R
gAC TCC ATA CAA TCC CCA gCA CCC gTT TTT CCA CAT
47 272
CA598239F CA598239R
ATT CAA CAT CCT CAA CAA gAA ACC CCC AAg gCA CCA
40 372 CA598975F CA598975R
CgC AgT TAg CCA gAg AgA ggA gTT Tgg AgA gCA CgT
51 298
CA598314F CA598314R
ATg gCg TCC ACC TCC TgC TT ggT Tgg TCg ggg TTT gAT TA
50 466 CA598244F CA598244R
ggA gAT ggT Tgg TTg TgT T CCA ggg gTT gTT ggT AAA T
50 378
CA598577F CA598577R
CgA CCT gCC CTA CTC TTg C AAC CCA CCT TgC CTC CAT T
50 125 CA599101F CA599101R
CgT CgT CgC CAC AAg AgT T CgC CCg TgT TCC CCA gAT T
55 363
CA599238F CA599238R
ggC gTC CAC CTC CTg CTT CC TTg TTg TTg ggg TTT gAT TA
44 426 CA597808F CA597808R
CAC CTT CCT CCC TTC CTC CT CAT CTT TgT TgA CCC TCC TT
A wheat EST database for diversity 727
Primer Sequence (5’-3’) TaoC Product size (bp) Primer Sequence (5’-3’) TaoC Product size (bp)
CA598919F CA598919R
TAC TgA TTC TTg TgT CTT A CAC CCT TTA TCT ACT TTT A
41 107 CA598837F CA598837R
gAg AgT gAg gAg TgA gAA gA AAA gCA TTA ggg ATT ggA TA
44 436
CA598848F CA598848R
CCA gAT TTC CTT CCC CAT CAg CAC CAg CAg CAg CCC
47 300 CA598850F CA598850R
ACg CCC AgC CCT CAC AAg A ACg gAC CCA CAC ACA AgC A
51 189
CA599257F CA599257R
TgT TCT CAA CCT CCC CTC C CAA CgT ACT CAg CAC CCA g
50 343 CA599262F CA599262R
CCC ACC CAC TCC CAA ACC CT CCg gCC AgC TCC AgC ACC TC
56 266
CA597851F CA597851R
TTT ggA ggC ggC AgA gTA gTC ggT gAA ggg CgT ggT
49 258 CA598020F CA598020R
gTC ACA TCA TCT TCT CCC T TCC CCA ACA TCA ACT CCg T
47 185
CA598130F CA598130R
CTg ggA ggT ggT gTg TgA Tg ACT TTT TTg gTT gAg ggg AA
46 482 CA598235F CA598235R
gCg AgA Agg AAC AgC AAg TTA gAC ggA CCA CgA Agg
49 618
CA598258F CA598258R
CTC TCC CCC CCT CCC CAg gAg TTC ACC CCC gCC CCg
57 338 CA598359F CA598359R
CCC TgC TgA AAT CAT TgT TAg TTg TCg gAg CTC TTg
44 350
CA598637F CA598637R
CAC CTC gTg AgT CCT CgT Cg TgC ggg TCT TCT TgT TgT CC
52 266 CA598674F CA598674R
AAg gTg CTg gAg gTC TAC AAT CAC ggC TTC TTg ggA
47 230
CA599135F CA599135R
AAg gCg AAg AAg CCA ggT TT Tgg ATT ggA ggA TTg ggg AA
53 292 CA599114F CA599114R
CCg Tgg TCg TCC TCg gCg Tg ggC AAT TAC Cgg ggg AAA CT
55 334
CA599099F CA599099R
CTC ggA ggT gAg CgA AAA T gAC CCC CCC gTT gAg AAg C
52 397 CA599049F CA599049R
ATT CTg CTC TgC TCC TCC CAg TTC gTC ACg ggT TTg
51 278
CA599032F CA599032R
gCC gAT CCA TTC ATC CCg A AgC AgT TgC CCC ACC CAg T
56 375 CA599013F CA599013R
TgA ACA AAg gAg ACA Cgg T TAT TgA TTg gAT TAA ggC C
45 235
CA598962F CA598962R
CAg ggA Cgg TgA CTg TgC C AAT gTC gTT TgC ggT TgT A
51 225 CA598940F CA598940R
gAC gCT CAA gCC CCC Ag Agg TTT gTT TgC CCA TA
47 601
CA599166F CA599166R
Agg gCT CCT ATg CTT CgC gTT gTA CgC CgC TTg gTC
54 211 CA599172F CA599172R
gCA gCC gAC ggT gAA gAt gAg ggC gTT gAA gTT TgA gTA g
53 359
CA597830F CA597830R
CgT gAg AAC AgC gAA gCg gAT TgA TgC gAA CAT Agg C
54 331 CA597983F CA597983R
TCA CgC ACT ACC TCA CCC CCC TTC CAg TAC CCT TTC T
52 208
CA598102F CA598102R
ggC ACA gAC CCT AAC CAC gAg TAC ATT CAC ggA gAC g
54 262 CA598181F CA598181R
CAC CCC gCA ggA CTT CgT TTT ATT TCC AgT TgA TTA
36 382
CA598187F CA598187R
TAg TAT TCT CCC CgC CAC CAT CCT TTA ATT TTT TCA
36 450 CA598128F CA598128R
gCC TTC TTg AAC CAT CCT g gCT TTg AAA TTT ggC gCC C
49 451
CA598256F CA598256R
ggg CAT TgT TgA CTC TgA TTg TTC TCg gCA ATC TCA
52 135 CA598366F CA598366R
CCC gTg gCA gTC AAg ATg TTg AAg CCC AAC Agg ATg
54 347
CA598422F CA598422R
CAC gAg TgA AgT gAg AgC TAT TTT ATT TTA ggC ggA
38 356 CA598476F CA598476R
ATT TCC CgA AgT TAg gCg CTC AAg ggC TgT AAg gTg
52 160
CA598630F CA598630R
CAA AgC AAA TCC CAC AAT TgA ggC gTA ACA TCC AAg
52 383 CA598687F CA598687R
gAg CAA gTT TAg gAg CgA CCA A ATg TAC ggg AAg gCg gAg C
53 285
CA598694F CA598694R
AAT gTC Tgg CTg ggT TCA TCA gTC TTT CTT Tgg Tgg C
52 352 CA599121F CA599121R
AAA CAA CCA TgA AgA ACA CC CAC ATC TAC gCA CAA AAA Cg
48 370
summarizes the mean genetic distance and genetic identity between the cultivars as determined by MVSP 3.1. Pair -wise within-group distances ranged from 0 to 0.725, with the highest similarity (0.725) occurring between Harman -kaya99 and Sönmez2001 and the lowest (0.622) between Aytin98 and Izgi01. Figure 6 shows the dendrogram based on the similar -ity index (Jaccard’s coefficient) of the six cultivars. Two main clusters were observed, the first of which included cultivars Aytin98 and ES14 while the second was divided into two subclusters, the first of which comprised PI178383 while the second contained Izgi01, Sönmez2001 and Har -mankaya99. The latter subcluster consisted a group con -taining Izgi01 and another containing Sönmez2001 and Harmankaya99. The construction of this dendrogram dem -728 Karakas et al.
Table 5 (cont.)
Primer Sequence (5’-3’) TaoC Product size (bp) Primer Sequence (5’-3’) TaoC Product size (bp)
CA598966F CA598966R
ggC TgT TTg AgA ATg gAC gg CTT Tgg TTT Tgg AgC ggg TT
51 430 CA598941F CA598941R
CAT CAC CAA ggA ggA CA AAA gAA Cgg gAA gAg CC
48 405
CA597760F CA597760R
gTg CTg gCg ATg gTg CTC gCC gTT Cgg ggT TgT TgT
52 190 CA598151F CA598151R
gCg AgC CCT CCA CCA CAA Cgg CAA AgT AAT CAA TCA
42 402
CA598557F CA598557R
ATg ggg AAg AAg CAg gTg g TTg gTT TgA ACA Agg AAg A
43 441 CA598672F CA598672R
CAg Tgg gTg TCA ggA gTC T TgT gTT gTg TTg TgT TgT T
43 375
CA598691F CA598691R
AAg CCg AAg CAC TAg ATC C ACA TTC CAg AAA AAC ACg A
43 475 CA598755F CA598755R
AgC AAg CAA gCC gAA gCA CT Cgg gAA Agg AAA ACg gAg gA
51 358
CA599273F CA599273R
gCA gCT CCA gCg gCg CAg gC gCg gTg TAg gTg gTA Agg gT
54 146 CA599285F CA599285R
gCT CAC CAC CAC TAC TA ggA TgC CCg Cgg CCT TC
46 319
CA599115F CA599115R
CgT gCg ggC Agg Tgg ACT TgA CAT gCT gAT ggg gAA
52 252 CA599235F CA599235R
gAT ggC Tgg gCT ACT CTC T TTT ggA CCC CCg AAT TTT g
47 461
CA599277F CA599277R
gCT TTT TTC CCC TTC CTC Cg gCC CCT TTg AAT CAA TgT CC
50 552 CA598980F CA598980R
ATg AAC TgC TTC TgC TCC T TAg ATT TCg TAC TCT Tgg g
47 255
CA599015F CA599015R
CCA TAT CCT CTC CCA AgC TCC CAC CCA TTC TCA AAC
49 344 CA599119F CA599119R
CTC CCC AAA gCC CTA ACC AgC CAg gAA ggC gAA gAA g
onstrates the ability of EST-derived contigs and singletons in detecting extensive genetic diversity in genotypes with an expected narrow genetic pool.
Discussion
Genome-marker technologies are particularly valu-able for analyzing crops, such as wheat, that have relatively low levels of genetic diversity (Plaschkeet al.,1995). DNA markers such as AFLP (Gülbitti-Onarici et al., 2007), RAPD (Asifet al.,2005), EST-SSR (Leighet al.,2003), SSRs (Chen,2005) and internal transcribed spacer (ITS) (Zhanget al.,2002) are the most convenient data sources. EST databases represent a potentially valuable resource for developing molecular markers for evolutionary studies. Since EST-derived markers come from transcribed regions of the genome they are likely to be conserved across a broader taxonomic range than other types of markers (Pashleyet al.,2006).
The low level of genetic diversity expected between self-pollinating plants means that EST databases can be useful tools for genetic studies in wheat and related species. Our results indicate that EST-derived primers were good tools for assessing the genetic diversity in wheat cultivars. A relatively high level of polymorphism (58.61% of loci were polymorphic) was observed with 39 contig and 92 sin-gleton primers across the six wheat genotypes, despite the fact that all of them were local cultivars from geographi-cally close locations. Several other studies have reported polymorphism in self-pollinating plants, including tef (4%)
(Bai et al., 1999), azuki (18%) (Yee et al., 1999), rice
(22%) (Maheswaran et al., 1997), sugar beet (50%) (Schondelmaier et al., 1996) and wild barley (76%) (Pakniyatet al., 1997). In a work similar to that reported here, Weiet al.(2005) used microsatellite markers to assess the polymorphic divergence in wheat landraces highly re-sistant toFusariumhead blight (FHB). The level of poly-morphism observed among 20 wheat landraces resistant to FHB and four wheat landraces susceptible to FHB was 97.5% with a mean genetic similarity index among the 24 genotypes of 0.419 (range: 0.103 to 0.673).
In conclusion, we have used an EST database to ex-amine the genetic diversity among Turkish wheat cultivars resistant and susceptible to yellow rust disease. Our results
indicate that EST databases can be used to assess genetic diversity and identify suitable parents in populational stud-ies designed to detect genes related to disease resistance.
Acknowledgments
The authors thank Dr. Selma Onarici for her helpful comments, Dr. Necmettin Bolat for providing plant mate-rial and Central Research Institute of Field Crops for per-forming pathogenity tests. This study is a part of a PhD thesis (“Investigation of yellow rust disease resistance in winter-type bread wheat (Triticum aestivumL.) using bio-technological methods”) by Ozge Karakas done at the Insti-tute of Sciences and Research Foundation (project no. 1832), Istanbul University. This work was supported by TUBITAK KAMAG (project no. 105G075).
References
Akfrat-Senturk F, Aydn Y, Ertugrul F, Hasancebi S, Budak H, Akan K, Mert Z, Bolat N and Uncuoglu-Altnkut A (2010) A microsatelite marker for yellow rust resistance in wheat. Ce-real Research Communications 38:203-210.
Altnta S, Toklu F, Kafkas S, Kilian B, Brandolini A and Özkan H (2008) Estimating genetic diversity in drum and bread wheat cultivars from Turkey using AFLP and SAMPL markers. Plant Breed 127:9-14.
Altschul SF, Gish W, Miller W, Myers EW and Lipman DJ (1990) Basic local alignment search tool. J Mol Biol 215:403-410. Asf M, Rahman MU and Zafar Y (2005) DNA fingerprinting
studies of some wheat (Triticum aestivumL.) genotypes us-ing Random Amplified Polymorphic DNA (RAPD) analy-sis. Pak J Bot 37:271-277.
Bai G, Tefera H, Ayele M and Ngujen HT (1999) A genetic link-age map of tef [Eragrostis tef(Zucc.) Trotter] based on am-plified fragment length polymorphism. Theor Appl Genet 99:599-604.
Bennett MD and Leitch IJ (1995) Nuclear DNA amounts in angio-sperms. Ann Bot 76:113-176.
Chen XM (2005) Epidemiology and control of stripe rust (Puccinia striiformisf. sp. tritici) on wheat. Can J Plant Pathol 27:314-337.
Ercan S, Ertugrul F, Aydin Y, Akfirat-Senturk F, Hasancebi S, Akan K, Mert Z, Bolat N, Yorgancilar O and Uncuoglu-Altinkut AA (2010) An EST-SSR marker linked with yel-low rust resistance in wheat. Biol Plant (in press).
A wheat EST database for diversity 729
Table 6- Similarity index (Jaccard’s coefficient) betweenTriticum aestivumcultivars.
Population ID PI178383 Izgi01 Sönmez2001 Harmankaya99 ES14 Aytin98
PI178383 1.000
Izgi01 0.680* 1.000
Sönmez2001 0.656* 0.692* 1.000
Harmankaya99 0.692* 0.680* 0.725* 1.000
ES14 0.682* 0.655* 0.686* 0.712* 1.000
Aytin98 0.655* 0.622* 0.628* 0.655* 0.703* 1.000
Gülbitti-Onarici S, Sümer S and Özcan S (2007) Determination of phylogenetic relationships between some wild wheat spe-cies using amplified fragment length polymorphism (AFLP) markers. Bot J Linn Soc 153:67-72.
Jaccard P (1908) Nouvelles recherches sur la distribution florale. Bull Soc Vaud Sci Nat 44:223-270.
Kantety RV, Rota ML, Matthews DE and Sorrells MS (2002) Data mining for simple sequence repeats in expressed se-quence tags from barley, maize, rice, sorghum and wheat. Plant Mol Biol 48:501-510.
Kovach WL (1999) MVSP – A Multivariate Statistical Package for Windows, v. 3.1. Kovach Computing Services, Pen-traeth, 133 pp.
Leigh F, Lea V, Law J, Wolters P, Powell W and Donini P (2003) Assessment of EST- and genomic microsatellite markers for variety discrimination and genetic diversity studies in wheat. Euphytica 133:359-366.
Li S, Jia J, Wei X, Zhang X, Li L, Chen H, Fan Y, Sun H, Zhao X, Lei Tet al.(2007) An intervarietal genetic map and QTL analysis for yield traits in wheat. Mol Breed 20:167-178. Lu G and Moriyama NE (2004) Vector NTI, a balanced all-in-one
sequence analysis suite. Brief Bioinform 5:378-388. Maheswaran M, Subudhi PK, Nandi S, Xu JC, Parco A, Yang DC
and Huang N (1997) Polymorphism, distribution and segre-gation of AFLP markers in doubled haploid rice population. Theor Appl Genet 94:39-45.
McNeal FM, Conzak CF, Smith EP, Tade WS and Russell TS (1971) A uniform system for recording and processing ce-real research data. US Agricultural Research Survice 42:34-121.
Nagaoka T and Ogihara Y (1997) Applicability of nter-simple se-quence repeat polymorphisms in wheat for use as DNA markers in comparison to RFLP and RAPD markers. Theor Appl Genet 94:597-602.
Pakniyat H, Powell W, Baird E, Handley LL, Robinson D, Scrim-geour CM, Nevo E, Hackett CA, Caligari PDS and Forster BP (1997) AFLP variation in wild barley (Hordeum spontaneumC. Kock) with reference to salt tolerance and as-sociated ecogeography. Genome 40:332-341.
Parkinson J, Guiliano DB and Blaxter M (2002) Making sense of EST sequences by CLOBBing them. BMC Bioinformatics 3:31.
Pashley CH, Ellis JR, McCauley DE and Burke JM (2006) EST databases as a source for molecular markers: Lessons from Helianthus. J Hered 97:381-388.
Plaschke J, Ganal MW and Röder MS (1995) Detection of genetic diversity in closely related bread wheat using microsatellite markers. Theor Appl Genet 91:1001-1007.
Rudd S (2003) Expressed sequence tags: Alternative or comple-ment to whole genome sequences? Trends Plant Sci 8:321-328.
Schondelmaier J, Streinrucken G and Jung C (1996) Integration of AFLP markers into a linkage map of sugar beet (Beta vulgarisL.). Plant Breed 115:231-237.
Song W and Henry RJ (1995) Molecular analysis of the DNA polymorphism of wild barley (Hordeum spontaneum) germ-plasm using the polymerase chain reaction. Genet Resourc Crop Evol 42:273-280.
Torre J, Egan MG, Katari MS, Brenner ED, Stevenson DW, Coruzzi GM and DeSalle R (2006) ESTimating plant phy-logeny: Lessons from partitioning. BMC Evol Biol 6:48. Wei YM, Hou YC, Yan ZH, Wu W, Zhang ZQ and Liu DC (2005)
Microsatellite DNA polymorphism divergence in Chinese wheat (Triticum aestivumL.) landraces highly resistant to Fusariumhead blight. J Appl Genet 46:3-9.
Weining S and Langridge P (1991) Identification and mapping of polymorphisms in cereals based on the polymerase chain re-action. Theor Appl Genet 82:209-216.
Yee E, Kidwell KK, Sills GR and Lumpkin TA (1999) Diversity among selectedVigna angularis(Azuki) accessions on the basis of RAPD and AFLP markers. Crop Sci 39:268-275. Yu JK, Dake TM, Singh S, Benscher D, Li W, Gill B and Sorrels
ME (2004) Development and mapping of EST-derived sim-ple sequence repeat markers for hexaploid wheat. Genome 47:805-818.
Zeybek A and Yigit F (2004) Determination of virulence genes frequencies in wheat stripe rust (Puccinia striiformisf. sp. tritici) populations during natural epidemics in the regions of southern Aegean and western Mediterranean in Turkey. Pak J Biol Sci 7:1967-1971.
Zhang W, Qu LJ, Gu H, Gao W and Liu M (2002) Studies on the origin and evolution of tetraploid wheats based on the inter-nal transcribed spacer (ITS) sequences of nuclear ribosomal DNA. Theor Appl Genet 104:1099-1106.
Internet Resources
GrainGenes. http://wheat.pw.usda.gov/cgi-bin/westsql/est_lib. cgi (August 15, 2007).
VecScreen database. http://www.ncbi.nlm.nih.gov/VecScreen/ VecScreen.html (September 20, 2007).
ClustalW v.1.82. http://www.ebi.ac.uk (November 22, 2007).
Associate Editor: Luciano da Fontoura Costa
License information: This is an open-access article distributed under the terms of the Creative Commons Attribution License, which permits unrestricted use, distribution, and reproduction in any medium, provided the original work is properly cited.