ABSTRACT: Karyotyping and chromosome complement knowledge are a prerequisite for cytogenetic mapping. The aim of this study was to characterize 1 common wheat cultivar (BH 1146) and 4 durum wheat genotypes (IAC 1003, Langdon, P19 and P33) from the breeding program of the Agronomic Institute of Campinas (IAC), using karyotype analysis together with Chromomycin A3/4’-6-diamidino-2-phenylindole (CMA/dAPI) banding techniques for longitudinal characterization of chromosomes and fluorescence in situ hybridization (FISH) in the mapping of the 45S rdNA region. durum wheat chromosome complement number was 2n = 4x = 28 with the following karyotype formula: 22m + 6sm. Common wheat chromosome complement number was 2n = 6x = 42 with the following karyotype formula: 34m + 8sm. Tetraploid and hexaploid genomes presented 2 pairs of
BASIC AREAS -
Article
Cytomolecular characterization of cultivars
and landraces of wheat tolerant and sensitive
to aluminum toxicity
Érica Cristina de Oliveira1*, Cecília Alzira Ferreira Pinto-Maglio2
1.Instituto Agronômico - Programa de Pós-Graduação em Agricultura Tropical e Subtropical - Área de Melhoramento Vegetal e Biotecnologia - Campinas (SP), Brazil.
2.Instituto Agronômico - Centro de Pesquisa e Desenvolvimento de Recursos Genéticos Vegetais - Campinas (SP), Brazil.
*Corresponding author: erica_biologa@hotmail.com
Received: Jul. 11, 2016 – Accepted: dec. 2, 2016
chromosomes with secondary constriction and terminal satellites. All 5 wheat genotypes exhibited CMA and dAPI bands and signals in the 45S rdNA regions (FISH-probe pTa71) which varied in number and location on the chromosome complement. All lines showed greater amount of dAPI bands than CMA bands. The FISH-rdNA 45Sin situ
INTRODUCTION
After maize, wheat is the world’s second most produced cereal. The most commonly grown types with good commercial potential are common wheat (also called ‘bread wheat’ because it has a large amount of starch) and durum wheat, which contains higher protein content (gluten) and is used in the production of pasta (Felício et al. 1999; Awika 2011).
In Brazil, cultivation of durum wheat has limitations because this type of wheat has little tolerance to acidic soils with Al3+ and H+ ions. Acidic soils are common in different regions of Brazil, mainly in the North and Midwest, followed by the Southeast and South regions (Fageria and Stone 1999). Wheat cultivation is prevalent in the South, Southeast and Midwest Brazil, and several studies have been carried out in the last decades in order to enable large-scale cultivation of durum wheat in Southeast Brazil, particularly in the State of São Paulo (Camargo et al. 1992; Camargo et al. 1999; Camargo et al. 2006; Del Guercio and Camargo 2011). However, besides the lack of tolerance to aluminum toxicity, durum wheat in Brazil also has no grain dormancy, exhibits low productivity and is largely susceptible to diseases such as wheat leaf rust (Puccinia triticina = P. recondite
f. sp. tritici), leaf spot (Bipolaris sorokiniana, Drechslera tritici-repentis, Stagonospora nodorum and Septoria tritici), wheat head blight fungus (Gibberella zeae), powdery mildew (Blumeria graminis f. sp. tritici) and blast (Pyricularia grisea).
Common wheat belongs to the Triticum aestivum L. species and has 3 genomes, called A, B and D, with 7 chromosome pairs each (x = 7). There are reports that genetic traits for tolerance to aluminum toxicity are mainly present in chromosomes of the D genome. However, genes for tolerance to aluminum toxicity have also been identified in the chromosomes of A and B genomes in some common wheat cultivars (Lagos et al. 1991; Luo and Dvorak 1996; Ryan et al. 2009). According to Camargo et al. (2006), the aluminum tolerance of cultivar BH 1146 might be controlled by a pair of dominant genes, whereas Aniol (1984) and Ryan et al. (2009) have reported that tolerance to Al3+ is controlled by multiple genes in other common wheat cultivars. In contrast to common wheat, durum wheat (Triticum turgidum ssp. durum Desf ) has only A and B genomes, with no reports of cultivars presenting tolerance
to aluminum toxicity (Lagos et al. 1991; Camargo et al. 1992; Luo and Dvorak 1996; Camargo et al. 2006).
Leymus mollis (NsNsXmXm, 2n = 28) is a wild relative of wheat and has agronomic characteristics such as resistance to abiotic stress, fungi and bacteria that are possible to transfer to wheat in breeding programs by chromosome segment substitution lines (CSSLs) (Pang et al. 2014). Cytogenetic mapping by fluorescence
in situ hybridization (FISH) is a tool that helps localize directly on the chromosome complement specific DNA sequences and genes (Lukaszewski et al. 2012; Zhang et al. 2012; Pang et al. 2014; Tang et al. 2014; Zhang et al. 2015). This technique is common in breeding programs in order to detect and track the introgression of genes via chromosomal mapping. Pang et al. (2014), using genomic
in situ hybridization (GISH) and FISH, determined the karyotypic constitution of a wheat — Leymus mollis 3D (3Ns#1) disomic substitution line, which was designated as 10DM57 (2n = 42). By employing hybridization via GISH, it was possible to identify that 10DM57 was a line with 40 chromosomes from wheat and 2 of the Ns chromosomes from L. mollis. The FISH technique showed pattern with probe pAs1 bands of chromosome 3D and the Ns chromosome. The authors deduced that the Ns chromosome was 3Ns and that chromosome 3D was replaced by 3Ns in 10DM57. This study demonstrated that the line 10DM57 was resistant to leaf rust when compared with common wheat and recommend it as an intermediate material in wheat genetic and breeding programs.
Karyotyping or the knowledge of the chromosome complement is a prerequisite for cytogenetic mapping. In genotypes in which the karyotype is well known, it is possible to identify genes or DNA sequences on specific chromosomes. Mapping also allows recognizing and monitoring the presence of chromosomes or chromosome segments during introgression in breeding programs.
The objective of this study was to characterize 1 common wheat cultivar (BH 1146) and 4 durum wheat cultivars/landraces (IAC 1003, Langdon, P19 and P33) from the breeding program of the Agronomic Institute of Campinas (IAC - Campinas, São Paulo, Brazil). using karyotyping and 4’-6-Diamidino-2-phenylindole/ Chromomycin A3 (DAPI/CMA) banding techniques for longitudinal characterization of chromosomes and FISH of nucleic acids for mapping 45S rDNA sites. Knowing these karyotypes will allow mapping sequences related with tolerance to aluminum toxicity in the studied wheat chromosome complement. This will enable monitoring the introgression of specific chromosomes bearing sequences related to aluminum tolerance through introgression lines in breeding programs.
MATERIAL AND METHODS
Biological material
Seeds of 5 wheat genotypes (BH 1146, IAC 1003, Langdon, P19 and P33) available at the Bank of Wheat Seeds from the IAC (BAG-IAC WHEAT) were used to obtain the meristems in cytological preparations. The BH 1146 common wheat cultivar belongs to Triticum aestivum, whereas the IAC 1003, Langdon, P19 and P33 durum wheat genotypes belong to Triticum turgidum ssp. durum. Using crosses of BH 1146 and Langdon genotypes followed by 2 backcrosses with IAC 1003 cultivar (BH 1146/Langdon//2*IAC1003), the gene from BH 1146 common wheat that confers tolerance to aluminum toxicity was transferred to the durum wheat landraces P19 and P33 (Silva et al. 2010).
Pretreatment, fixation and preparation of chromosomes
Metaphase chromosomes were obtained using a pretreatment of root tips from common and durum wheat, germinated as described in the following protocol. Common wheat seeds were germinated on moist cotton in Petri dishes and then kept in the dark in a controlled temperature of 25 °C for 48 h. After this period, the roots were collected and submitted to a pretreatment in cold water (4 °C) for 32 h. After pretreating, roots were fixed in Carnoy solution (absolute ethanol:glacial acetic acid — ratio 3:1, respectively) and stored at −20 °C.
Durum wheat seeds were subjected to thermal shock to break dormancy. Seeds were germinated in Petri dishes with moist cotton and then kept in the dark for 24 h at 25 °C. Then seeds were transferred to 4 °C for 48 h and then maintained at 25 °C for 24 h (Brammer et al. 2009). Germinated roots were collected and submitted to pretreatment with the PDB antimitotic (Paradichlorobenzene) for 25 h. After pretreating, the roots were fixed in Carnoy solution (absolute ethanol:glacial acetic acid — ratio 3:1, respectively) and stored at −20 °C.
Slides were prepared using the “SteamDrop” method used by Kirov et al. (2014) with slight modifications. Cell digestion or hydrolysis was performed in 30 µL enzyme solution with a final concentration of 6%, containing a mixture of 0.03% Pectolyase, Cellulase and Cytohelicase (Sigma-Aldrich). The roots on this enzyme solution remained at 45 °C for 45 min.
Analysis of chromosome morphology
For the analysis of chromosomal morphology, slides were mounted with 15 µL of 45% acetic acid. Slides were covered with coverslip and examined under phase microscopy.
Chromomycin A3 banding
Banding with the fluorochrome Chromomycin A3 with Distamycin (CMA/DA) was performed following the procedure described by Schweizer (1976) with some adjustments. It was applied a quantity equal to 40 µL of buffer containing CMA on the dry slides. Slides were covered with coverslips and kept in the dark at room temperature for 1h30min. Then slides were rinsed with distilled water and dried at room temperature for 1 h in the dark. After adding 30 µL of 0.1 mg∙mL−1 distamycin solution, the slides were covered with coverslips and kept in the dark at room temperature for 20 min. Then slides were rinsed with distilled water and dried for 1 h in the dark at room temperature. The slides were mounted with 40 µL of 1 M magnesium chloride solution, McIlvane buffer and Vectashield (5 µL, 1 mL and 1 mL, respectively), covered with coverslip and incubated at 37 °C for 4 days.
4’-6-Diamidino-2-phenylindole banding
and a quantity equal to 40 µL of a diluted Actinomycin D solution (0.2 mg∙mL−1 in deionized water) was applied to dried slides. Slides were then covered with coverslips and maintained in the dark for 20 min then washed again with distilled water and kept in the dark at room temperature during 1 h for drying. After drying, a quantity equal to 30 µL DAPI solution (2 µL stock DAPI plus 198 µL water) was applied. These preparations were covered with coverslips and maintained in the dark for 30 min. Then, slides were rinsed with distilled water and kept drying at room temperature and in the dark. The slides were mounted with a drop (10 µL) of Vectashield (Vector Laboratories) and covered with a coverslip.
Fluorescence in situ hybridization
The protocol based on Pendás et al. (1993) and modified as described by Pinto-Maglio et al. (2001)3 and Iacia and Pinto-Maglio (2013) was used for FISH. The probe (pTa71) was the 45S sequence of ribosomal DNA (45S rDNA) isolated from the wheat genome (Triticum aestivum), which was labeled with digoxigenin-11-dUTP (Roche) using the nick translation reaction according to manufacturer’s instruction. Detection was with anti-digoxigenin conjugated to fluorescein isocyanate (FITC). Cytological preparations were completed with Vectashield mounting medium for fluorescence containing the DAPI counterstain.
Fluorescence images
Images of the chromosomes were analyzed and captured using an Olympus BX50 epifluorescence microscope coupled to a computer containing the Image-ProPlus software, version 6.0 (Media Cybernetics, Inc., Silver Spring, MD, USA). The following Olympus filters for fluorescence were used: U-MWU for DAPI (BLUE/UV — excitation at 330/385 nm and emission at 420 nm), U-MWBV to CMA(GREEN/UV — excitation at 400/440 nm and emission at 475 nm) and U-MNB2 to FITC (GREEN/UV — excitation at 450 nm and emission at 570 nm).
Image analysis
Images of chromosomes resulting from the application of different techniques were edited with Adobe Photoshop
CS6 (64-bit) and Image-ProPlus 6.0 — Media Cybernetics. Nomenclature to establish the centromere position was the one suggested by Levan et al. (1964).The karyotype asymmetry was determined by the total form (TF, in %) according to Huziwara (1958; 1962). The TF takes into account the sum of the short arms and the total length of the chromosomes, and the percent values range from 0 to 50%.
For each genotype was measured the chromosomes of ten cells at metaphase using the MicroMeasure 3.3 program version (MM) (Reeves 2001) and idiograms were built using Microsoft® PowerPoint 2010.
Statistical analysis
The results from the morphological analysis of chromosomes with the banding patterns (DAPI/AMD and CMA/DA) and the hybridization signals for the 45S rDNA sequence were subjected to multivariate analysis, via Principal Component Analysis (PCA), in order to compare the degree of correlation among the morphological characteristics, the main banding patterns and the number of rDNA signals that determine the similarity and/or differentiation between genotypes. The statistical software “Program GENES” (http://www.ufv.br/dbg/genes/Genes_ EUA.htm) was used to perform the multivariate analysis (Cruz 2013).
RESULTS AND DISCUSSION
Numerical and morphological chromosome analysis
Mitotic analysis of durum wheat genotypes (IAC 1003, Langdon, P19 and P33) allowed to observe complements with 2n = 4x = 28 chromosomes and with karyotype formula of 22m + 6sm. The common wheat cultivar (BH 1146) presented 2n = 6x = 42 chromosomes and karyotype formula of 34m + 8sm (Tables 1, 2). Chromosomal complements with 2n = 28 and 2n = 42 chromosomes have been recorded previously in durum wheat and common wheat respectively by other authors such as El-Twab (2006) and Endo et al. (2014).
The Langdon durum wheat cultivar is one of the cultivars that originated P19 and P33 landraces. According to Joppa and Williams (1988), the Langdon was an aneuploid line that had a pair of chromosomes homoeologous replaced 3Pinto-Maglio, C. A. F., Barbosa, R. L., Cuéllar, T., Maluf, M. P., Pierozzi, N. I.,
Silvarolla, B. and Orsi, C. H. (2001). Chromosome characterization in
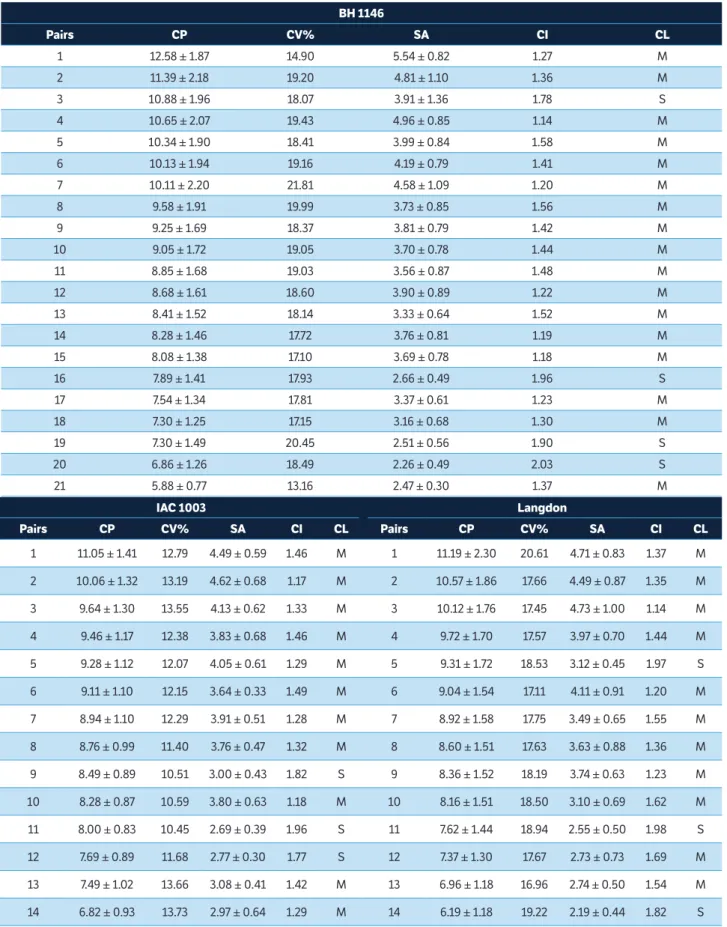
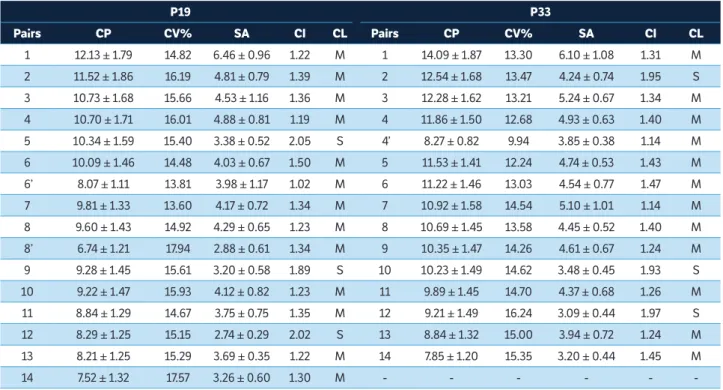
Table 1. Total length average of chromosome pairs, mean coefficient of variation, average of short arms, centromeric index and classification for common wheat (BH 1146) and durum wheat (IAC 1003, Langdon, P19 and P33).
...continue
BH 1146
Pairs CP CV% SA CI CL
1 12.58 ± 1.87 14.90 5.54 ± 0.82 1.27 M
2 11.39 ± 2.18 19.20 4.81 ± 1.10 1.36 M
3 10.88 ± 1.96 18.07 3.91 ± 1.36 1.78 S
4 10.65 ± 2.07 19.43 4.96 ± 0.85 1.14 M
5 10.34 ± 1.90 18.41 3.99 ± 0.84 1.58 M
6 10.13 ± 1.94 19.16 4.19 ± 0.79 1.41 M
7 10.11 ± 2.20 21.81 4.58 ± 1.09 1.20 M
8 9.58 ± 1.91 19.99 3.73 ± 0.85 1.56 M
9 9.25 ± 1.69 18.37 3.81 ± 0.79 1.42 M
10 9.05 ± 1.72 19.05 3.70 ± 0.78 1.44 M
11 8.85 ± 1.68 19.03 3.56 ± 0.87 1.48 M
12 8.68 ± 1.61 18.60 3.90 ± 0.89 1.22 M
13 8.41 ± 1.52 18.14 3.33 ± 0.64 1.52 M
14 8.28 ± 1.46 17.72 3.76 ± 0.81 1.19 M
15 8.08 ± 1.38 17.10 3.69 ± 0.78 1.18 M
16 7.89 ± 1.41 17.93 2.66 ± 0.49 1.96 S
17 7.54 ± 1.34 17.81 3.37 ± 0.61 1.23 M
18 7.30 ± 1.25 17.15 3.16 ± 0.68 1.30 M
19 7.30 ± 1.49 20.45 2.51 ± 0.56 1.90 S
20 6.86 ± 1.26 18.49 2.26 ± 0.49 2.03 S
21 5.88 ± 0.77 13.16 2.47 ± 0.30 1.37 M
IAC 1003 Langdon
Pairs CP CV% SA CI CL Pairs CP CV% SA CI CL
1 11.05 ± 1.41 12.79 4.49 ± 0.59 1.46 M 1 11.19 ± 2.30 20.61 4.71 ± 0.83 1.37 M
2 10.06 ± 1.32 13.19 4.62 ± 0.68 1.17 M 2 10.57 ± 1.86 17.66 4.49 ± 0.87 1.35 M
3 9.64 ± 1.30 13.55 4.13 ± 0.62 1.33 M 3 10.12 ± 1.76 17.45 4.73 ± 1.00 1.14 M
4 9.46 ± 1.17 12.38 3.83 ± 0.68 1.46 M 4 9.72 ± 1.70 17.57 3.97 ± 0.70 1.44 M
5 9.28 ± 1.12 12.07 4.05 ± 0.61 1.29 M 5 9.31 ± 1.72 18.53 3.12 ± 0.45 1.97 S
6 9.11 ± 1.10 12.15 3.64 ± 0.33 1.49 M 6 9.04 ± 1.54 17.11 4.11 ± 0.91 1.20 M
7 8.94 ± 1.10 12.29 3.91 ± 0.51 1.28 M 7 8.92 ± 1.58 17.75 3.49 ± 0.65 1.55 M
8 8.76 ± 0.99 11.40 3.76 ± 0.47 1.32 M 8 8.60 ± 1.51 17.63 3.63 ± 0.88 1.36 M
9 8.49 ± 0.89 10.51 3.00 ± 0.43 1.82 S 9 8.36 ± 1.52 18.19 3.74 ± 0.63 1.23 M
10 8.28 ± 0.87 10.59 3.80 ± 0.63 1.18 M 10 8.16 ± 1.51 18.50 3.10 ± 0.69 1.62 M
11 8.00 ± 0.83 10.45 2.69 ± 0.39 1.96 S 11 7.62 ± 1.44 18.94 2.55 ± 0.50 1.98 S
12 7.69 ± 0.89 11.68 2.77 ± 0.30 1.77 S 12 7.37 ± 1.30 17.67 2.73 ± 0.73 1.69 M
13 7.49 ± 1.02 13.66 3.08 ± 0.41 1.42 M 13 6.96 ± 1.18 16.96 2.74 ± 0.50 1.54 M
by a pair of D genome chromosomes of the Chinese Spring common wheat cultivar. However, in the analyzed seeds and in the IAC samples, the meristematic cells presented euploid number of chromosomes from durum wheat, i.e., 2n = 4x = 28. The multiplication and renewal of seeds are necessary for maintaining germplasm banks and although these procedures may tend to promote, over time, a trend toward normalization of the characteristic number of the species. Such normalization likely occurred with Langdon cultivar when selfing with normal gametes.
According to the analysis of the chromosome morphology of the 5 genotypes, the highest values for chromosome lengths average were observed in P33 (10.65 ± 1.69 μm) and Table 1. Continuation...
P19 P33
Pairs CP CV% SA CI CL Pairs CP CV% SA CI CL
1 12.13 ± 1.79 14.82 6.46 ± 0.96 1.22 M 1 14.09 ± 1.87 13.30 6.10 ± 1.08 1.31 M
2 11.52 ± 1.86 16.19 4.81 ± 0.79 1.39 M 2 12.54 ± 1.68 13.47 4.24 ± 0.74 1.95 S
3 10.73 ± 1.68 15.66 4.53 ± 1.16 1.36 M 3 12.28 ± 1.62 13.21 5.24 ± 0.67 1.34 M
4 10.70 ± 1.71 16.01 4.88 ± 0.81 1.19 M 4 11.86 ± 1.50 12.68 4.93 ± 0.63 1.40 M
5 10.34 ± 1.59 15.40 3.38 ± 0.52 2.05 S 4’ 8.27 ± 0.82 9.94 3.85 ± 0.38 1.14 M
6 10.09 ± 1.46 14.48 4.03 ± 0.67 1.50 M 5 11.53 ± 1.41 12.24 4.74 ± 0.53 1.43 M
6’ 8.07 ± 1.11 13.81 3.98 ± 1.17 1.02 M 6 11.22 ± 1.46 13.03 4.54 ± 0.77 1.47 M
7 9.81 ± 1.33 13.60 4.17 ± 0.72 1.34 M 7 10.92 ± 1.58 14.54 5.10 ± 1.01 1.14 M
8 9.60 ± 1.43 14.92 4.29 ± 0.65 1.23 M 8 10.69 ± 1.45 13.58 4.45 ± 0.52 1.40 M
8’ 6.74 ± 1.21 17.94 2.88 ± 0.61 1.34 M 9 10.35 ± 1.47 14.26 4.61 ± 0.67 1.24 M
9 9.28 ± 1.45 15.61 3.20 ± 0.58 1.89 S 10 10.23 ± 1.49 14.62 3.48 ± 0.45 1.93 S
10 9.22 ± 1.47 15.93 4.12 ± 0.82 1.23 M 11 9.89 ± 1.45 14.70 4.37 ± 0.68 1.26 M
11 8.84 ± 1.29 14.67 3.75 ± 0.75 1.35 M 12 9.21 ± 1.49 16.24 3.09 ± 0.44 1.97 S
12 8.29 ± 1.25 15.15 2.74 ± 0.29 2.02 S 13 8.84 ± 1.32 15.00 3.94 ± 0.72 1.24 M
13 8.21 ± 1.25 15.29 3.69 ± 0.35 1.22 M 14 7.85 ± 1.20 15.35 3.20 ± 0.44 1.45 M
14 7.52 ± 1.32 17.57 3.26 ± 0.60 1.30 M - - -
-The heteromorphic pairs of chromosomes in P19 (6, 6’, 8 and 8’) and P33 (4 and 4’) are represented. CP = Chromosome pairs; CV% = Mean coefficient of variation; SA = Short arms; CI = Centromeric index; CL = Classification; M = Metacentric chromosome; S = Submetacentric chromosome.
Genotype Karyotype
formulas (2n)
Total average (µm)
Short arm (µm)
Total form (%)
Larger chromosome (µm)
Smaller chromosome (µm)
BH 1146 34m + 8sm 9.00 ± 1.65 3.71 ± 0.83 41.23 12.58 ± 1.87 5.88 ± 0.77
IAC 1003 22m + 6sm 8.79 ± 1.10 3.62 ± 0.62 41.25 11.05 ± 1.41 6.82 ± 0.93
Langdon 22m + 6sm 8.72 ± 1.41 3.52 ± 0.81 40.38 11.19 ± 2.30 6.19 ± 1.18
P19 22m + 6sm 9.44 ± 1.46 3.95 ± 0.75 41.84 12.13 ± 1.79 7.52 ± 1.32
P33 22m + 6sm 10.65 ± 1.69 4.39 ± 0.80 41.26 14.09 ± 1.87 7.85 ± 1.20
Table 2. Comparative data of karyotype formulas and mean of chromosome total length, length of short arms, total form, the larger and smaller chromosome lengths in common wheat (BH 1146) and the 4 durum wheat genotypes (IAC 1003, Langdon, P19 and P33).
The average values of the total chromosome lengths, short arms, long arms, larger and smaller chromosomes refer to the average of 10 meristematic root cells in metaphase stage.
P19 (9.44 ± 1.46 μm) and the averages with smaller values in Langdon (8.72 ± 1.41 μm), IAC 1003 (8.79 ± 1.10 μm) and BH 1146 (9.00 ± 1.65 μm) cultivars. The TF values obtained for common and durum wheat ranged from 40.38 to 41.84% (average 41.19%) (Table 2). Thus, according to the TF values for karyotypes, all 5 genotypes were considered asymmetrical. Asymmetrical karyotype was also observed in hexaploid wheat by Arabbeigi et al. (2011).
(1971), the karyotypes of wheat genotypes analyzed in this study may be also considered asymmetric once they present chromosome pairs quite different in length, that is, these karyotypes are considered heterogeneous regarding the length of their chromosomes.
The highest chromosome length was identified in the landrace P33 (14.09 ± 1.87 μm), followed by BH 1146 and P19 (12.58 ± 1.87 μm and 12.13 ± 1.79 μm, respectively), while the smallest chromosome length was identified in the genotypes BH 1146 and Langdon (5.88 ± 0.77 μm and 6.19 ± 1.18 μm, respectively) (Table 1). As expected, the common wheat cultivar BH 1146 had complement with the smallest chromosomal lengths when compared to lengths of the chromosomal complements of durum wheat genotypes. One explanation that could justify the smaller chromosomes is the presence of the D genome chromosomes in the complement of BH 1146, because, as shown by Jahan and Vahidy (1989) and Gill et al. (1991), the common wheat has the AABBDD genome while durum wheat has the AABB genome, and the D genome chromosomes are smaller when compared with chromosomes of A and B genomes.
All analyzed genotypes in this study, either tetraploid or hexaploid, showed the presence of 2 pairs of chromosomes carrying satellites (SAT) on the short arms. That is a common feature among the T. turgidum ssp. durum and
T. aestivum species. Chromosomes that have satellites (SAT) normally are carriers of nucleolar organizing regions (NORs). There is 1 pair of this kind of chromosome per genome. Common wheat (BH 1146) has 3 genomes (ABD) but it presents only 2 pairs of these chromosomes in its complement. This fact leads to the conclusion that a third pair in the complement may have been suppressed because of a dominance interaction in hybrid genomes, as mentioned by Pikaard (2000).
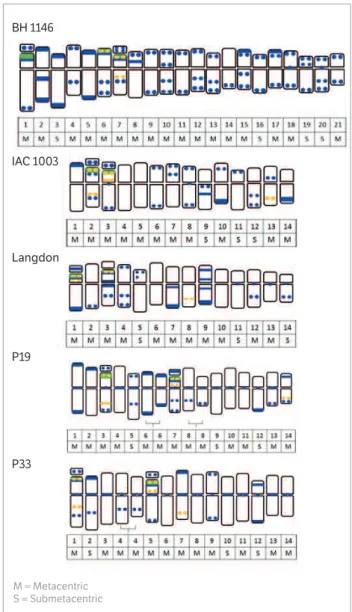
Two pairs of homologous chromosomes, heteromorphic in length, were found in P19 (pairs 6 and 8) and 1 in P33 (pair 4) (Figure 1). Differences among homologous pairs of heteromorphic chromosomes with different lengths were complemented by comparing the banding patterns obtained with DAPI fluorochrome. As described previously by Schubert (2007), chromosomes can be modified within a group of organisms by chromosome rearrangements. Thus, the difference in morphology between heteromorphic homologous pairs can be explained by problems during the replication process when changes such as insertions
or deletions may promote the shrinkage or expansion of chromosomes.
BH 1146
IAC 1003
Langdon
P19
P33
M = Metacentric S = Submetacentric
Figure 1. Idiograms of karyotypes of Triticum sp. BH 1146, IAC 1003,
Langdon, P19 and P33. Banding with 4’-6-Diamidino-2-phenylindole/ Actinomycin D (DAPI/AMD; blue), Chromomycin A3 with Distamycin (CMA/DA; orange) and FISH-45S rDNA - pTa71 probe hybridization sites (green). Heteromorphic pairs of chromosomes are shown for genotypes P19 (chromosomes 6 and 8) and P33 (chromosome 4).
Distribution of 4’-6-Diamidino-2-phenylindole, Chromomycin A3 bands and location of 45S rDNA
the chromosome complements of different genotypes (Figure 2). The DAPI/CMA techniques assisted in linear characterization of the homologous chromosome pairs and FISH assisted in the identification of chromosomes with NORs. Regarding the banding with fluorochromes, it was found that all accesses complements had chromosomes with larger amount of heterochromatin containing AT (DAPI positive bands) than CG bases (CMA positive bands) (Figure 1). Chromosomes showing no clearly defined DAPI and CMA positive bands, probably harbor heterochromatin with AT or GC bases evenly distributed and not in specific regions (Table 3).
4’-6-Diamidino-2-phenylindole banding
Considering the 5 accesses, positive DAPI heterochromatic regions were viewed either as bands or spots. The common wheat BH 1146 cultivar showed a typical heterochromatic pattern, with DAPI bands prevalent in the terminal regions of both short and long arms, and also interspersed in the chromosome. The durum wheat landraces P19 e P33, on the contrary, showed heterochromatin with a more concentrated pattern of positive DAPI bands in the proximal or centromeric region of chromosomes. The 2 other durum wheat cultivars, IAC 1003 and Langdon, presented dispersed bands along the length of the chromosomes.
The durum and common wheat genotypes also showed, in addition to differences in the pattern and location of DAPI bands along the chromosomes for each genotype, differences in the resulting number of the total sum of such bands for each complement. The BH 1146 cultivar showed higher amount of DAPI bands (total of 114), when compared to the other four durum wheat genotypes, with a variation in their number, from 46 to 60 positive DAPI
bands among different chromosome complements. The durum wheat landraces P19 and P33 had similar values for total quantity of DAPI bands per complement (60 and 58, respectively) and for equal number of total bands with short arms (16 bands). The IAC 1003 and Langdon cultivars, in turn, revealed a total of 46 and 50 bands, respectively, in the chromosome complement (Table 3). Except for the Langdon cultivar, that showed positive DAPI band in the SAT in just one pair of nucleolar chromosomes, all other genotypes exhibited both pairs of chromosomes with DAPI bands located in the SATs (Figure 1). The SATs regions of chromosomes were AT-rich.
Chromomycin A3 banding
The CMA fluorochrome banding presented six bands for complement of BH 1146 common wheat. These bands were restricted to 2 chromosome pairs (6 and 7), and one of these pairs is a SAT carrier (pair 7).
Durum wheat genotypes (IAC 1003, P19 and P33) showed 10 bands, except for the Langdon complement that presented seven bands for this fluorochrome. Positive CMA bands in all wheat genotypes were located in short and long arms in three chromosome pairs of each genotype, 2 of these chromosome pairs as SAT carriers. Genotypes showed bands in the following chromosome pairs: ‘IAC1003’ in 2, 3 (with SAT) and 13; ‘Langdon’ in 1, 3 (with SAT) and 8 (only 1 chromosome in pair 8 presented the CMA band); P19 in 3, 7 (with SAT) and 14; and P33 in 1, 5 (with SAT) and 7 (Figure 1, Table 3).
Durum wheat (tetraploid) accessions present a smaller number of chromosomes (2n = 28) and 2 genomes (AABB), and common wheat (hexaploid) has a higher chromosome number (2n = 42) and 3 genomes (AABBDD), nevertheless
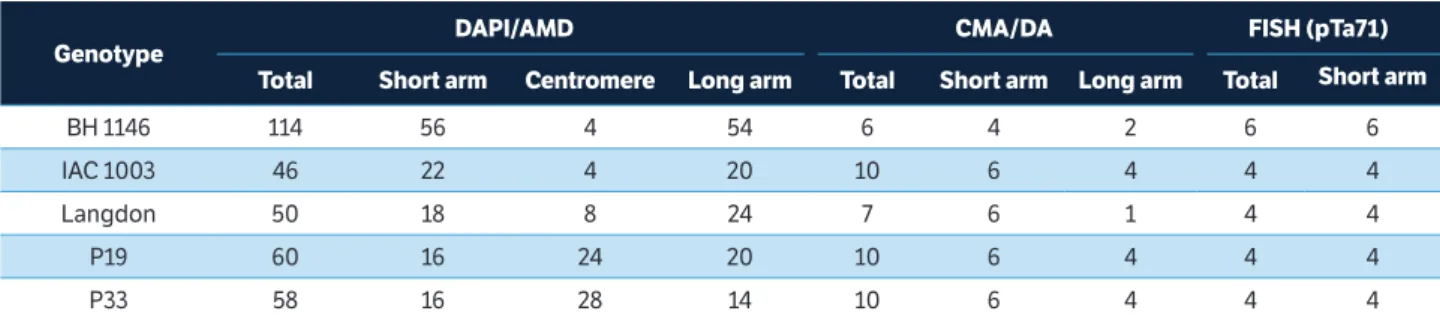
DAPI/AMD = 4’-6-Diamidino-2-phenylindole with Actinomycin D; CMA/DA = Chromomycin A3 with Distamycin; FISH = Fluorescence in situ hybridization.
Table 3. Total number and arms (short and long) of 4’-6-Diamidino-2-phenylindole with Actinomycin D; Chromomycin A3 with Distamycin
bands and FISH-rDNA 45S hybridization signals on chromosome complement of common wheat (BH 1146) and durum wheat (IAC 1003, Langdon, P19 and P33).
Genotype
DAPI/AMD CMA/DA FISH (pTa71)
Total Short arm Centromere Long arm Total Short arm Long arm Total Short arm
BH 1146 114 56 4 54 6 4 2 6 6
IAC 1003 46 22 4 20 10 6 4 4 4
Langdon 50 18 8 24 7 6 1 4 4
P19 60 16 24 20 10 6 4 4 4
durum wheat showed greater number of GC-content regions (8 or 10 bands) and common wheat had only 6 bands in its complement. Thus, there is an inversely proportional relationship between the amount of CMA positive bands and the number of chromosomes in the complements. The greatest amount of bands rich in GC-content in durum wheat may be related to a duplication process and in common wheat the smallest amount of positive CMA bands may be related to deletion of chromosomal segments rich in GC-content.
Location of 45S rDNA region
The results of the in situ hybridization technique for the location of 45S rDNA regions showed strong hybridization signals of chromosome pairs in the terminal and subterminal regions of short arms. Cultivars showed signals in the following chromosome pairs: 1, 6 and 7 in BH 1146 cultivar; 2 and 3 in IAC 1003 cultivar; 1 and 3 in Langdon cultivar; 3 and 7 in P19 landraces; and 1 and 5 in P33 landraces (Figures 1,2). All durum wheat genotypes (‘IAC 1003’, ‘Langdon’, P33 and P19) that are tetraploid (AABB) revealed 4 45S rDNA signals in 2 pairs of chromosome carriers of SAT. The BH 1146 common wheat cultivar, a hexaploid with AABBDD genomes, showed 6 signs located in 3 pairs of chromosomes (pairs 1, 6 and 7), 2 of them carriers of SAT (1 and 7). Similar results for number and location of 45S rDNA sites were also reported by El-Twab (2006), with 4 signals in durum wheat and 6 in common wheat located in the terminal and subterminal regions in short arms of chromosomes of Triticum aestivum and Triticum turgidum.
The amount of 45S rDNA signals found in durum wheat species that are tetraploid (4 signals) and common wheat species that are hexaploid (6 signals) is directly related to genomic allopolyploid constitution of the analyzed genotypes.
The size and intensity of 45S rDNA region hybridization signals differed within the complement in all genotypes. The BH 1146 cultivar revealed better signal on chromosome pair 1; IAC 1003 in par 2; Langdon in pair 1 and lines P19 and P33 in pairs 3 and 5, respectively. It is not possible to conclude whether the difference observed in the intensity and size of the signals are directly related to the ability of NOR expression. No technique was used to confirm whether the difference in signal intensity was related to
the expression of NOR. However, it would be possible to consider these differences in the number of 45S rDNA sequence repeats in different chromosomes.
It is known that hybrid organisms that contain multiple NORs have a dominant control mechanism for the expression of ribosomal genes such as DNA methylation and histone modification (Pikaard 1999; 2001; Carpeta et al. 2002). The existence of dominance relationships between NORs in hybrid genomes, like in tetraploid and hexaploid cultivars, could be confirmed by comparing the results of FISH-rDNA and the results of the impregnation with silver (AgNOR) technique and immunolocalization techniques for detecting DNA methylation patterns and histone modifications. The AgNOR technique, for example, would demonstrate only the number of NORs that were active or expressed in the last interphase, while the FISH-rDNA technique indicates the total number of NORs, both active and inactive. Some studies (Siljak-Yakovlev et al. 2002; Garcia et al. 2007; Oliveira et al. 2012) have shown that NOR matches the CMA banding in some species and thus such regions are GC-rich.
The location of the 45S rDNA signals in durum wheat genotypes (‘IAC 1003’, ‘Langdon’, P19 and P33) also co-located with the positive CMA bands in the short arm subterminal region of 2 chromosome pairs, carriers of SAT. However, in common wheat (BH 1146) from the 3 pairs of 45S rDNA signals present in the complement, only 2 co-located with the CMA bands present in the subterminal region in the short arm of chromosome pair number 7 (with SAT) and the terminal region of chromosome pair number 6 (without SAT). The third signal of 45S rDNA is located on chromosome pair number 1 (with SAT), which showed no CMA banding.
Multivariate analysis
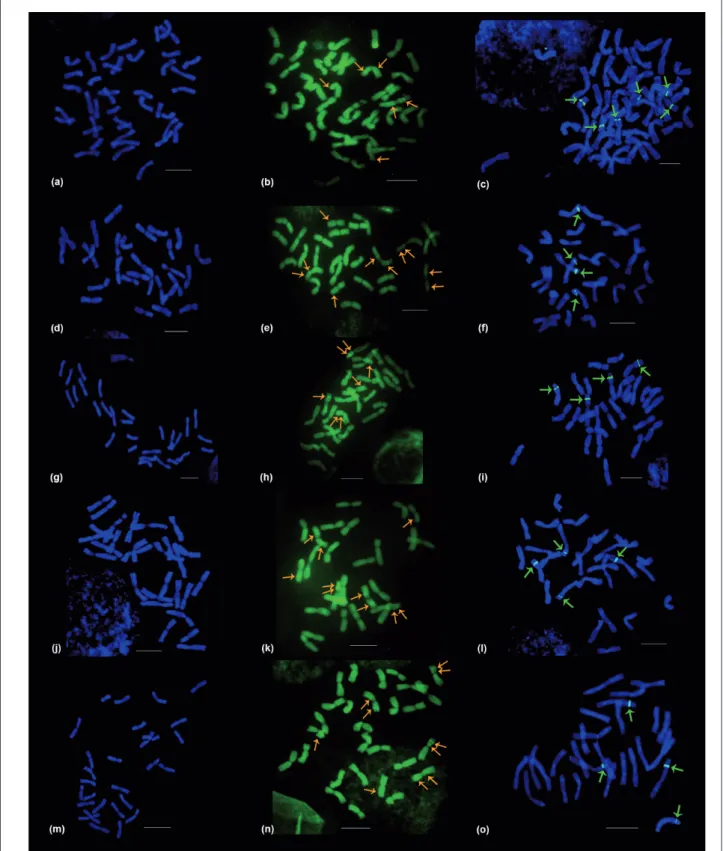
a, b and c = Common wheat BH 1146 cultivar; d, e and f = Durum wheat IAC 1003 cultivar; g, h and i = Langdon cultivar j, k and l = P19 line; m, n and o = P33 line; Orange arrow = CMA/DA; Green arrow = FISH-rDNA signals; Bar = 10 µm.
Figure 2. Metaphase chromosomes of Triticum sp.: 4’-6-Diamidino-2-phenylindole with Actinomycin D (DAPI/AMD); Chromomycin
A3 with Distamycin (CMA/DA) bands and FISH-rDNA 45S in situ hybridization signals (pTa71 probe with digoxigenin), from
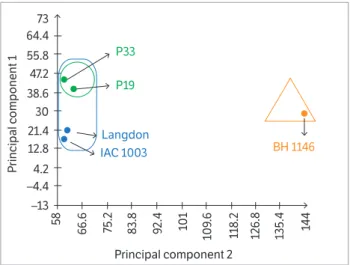
cumulative percentage of the total variance given the first 2 main components explained 99.43% of the total sample variance. According to Johnson and Wichern (2007), this percentage means that the variance of the sample is already well reported if summarized by only 2 main components. The cumulative percentage provided high reliability in the grouping and similarity between genotypes provided in the graph (Figure 3).
Few studies with kar yological data have been submitted to multivariate analysis and this analysis allowed the formation of groups with varying degrees of similarity. The PCA established 2 main groups, separating the genotypes between species. One group cont aine d T. aestiv um (BH 1146) and t he ot her
T. turgidum ssp. durum (IAC 1003, Langdon, P19 and P33). This grouping showed chromosomal variability, indicating the distinction of access between species and the genetic proximity of the accesses of the same species (Figure 3).
With the PCA analysis, it was possible to reveal that the P19 and P33 landraces from the crossing between BH 1146/Langdon//2*IAC 1003 showed greater similarity to each other when compared with other genotypes within the
group that contains the lines of durum wheat. Considering the parental of durum wheat species, Langdon cultivar was closer to P19 and P33 lines than to IAC 1003. This multivariate analysis allowed to observe that many of the chromosomal characteristics derived from Langdon remained preserved even after backcrossing with IAC 1003. As for the P19 and P33 landraces, in general, the data suggest that they inherited more chromosomal regions of Langdon and IAC 1003 durum wheat than BH 1146 common wheat.
Based on the results obtained in the clustering analysis, it can be concluded that morphological examination by phase contrast, chromosomal banding patterns obtained with the DAPI and CMA fluorochrome, as well as the location and the number of hybridization sites of the 45S rDNA sequences characterize the chromosomes and consequently differentiate the 5 genotypes.
CONCLUSION
Chromosomal characterization obtained by numerical and morphological analysis and the aforementioned techniques allow the localization and association of gene regions responsible for specific characteristic to their chromosomes, such as the gene or sequence that confers tolerance to aluminum toxicity, present in the BH 1146 cultivar. Thus, chromosomal characterization of P33 and P19 lines, for example, allow their use in the generation of introgression lines (addition or substitution lines) and in their use thereof in breeding programs. The application of the CMA/DAPI banding and FISH-rDNA 45S techniques in the progenies will assist in the identification and monitoring of the transfer of chromosome with the gene sequence that confers tolerance to aluminum toxicity.
ACKNOWLEDGEMENTS
To the Coordination for the Improvement of Higher Education Personnel (CAPES), for granting a Doctor’s scholarship to the first author.
Figure 3. Principal Component Analysis in 4 genotypes of durum wheat (IAC 1003, Langdon, P19 and P33) and 1 common wheat genotype (BH 1146) based on chromosome morphology, number of bands generated with 4’-6-Diamidino-2-phenylindole/Actinomycin D (DAPI/AMD), Chromomycin A3 with Distamycin (CMA/DA) banding
techniques and the amount of FISH-rDNA 45S (pTa71 probe) signal. Genes program (Cruz 2013).
73 64.4 BH 1146 IAC 1003 Langdon P19 P33 55.8 47.2 38.6 30 21.4 12.8 4.2 –4.4
Principal component 2
Aniol, A. (1984). Introduction of aluminum tolerance into
aluminum sensitive wheat cultivars. Plant Breeding, 93, 331-339.
Arabbeigi, M., Arzani, A. and Saeidi, G. (2011). Study of karyotype
and nucleolar organizer regions (NORs) in wild, synthetic and
cultivated wheats. Emirates Journal of Food and Agriculture,
23, 196-203. http://dx.doi.org/10.9755/ejfa.v23i2.6457.
Awika, J. M. (2011). Advances in cereal science: implications
to food processing and health promotion. ACS Symposium
Series — major cereal grain production and use around the
world. Washington: American Chemical Society.
Brammer, S.P., Poersch, L.B., Oliveira, A.R., Vasconcelos, S. and
Brasileiro-Vidal, A.C. (2009) Hibridização genômica in situ em
Triticeae: um enfoque metodológico. Comunicado técnico 270.
Técnico online. ISSN 1517-4964. Available at: http://www.cnpt.
embrapa.br/biblio/co/p_co270.htm. Accessed on May 30, 2016.
Camargo, C. E. O., Felício, J. C., Ferreira Filho, A. W. P. and
Lobato, M. T. V. (2006). Tolerância de genótipos de trigo comum,
trigo duro e triticale à toxicidade de alumínio em soluções
nutritivas. Bragantia, 65, 43-53. http://dx.doi.org/10.1590/ S0006-87052006000100007.
Camargo, C. E. O., Ferreira Filho, A. W. P. and Felício, J. C. (1999).
Herança da tolerância ao alumínio em trigo. Scientia Agricola, 56,
429-435. http://dx.doi.org/10.1590/S0103-90161999000200024.
Camargo, C. E. O., Santos, R. R. and Pettinelli Júnior, A. (1992). Trigo duro: tolerância à toxicidade do alumínio em
soluções nutritivas e no solo. Bragantia, 51, 69-76. http:// dx.doi.org/10.1590/S0006-87051992000100010.
Carpeta, A. d., Neves, N., Morais-Cecílio, L., Malho, R. and
Viegas, W. (2002). Genome restructuring in rye affects the
expression, organization and disposition of homologous rdNA
loci. Journal of Cell Science, 115, 2839-2846.
Cruz, C. d. (2013). GENES — a software package for analysis
in experimental statistics and quantitative genetics. Acta
Scientiarum, 35, 271-276. http://dx.doi.org/10.4025/actasciagron. v35i3.21251.
Cuadrado, A., Carmona, A. and Jouve, N. (2013). Chromosomal
characterization of the three subgenomes in the polyploids
of Hordeum murinum L.: new insight into the evolution of
REFERENCES
this complex. Plos One, 8, e81385. http://dx.doi.org/10.1371/ journal.pone.0081385.
del Guercio, A. M. F. and Camargo, C. E. O. (2011). Herança da
tolerância à toxicidade de alumínio em trigo duro. Bragantia, 70,
775-780. http://dx.doi.org/10.1590/S0006-87052011000400007.
El-Twab, M. H. A. (2006). Physical mapping of the 45S rdNA on
the chromosomes of Triticum turgidum and T. aestivumusing
fluorescence in situ hybridization for chromosome ancestors.
Arab Journal of Biotechnology, 10, 69-80.
Endo, T. R., Kubaláková, M., Vrána, J. and dolezel, J. (2014).
Hyperexpansion of wheat chromosomes sorted by flow
cytometry. Genes Genetic Systems, 89, 181-185. http://dx.doi. org/10.1266/ggs.89.181.
Fageria, N. K. and Stone, L. F. (1999). Manejo da acidez dos
solos de cerrado e de várzea do Brasil. Santo Antônio de Goiás:
Embrapa Arroz e Feijão.
Felício, J. C., Camargo, C. E. O., Magno, C. P. S., Freitas, J. G.,
Bortoletto, N., Pettinelli Junior, A., Gallo, P. B. and Pereira, J. C. V.
N. A. (1999). Novos genótipos de Triticum durum L.: rendimento,
adaptabilidade e qualidade tecnológica. Bragantia, 58, 83-94.
http://dx.doi.org/10.1590/S0006-87051999000100010.
Garcia, S., Garnatje, T., Hidalgo, O., McArthur, E. d.,
Siljak-Yakovlev, S. and Vallès, J. (2007). Extensive ribosomal dNA
(18S-5.8S-26S and 5S) co-localization in the North American
endemic sagebrushes (subgenus Tridentatae, Artemisia,
Asteraceae) revealed by FISH. Plant Systematics and Evolution,
267, 79-92. http://dx.doi.org/10.1007/s00606-007-0558-6.
Gill, B. S., Friebe, B. and Endo, T. R. (1991). Standard karyotype
and nomenclature system for description of chromosome
bands and structural aberrations in wheat (Triticum aestivum).
Genome, 34, 830-839. http://dx.doi.org/10.1139/g91-128.
Huziwara, Y. (1958). Karyotype analysis in some genera of
Compositae. VI: The chromosomes of some Erigeron species.
Caryologia, 11, 158-164. http://dx.doi.org/10.1080/00087114 .1958.10797040.
Huziwara, Y. (1962). Karyotype analysis in some genera of
Compositae.VIII. Further studies on the chromosome of Aster.
Iacia, A. A. S. and Pinto-Maglio, C. A. F. (2013). Mapping pachytene chromosomes of coffee using a modified protocol for fluorescence in situ hybridization. AoB Plants, 5, 1-12. http:// dx.doi.org/10.1093/aobpla/plt040.
Jahan, Q. and Vahidy, A. A. (1989). Karyotype analysis of
hexaploide wheat, Triticum aestivum L. cv. ‘Sarsabz’. Genetics, 2, 179-181.
Johnson, R. A. and Wichern, d. W. (2007). Applied multivariate statistical analysis. 6. ed. New Jersey: Prentice Hall.
Joppa, L. R. and Williams, N. d. (1988). Langdon durum disomic substitution lines and aneuploid analysis in tetraploid wheat. Genome, 30, 222-228. http://dx.doi.org/10.1139/g88-038.
Kirov, L., divashuk, M., Laere, K. V., Soloviev, A. and Khrustaleva,
L. (2014). An easy “Steamdrop” method for high quality plant chromosome preparation. Molecular Cytogenetics, 7, 1-10.
http://dx.doi.org/10.1186/1755-8166-7-21.
Lagos, M. B., Fernandes, M. I. B. M., Camargo, C. E. O., Federizzi, L. C. and Carvalho, F. I. F. (1991). Genetics and monosomic
analysis of aluminum tolerance in wheat (Triticum aestivum L.). Revista Brasileira de Genética, 14, 1011-1020.
Levan, A., Fredga, K. and Sandberg, A. A. (1964). Nomenclature for centromeric position on chromosomes. Hereditas, 52, 201-220. http://dx.doi.org/10.1111/j.1601-5223.1964.tb01953.x.
Lukaszewski, A. J., Kopecky, d. and Line, G. (2012). Inversion of chromosome arms 4AL and 2BL in wheat invert the patterns
of chiasma distribution. Chromosoma, 121, 201-208. http:// dx.doi.org/10.1007/s00412-011-0354-5.
Luo, M. C. and dvorak, J. (1996). Molecular mapping of an aluminum tolerance locus on chromosome 4d of Chinese Spring wheat. Euphytica, 91, 31-35. http://dx.doi.org/10.1007/ BF00035273.
Nardy, M., Yuyama, P. M., Rego, L. N. A. A. and Vanzela, A. L. L.
(2010). Chromosome banding patterns and localization of 5S and 45S rdNA sites in three shrub-tree species of Erythrina L. (Leguminosae: Papilionoideae) from Brazil. Revista Brasileira
de Biociências, 8, 149-153.
Oliveira, V. M., Mansanares, M. E., Semir, J. and Forni-Martins,
E. R. (2012). Karyotype characterization of two populations of Vernonia geminate (Asteraceae, Vernonieae) using banding and FISH techniques. Genetics and Molecular Research, 11,
4204-4212.
Pang, Y., Chen, X., Zhao, J., du, W., Cheng, X., Wu, J., Li, Y., Wang, L., Wang, J. and Yang, Q. (2014). Molecular cytogenetic characterization of a wheat — Leymus mollis 3d(3Ns)
substitution line with resistance to leaf rust. Journal of Genetics
and Genomics, 41, 205-214. http://dx.doi.org/10.1016/j.
jgg.2013.11.008.
Pendás, A. M., Morán, P. and Garcia-Vázquez, E. (1993). Ribosomal RNA genes are interspersed throughout a heterochromatic
chromosome arm in Atlantic salmon. Cytogenetics and Cell Genetics, 63, 128-130. http://dx.doi.org/10.1159/000133517.
Pikaard, C. S. (1999). Nucleolar dominance and silencing of transcription. Trends in Plant Science, 4, 478-483. http://dx.doi. org/10.1016/S1360-1385(99)01501-0.
Pikaard, C. S. (2000). Nucleolar dominance: uniparental gene silencing on a multi-megabase scale in genetic
hybrids. Plant Molecular Biology, 43, 163-177. http://dx.doi. org/10.1023/A:1006471009225.
Pikaard, C. S. (2001). Genomic change and gene silencing in polyploids. Trends in Genetics, 17, 675-677. http://dx.doi. org/10.1016/S0168-9525(01)02545-8.
Reeves, A. (2001). MicroMeasure: A new computer program for the collection and analysis of cytogenetic data. Genome,
44, 439-443. http://dx.doi.org/10.1139/g01-037.
Ryan, P. R., Raman, H., Gupta, S., Horst, W. J. and delhaize, E. (2009). A second mechanism for aluminum resistance in wheat relies on the constitutive efflux of citrate from roots. Plant Physiology, 149, 340-351. http:/ / dx. doi. org/ 10. 1104/ pp. 108. 129155.
Schubert, I. (2007). Chromosome evolution. Current Opinion
in Plant Biology, 10, 109-115.
Schweizer, d. (1976). Reverse fluorescent chromosome banding
with chromomycin and dAPI. Chromosoma, 58, 307-324. http:/ / dx. doi. org/10.1007/BF00292840.
Siljak-Yakovlev, S., Cerbah, M. and Coulaud, J. (2002). Nuclear dNA content, base composition, heterochromatin and rdNA in Picea omorika and Picea abies. Theoretical Applied Genetics,
104, 505-512. http:/ / dx. doi. org/10.1007/s001220100755.
Silva, A. H., Camargo, C. E. O. and Ramos Júnior, E. U. (2010).
Stebbins, G. L. (1971). Chromosomal evolution in higher plants. London: Edward Arnold.
Tang, Z., Li, M., Chen, L., Wang, Y., Ren, Z. and Fu, S. (2014).
New types of wheat chromosomal structural variations in derivatives of wheat-rye hybrids. Plos One, 9, e110282. http:// dx.doi.org/10.1371/journal.pone.0110282.
Zhang, H., Bian, Y., Gou, X., Zhu, B., Xu, C., Qi, B., Li, N.,
Rustgi, S., Zhou, H., Han, F., Jiang, J., Wettstein, d. and Liu, B. (2012). Persistent whole-chromosome aneuploidy
is generally associated with nascent allohexaploid wheat.
Proceedings of the National Academy of Sciences of the
United States of America, 110, 3447-3452. http://dx.doi. org/10.1073/pnas.1300153110.
Zhang, H., Li, G., Li, d., Gao, d., Zhang, J., Yang, E. and Yang,
Z. (2015). Molecular and cytogenetic characterization of new
wheat — Dasypyrum breviaristatum derivatives with