Tissue and Serum miRNA Profile in Locally
Advanced Breast Cancer (LABC) in Response
to Neo-Adjuvant Chemotherapy (NAC)
Treatment
Manal Al-Khanbashi1, Stefano Caramuta2, Adil M. Alajmi3, Ibrahim Al-Haddabi4, Marwa Al-Riyami4, Weng-Onn Lui2, Mansour S. Al-Moundhri1*
1Medical Oncology Unit, Department of Medicine, College of Medicine and Health Sciences, Sultan Qaboos University, Muscat, Oman,2Department of Oncology-Pathology, Karolinska institute, Cancer Center Karolinska, Karolinska University Hospital-Solna, Stockholm, Sweden,3Department of Surgery, College of Medicine and Health Sciences, Sultan Qaboos University, Muscat, Oman,4Department of Pathology, College of Medicine, Sultan Qaboos University, Muscat, Oman
*mansours@squ.edu.om
Abstract
Introduction
MicroRNAs (miRNAs) are small non-coding RNA that plays a vital role in cancer progres-sion. Neo-adjuvant chemotherapy (NAC) has become the standard of care for locally advanced breast cancer. The aim of this study was to evaluate miRNA alterations during NAC using multiple samples of tissue and serum to correlate miRNA expression with clin-ico-pathological features and patient outcomes.
Methods
Tissue and serum samples were collected from patients with locally advanced breast can-cer undergoing NAC at four time points: time of diagnosis, after the first and fourth cycle of doxorubicin/cyclophosphamide treatment, and after the fourth cycle of docetaxel adminis-tration. First, we evaluated the miRNA expression profiles in tissue and correlated expres-sion with clinico-pathological features. Then, a panel of four miRNAs (miR-451, miR-3200, miR-21, and miR-205) in serum samples was further validated using quantitative reverse-transcription polymerase chain reaction (RT-qPCR). The alterations in serum levels of miRNA, associations with clinical and pathological responses, correlation with clinico-path-ological features, and survival outcomes were studied using Friedman, Mann-Whitney U, and Spearman, Wilcoxon signed-ranks tests.P0.05 was considered statistically
significant.
Results
We analyzed 72 tissue samples and 108 serum samples from 9 patients and 27 patients, respectively. MicroRNA expression profiling of tumor versus normal tissue revealed more
a11111
OPEN ACCESS
Citation:Al-Khanbashi M, Caramuta S, Alajmi AM, Al-Haddabi I, Al-Riyami M, Lui W-O, et al. (2016) Tissue and Serum miRNA Profile in Locally Advanced Breast Cancer (LABC) in Response to Neo-Adjuvant Chemotherapy (NAC) Treatment. PLoS ONE 11(4): e0152032. doi:10.1371/journal. pone.0152032
Editor:Abdelilah Aboussekhra, King Faisal Specialist Hospital & Research center, SAUDI ARABIA
Received:October 19, 2015
Accepted:March 8, 2016
Published:April 11, 2016
Copyright:© 2016 Al-Khanbashi et al. This is an open access article distributed under the terms of the Creative Commons Attribution License, which permits unrestricted use, distribution, and reproduction in any medium, provided the original author and source are credited.
Data Availability Statement:Data are available from the database (GEO) and the accession number: GSE70754.
Funding:The study is funded by Oman research council. The funders had no role in study design, data collection and analysis, decision to publish, or preparation of the manuscript.
than 100 differentially expressed miRNAs. Serum miR-451 levels were significantly decreased during treatment, and higher serum levels were associated with improved clini-cal and pathologiclini-cal responses and disease-free survival. This is one of the early reports on miR-3200 in response to treatment in breast cancer, as serum levels of miR-3200 found to decline during NAC, and higher serum levels were associated with lower residual breast cancer burden and relapse rates at time of diagnosis.
Conclusion
Variations in serum miRNA levels during NAC treatment may be therapeutically significant for predicting response and survival outcomes.
Introduction
Breast cancer is the most common cancer in females worldwide and therefore represents a sig-nificant global health burden[1]. The current treatment regimen of breast cancer involves mul-timodalities including chemotherapy, surgery, radiotherapy, hormonal treatment, and targeted therapy[2]. The choice and sequence of these modalities depend on the stage at presentation, estrogen receptor (ER) and progesterone receptor (PR), and human epidermal growth factor receptor 2 (Her2/neu) statuses. Currently, the administration of neo-adjuvant chemotherapy (NAC) prior to surgery is considered the standard practice in locally advanced breast cancer (LABC). NAC improves surgical resectability and breast conservation[3]. Moreover, several studies have suggested that patients who achieve a complete pathological response gain an overall survival benefit[4].
between breast cancer patients and healthy individuals. Higher miR-155 circulating levels are found in PR-positive tumors compared with negative ones[17]. Wanget alshowed that the rel-ative expression of miR-21, miR-126, miR-155, miR-199a, and miR-335 is closely associated with breast cancer histologic tumor grade and sex hormone receptor expression status[18]. Cir-culating miR-21 differentiated patients with loco-regional disease from those with metastases [15]. Whereas some other studies showed distinctive miRNA expression patterns among dif-ferent molecular subtypes [19]. Therefore, all above studies suggest the potential utility of miR-NAs as predictive, diagnostic and prognostic biomarkers.
This current study focused on a subset of breast cancer patients with locally advanced dis-ease, making it distinct from other studies that include all stages of breast cancer or primarily early stages. We focused on Locally Advanced Breast Cancer (LABC) cases for many reasons as it provides an excellentin vivomodel to study the effect of NAC on miRNA profile as not many studies are available and also that many cases of the diagnosed patient in the Sultanate of Oman are of LABC nature. Moreover, this is the bestin vivoclinical model where both tissue and serum miRNA expression alterations can be correlated with pathological response in par-ticular which has been shown to predict survival.
We examined miRNA expression during NAC treatment in a dynamic fashion with multi-ple tissue and serum sammulti-ples taken at various times over the course of treatment. The study hypothesized that miRNA dynamic expression levels in tissue and serum vary significantly during NAC at different time points. Moreover, these changes in miRNA expression during NAC correlate with clinical and pathological responses and survival.
Materials and Methods
Patients, treatment, and characterization
We recruited 27 consecutive patients diagnosed with locally advanced breast cancer undergo-ing NAC treatment at Sultan Qaboos University Hospital from 2010 to 2012. Patients were classified and staged according to the American Joint Committee on Cancer (AJCC) and tumor node metastasis (TNM) classification systems [20]. The NAC regimen included 4 cycles of doxorubicin hydrochloride (60mg/m2intravenously [IV]) and cyclophosphamide (600mg/ m2IV) every three weeks, followed by 4 cycles of docetaxel (75mg/m2[IV]) every three weeks. Patients with Her2/neuoverexpression received trastuzumab (6mg/kg IV) with docetaxel once every three weeks for one year. The study was approved by the Ethical Committee at Sultan Qaboos University Ethics and was conducted in accordance to Helsinki Declaration. Written informed consent from each patient was obtained. The clinico-pathological data were retrieved from the Hospital Information System in accordance with the hospital’s privacy rules.
We evaluated the treatment responses of patients according to clinical and pathological out-comes. The clinical response was evaluated according to the World Health Organization (WHO) and the Response Evaluation Criteria In Solid Tumors (RECIST) 1.1 [21]:(1) complete response was defined as a complete disappearance of the tumor mass, (2) partial response was defined as a50% reduction in the product of two perpendicular dimensions of the tumor mass, (3)progressive disease (PD) was defined as a25% increase in the product of two per-pendicular dimensions of tumor, and (4) stable disease (SD) was defined as a change that did not meet the criteria for any other categories. In this study, patients with complete and partial responses were categorized as responders, and patients with SD and PD as non-responders.
d2), (2) the proportion of the tumor bed encompassing invasive carcinoma (fin), (3) metastatic axillary lymph nodes (LN), and (4) the diameter of the largest metastasis in an axillary lymph node (dmet). To calculate a single RCB class index, we calculated RCBprimand RCBmetusing the
formula in which RCBprim=findprimand RCBmet= 4(1–0.75LN)dmet. The RCB score was calcu-lated using the MD Anderson Residual Cancer Burden Calculator (www3.mdanderson.org/ app/medcalc/index.cfm?pagename=jsconvert3). We grouped patients with an RCB score of 0 or I as responders, and II or III as non-responders.
Sample collection and storage
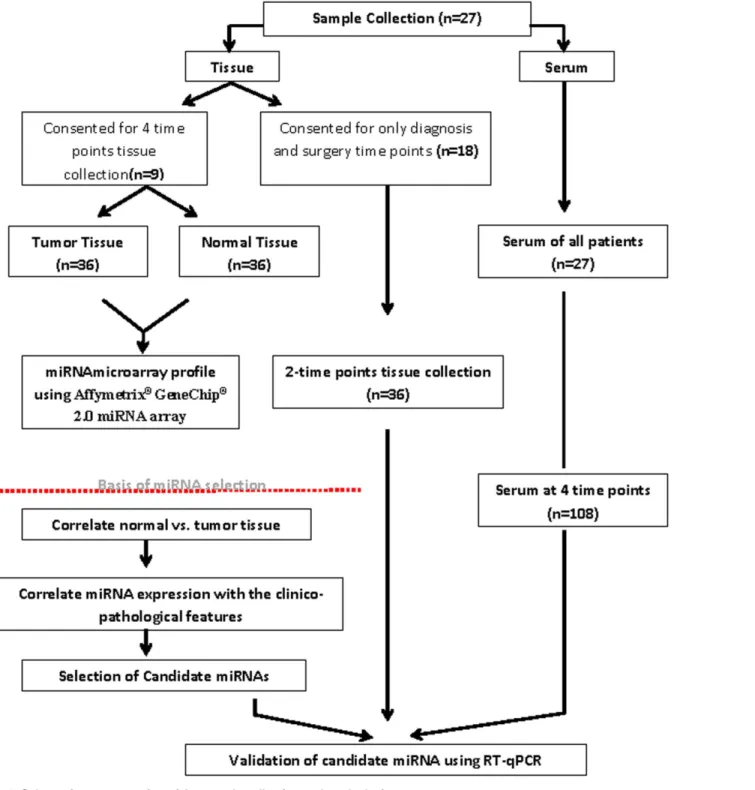
From each patient (n = 9; out of the total 27 included in the study), matched tumor tissue (n = 36) paired with tumor-adjacent normal tissue (n = 36) and their peripheral blood samples (n = 36) were biopsied and collected by a breast surgeon using tru-cut biopsy needle gauge 14g x 10cm (BARD1
MC1410) at the time of diagnosis (baseline, point A), after the first cycle of doxorubicin/cyclophosphamide (point B), after the fourth cycle of doxorubicin/cyclophospha-mide (point C), and at the time of surgery following 4 cycles of docetaxel treatment (point D). For the rest of the cohort (n = 18) few patients consented for biopsy tissue (normal and tumor) at diagnosis and surgical specimens, however peripheral blood samples were collected for all patients at 4 time points.Fig 1summarizes the sample collection and study design (Fig 1). An Oncology nurse collected peripheral blood samples were collected from the patients attending for their chemotherapy treatment in the daycare unit and sera were obtained after they were allowed to coagulate at room temperature for at least 1hr and when the clot formation was observed it was centrifuged at 2000g for 10min. All samples were stored at -80°C until they were used for further analysis. Tissue samples were flash frozen with liquid nitrogen then stored at -80°C; serum was aliquoted and stored at -80°C. The samples did not undergo more than one freeze/thaw cycle before RNA extraction was performed.
Tissue and serum total RNA isolation
Total RNA from tissue and serum (500μL) samples was extracted using the mirVanaTMmiRNA
isolation kit (Applied Biosystems/Ambion, Austin, TX, USA) in accordance with the manufac-turer’s recommendation. Quantification of total RNA was performed using the Nanodrop (ND-1000, ThermoScientific, MA, USA)[23].
MicroRNA microarray profiling
MicroRNA microarray profiling was performed on a cohort of 72 tissue samples from 9 patients at four different time points during treatment (36 tumor tissues and 36 tumor-adja-cent healthy tissues) using the Affymetrix1
GeneChip1
2.0 miRNA array (Affymetrix, Inc., Santa Clara, CA, USA). The microarray experiments were performed by EpigenDx, Inc. (Hop-kinton, MA, USA) and the Bioinformatics and Expression Analysis core facility at Karolinska Institute, Sweden. A total of 500ng of RNA was labeled using the Flash TagTMBiotin HSR RNA labeling kit (Affymetrix, Inc., Santa Clara, CA, USA). Hybridization, washing, and stain-ing were performed accordstain-ing to the standard protocols from Affymetrix. Arrays were scanned using the Affymetrix1
GeneChip1
Quantitative reverse-transcription polymerase chain reaction
(RT-qPCR)
We determined the expression levels of miR-21, miR-3200, miR-451, and miR-205 using the predesigned TaqMan MicroRNA assay (Life Technologies, Foster City, CA, USA). We Fig 1. Schematic representation of the sample collection and study design.
synthesized cDNA from 100ng of total RNA using the TaqMan1
MicroRNA Reverse Tran-scription kit (Life Technologies) and performed RT-qPCR using the 7900HT Fast Real-Time PCR System (Life Technologies)[24]. RNU6B or miR-191[25] was used as an endogenous con-trol to normalize tissue or serum samples[26], respectively. All reactions were performed in triplicate, and relative expression of miRNA throughout the treatment time points was deter-mined using the CTmethod and reported as 2-ΔCT.
Statistical analysis
Univariate analysis of the Friedman test was used to assess changes in miRNA expression across different time points. At each time point, the Mann-Whitney U test was applied to assess significant changes in the expression levels of miRNA in relation to treatment response and based on RCB class. Bivariate Spearman's rank correlation coefficient analysis was performed for all correlation analyses. Pair-wise comparisons of mina expression at points A (baseline) and D (end of treatment) were evaluated using the Wilcoxon signed-ranks test. Disease-free survival (DFS) was measured from the date of diagnosis until patient relapse and/or censor at the date of last follow up. Overall survival (OS) was measured from the date of diagnosis to the date of death or date of analyses. Both OS and DFS analyses were evaluated using Kaplan-Meier curves and the log-rank test. Statistical analyses were performed using SPSS v.21.0 Soft-ware (SPSS Inc., Chicago, IL), andP0.05 was considered statistically significant.
Results
This study enrolled 27 patients with locally advanced breast cancer attending the Sultan Qaboos University Hospital from 2010 to 2012. The clinico-pathological features are
Table 1. Clinical characteristics of enrolled patients before chemotherapy (n = 27).
Characteristics n %
Age
45 15 55.6
>45 12 44.4
Menopausal status
Pre-menopausal 17 62.96
Post-menopausal 10 37.04
Skin involvement
Yes 12 44.4
No 15 55.6
Tumor Differentiation
Well and Moderate 14 51.9
Poor 13 48.1
Estrogen receptor status
ER+ 21 77.8
ER- 6 22.2
Progesterone receptor status
PR+ 19 70.4
PR- 8 29.6
Her2/neu receptor status
Her2/neu+ 7 25.9
Her2/neu- 20 74.1
summarized inTable 1. The cohort of patients was relatively young compared with other stud-ies, with a mean age (±SD) of 43.33 years (±10.07). We found significant breast cancer burden in these patients; clinical T3 and T4 lesions were present in 77.8% of patients, and N2/N3 lymph node and skin involvement were found in 41.7% and 44.4% of patients, respectively, as shown in Tables1and2. Luminal (A+B), triple-negative, and Her2/neusubtypes were found in 77.8%, 14.8%, and 7.4% of patients, respectively.
Clinical and pathological responses
The clinical and pathological responses are presented inTable 2. The clinical response assess-ments showed that, after chemotherapy, 5 patients (18.5%) achieved a complete clinical response and 18 patients (66.7%) achieved a partial response with no progressive disease. The pathological responses included a reduction in T stage after chemotherapy with a decrease in the percentage of patients with T4 lesions (from 63% to 37%) and an increase in the percentage of patients with T1 lesions (from 14.8% to 29.6%). However, only 2 patients (7.4%) achieved a complete pathological response of the primary tumor lesions and lymph nodes, as shown in
Table 2. Cancer staging, clinical responses, and pathological responses before and after treatment.
Cancer staging, clinical and pathological responses
Before Chemotherapy After Chemotherapy
Characteristics n % Characteristics n %
T stage (T) T stage(T)
T0 0 0 ypT0 2 7.4
T1 4 14.8 ypT1 8 29.6
T2 2 7.4 ypT2 2 7.4
T3 4 14.8 ypT3 5 18.5
T4 17 63.0 ypT4 10 37.0
LN stage(N) LN stage(N)
N0 7 25.9 ypN0 9 33.3
N1 8 29.6 ypN1 9 33.3
N2 8 29.6 ypN2 5 18.5
N3 4 14.8 ypN3 4 14.8
Metastasis(M) Metastasis (M)
Absent 23 85.2 Absent 23 85.2
Present 4 14.8 Present 4 14.8
TNM Clinical stage TNM Pathological stage
I 0 0 I 4 14.8
II 9 33.3 II 10 37.0
III 14 51.9 III 9 33.3
IV 4 14.8 IV 4 14.8
Overall Clinical Response Residual Cancer Burden (RCB)
cCR 5 18.5 0 0 0
cPR 18 66.7 I 4 14.8
cSD 4 14.8 II 14 51.9
cPD 0 0 III 9 33.3
CS = clinical stage, T = clinical tumor stage, N = clinical lymph node stage, M = metastasis, ypT+ ypN = pathological stage after treatment of tumor and lymph node, PS = pathological stage after treatment.
Table 2. We further assessed pathological response by calculating the RCB score, which takes into account the response in the primary tumor mass and lymph nodes. The RCB scores were0, II, III, and I in 0, 4, 14, and 9 patients, respectively. We did not detect any changes in ER/PR status or Her2/neustatus after chemotherapy.
Differential expression of miRNAs in tumor versus tumor-adjacent
healthy tissue
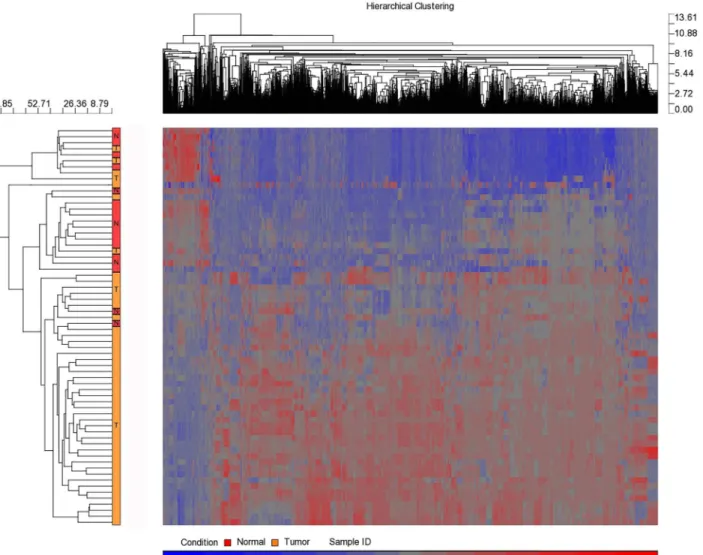
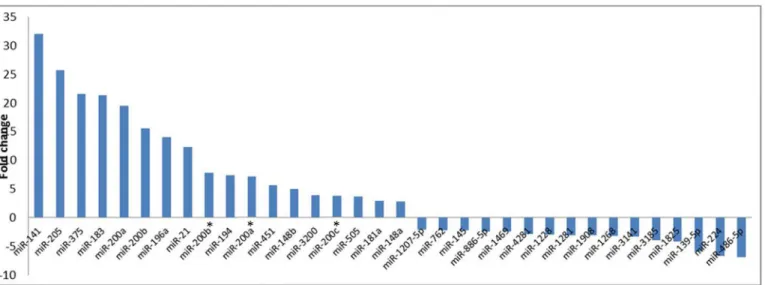
MicroRNA expression profiling of normal tissue (n = 9) versus tumor (n = 9) at four time points (total 72 samples of the 4 follow-ups and the normal of two time points A and D) revealed more than 100 differentially expressed human miRNAs (Fig 2andS1 Table).Fig 3 presents some of the miRNAs that significantly differed in expression level (P<0.05) prior to neo-adjuvant chemotherapy administration. Some miRNA levels were increased 2- to 32-fold, whereas other miRNA levels were under-expressed in cancer tissues 2- to 6-fold.
Fig 2. Hierarchal clustering of healthy versus tumor breast cancer tissue samples.Over 100 detected miRNAs that were differentially expressed. Heat
map colors represent miRNA expression as indicated in the color key where tumor samples are from the all patients whereas normal tissue from the full follow-up patients.
The correlation between tissue miRNA levels and clinico-pathological
features
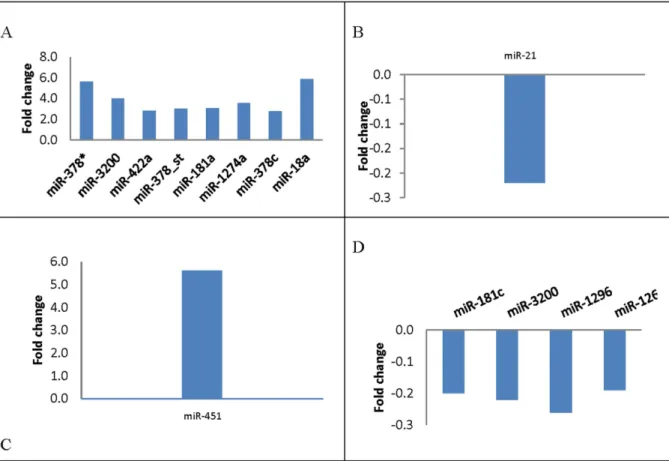
The statistical technique SAM was used to identify which specific miRNA expression correlated with clinico-pathological features at base line level. With false-discovery rate of no more than 0%, the analysis identified 8 deregulated miRNAs correlated with ER-positive patients, 1 miRNA correlated with recurrence, 1 miRNA correlated with pathological stage, and 4 miRNAs correlated with triple-negative breast cancer (Fig 4).
Because of the large number of differentially expressed miRNAs, we selected only few miRNAs for further validation in serum. These were chosen based on their significant differ-ential expression between tumor tissue and tumor-adjacent normal tissue (>2-fold increase) and their correlation with clinico-pathological features either strong positive or negative. Therefore, miR-21, miR-3200, miR-451, and miR-205 were selected for further validation in tissue and serum. For these miRNAs, we analyzed their expression levels over the course of the NAC treatment as well as their correlation with clinico-pathological features, clinical and pathological responses, and survival outcomes.
Tissue miRNA levels alteration during NAC treatment
Tissue levels of miR-451, miR-3200, miR-21, and miR-205 were validated at various times dur-ing NAC. We found no statistically significant differences in fold change of miRNA levels between points A and D in the normal tissue tumor-adjacent (n = 5). Moreover, we found no statistically significant differences in miRNA levels alterations in the tumor tissue between points A and D (n = 10) and at all-time points where full set of tumor tissue samples were avail-able for patients (n = 8).
Tissue versus serum miRNA level during NAC treatment
We correlated tissue and serum miRNA levels at various time points. We found that at the abundance of the miRNAs was highly variable between tumor tissue and serum samples col-lected prior to administration of chemotherapy. They were all more highly expressed in tissue than serum, except for miR-451, whose expression was 19 times higher in serum compared Fig 3. Differential expression of some randomly selected miRNAs between normal and breast cancer tumor tissue samples with various fold changes.
with tumor tissue. During NAC treatment, the tissue and serum miRNA levels did not corre-late at any time point.
Changes in serum miRNA levels during NAC treatment
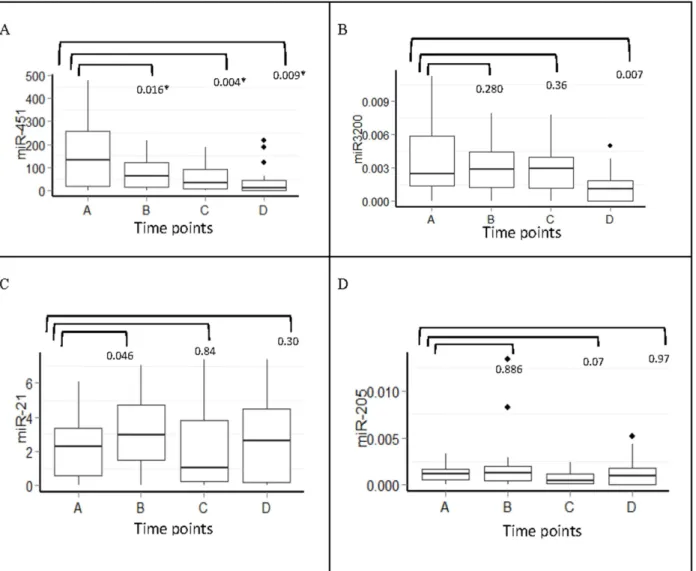
The serum levels of miR-451, miR-3200, miR-21, and miR-205 were studied at four time points and had varied expression patterns among patients; for instance, miR-451 relative expression ranged from 0.00 to 478.14 with median of 46.93.
MiR-451 showed significant changes with treatment (P= 0.032, Friedman test); further-more, certain time points were significantly different as assessed by pair-wise comparison. Interestingly, we found a gradual decline in serum levels of miR-451 during doxorubicin/cyclo-phosphamide (points B and C) and taxane treatment (point D). A significant decline in serum levels of miR-3200 was only observed following taxane treatment (point D) (P= 0.007). By contrast, there was an increase in miR-21 serum levels at point B (P= 0.046) and a non-signifi-cant increase at point D (P= 0.300). MiR-205 showed no significant variation, likely because of its very low concentration in serum (Fig 5).
Correlation between serum miRNAs and clinico-pathological features
The correlation between serum miRNA levels and clinico-pathological features at various time points is shown inTable 3. The pre-chemotherapy miR-3200 serum levels were inversely Fig 4. Differential expression of miRNAs in relation to clinico-pathological features using SAM analysis.(A) Tissue miRNAs significantly associatedwith Estrogen receptor (ER+) expression (p0.05). (B) Tissue miRNAs significantly associated with relapse (p0.05). (C) Tissue miRNAs significantly associated with pathological stage (p0.05). (D) Tissue miRNAs significantly associated with Basal-like (triple negative) (p0.05).
correlated with lymph node clinical stage (r = -0.44,P= 0.02). Similarly at baseline, miR-21 expression correlated inversely with ER status (r = -.49,P= 0.01). After the first dose of doxo-rubicin/cyclophosphamide treatment, Her2/neustatus correlated with miR-3200 and miR-205 expression (r = 0.48, P = 0.01; r = 0.46,P= 0.02, respectively). At point C (the end of doxorubi-cin/cyclophosphamide treatment), ER status correlated inversely with miR-451, miR-3200, miR-21, and miR-205 expression (r = -0.52, -0.49, -0.59, -0.45;P= 0.01, 0.009, 0.003, 0.03, respectively).
Moreover miR-3200 expression correlated positively with tumor grade (differentiation) (r = 0.4,P= 0.04), but inversely with tumor clinical stage (r = -0.4,P= 0.03). At point D (the end of docetaxel treatment), miR-3200 expression correlated inversely with pathological stage and miR-451 expression inversely correlated with clinical lymph node involvement and skin involvement.
In patients with skin involvement, miR-451 expression decreased substantially with ment, approximately 20 fold from the initial level at time of diagnosis until the end of treat-ment (P= 0.003;Fig 6). Spearman correlation analysis consistently showed that patients with Fig 5. Serum miRNAs fold change expression at different time points during chemotherapy treatment (n = 27).A) 451, B) 3200, C) miR-21and D) miR-205,*Significant p values ofp<0.05 Mann-Whitney U test. Y-axis represents the median expression of 2-ΔCTvalue of each miRNA.
Table 3. Bivariate Spearman’s rank correlation coefficient of miRNA expression and clinico-pathological characteristics (n = 27).
Time points miRNA G CS T N M ypT ypN CS PS SI ER PR Her2/neu
A miR-451 -.021 .119 .133 -.076 .057 -.226 -.129 -.126 .038 .195 -.085 .178 .306
miR-3200 .305 -.038 .074 -.441* -.254 -.356 -.260 -.176 -.180 -.297 -.298 -.063 -.217 miR-21 .262 .034 -.114 -.079 -.147 -.196 -.351 -.219 -.050 -.048 -.492** -.260 -.011 miR-205 .012 -.083 -.343 -.365 .291 -.228 .141 -.089 -.321 -.145 -.081 -.042 .265
B miR-451 .190 .343 .172 -.045 .257 .102 -.244 .245 .190 .235 -.250 -.111 .325
miR-3200 .247 .165 -.245 .141 .107 -.351 -.175 -.171 -.367 .115 -.217 -.229 .478*
miR-21 .067 .239 -.037 .046 .134 -.139 -.367 .258 .150 .258 -.297 -.135 .293
miR-205 -.062 .179 -.083 .274 -.056 -.288 -.261 .070 -.113 .296 -.013 -.058 .457* C miR-451 .354 .107 .097 -.377 .048 -.297 -.177 -.240 -.094 -.157 -.517** -.445* -.258
miR-3200 .411* .025 -.420* -.052 -.102 -.235 -.009 -.289 -.348 -.067 -.485* -.284 -.039 miR-21 .260 .093 .011 -.172 .097 -.156 -.317 -.054 .099 -.157 -.585** -.298 -.192 miR-205 .053 -.038 .031 .022 -.195 -.115 -.377 .154 .100 -.151 -.450* -.112 -.036
D miR-451 .150 -.119 .164 -.629** .067 .046 -.096 .088 -.091 -.480* .166 .467* -.104 miR-3200 -.280 -.287 -.088 -.377 -.086 -.263 -.047 -.232 -.681** -.431 .455 .455 -.191 miR-21 .105 -.039 .075 -.332 .121 -.130 -.101 -.054 -.122 -.386 .078 .345 .086 miR-205 .151 .305 -.026 -.029 .052 -.044 -.135 -.076 -.201 -.168 -.056 .258 .223
G = tumor grade (differentiation), CS = clinical stage, T = clinical tumor stage, N = clinical lymph node stage, M = metastasis, ypT+ ypN = pathological stage after treatment of tumor and lymph node, PS = pathological stage after treatment, SI = skin involvement, ER = estrogen receptor,
PR = progesterone receptor. Spearman correlationP-values: *P<0.05 (2-tailed),
**P<0.01 (2-tailed).
doi:10.1371/journal.pone.0152032.t003
Fig 6. Correlation between miRNA expression and skin involvement.Boxplot of median miR-451 expression comparing patients with skin involvement versus patients with no skin involvement at different time points throughout chemotherapy (n = 27), Spearman correlation (r= -0.48,P= 0.028).
skin involvement exhibited a significant reduction in miR-451 expression at the end of treat-ment (point D)compared with those that had no skin involvetreat-ment (r = -0.48,P= 0.028).
The association between serum miRNA levels and clinical and
pathological responses
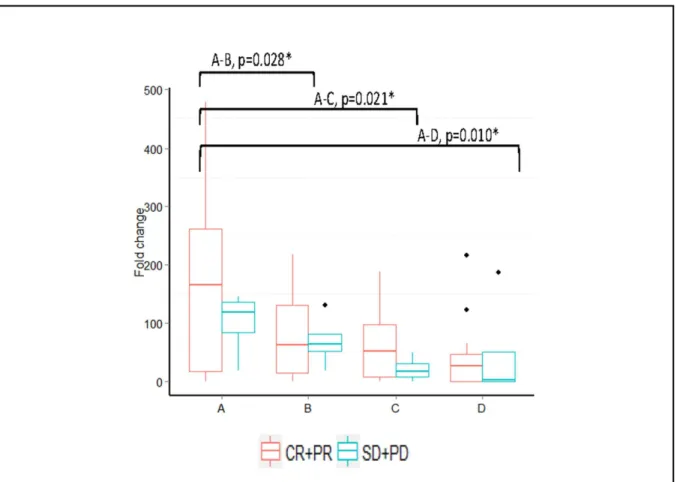
When patients were stratified as clinical responders (complete and partial responses) and non-responders (SD+PD), only miR-451 showed overall significant changes (P= 0.038) in the clini-cal responders, with changes seen at points A-B, A-C, and A-D (P= 0.028, 0.021, and 0.010, respectively). The non-responders showed no significant overall changes at any time point (P= 0.494;Fig 7).
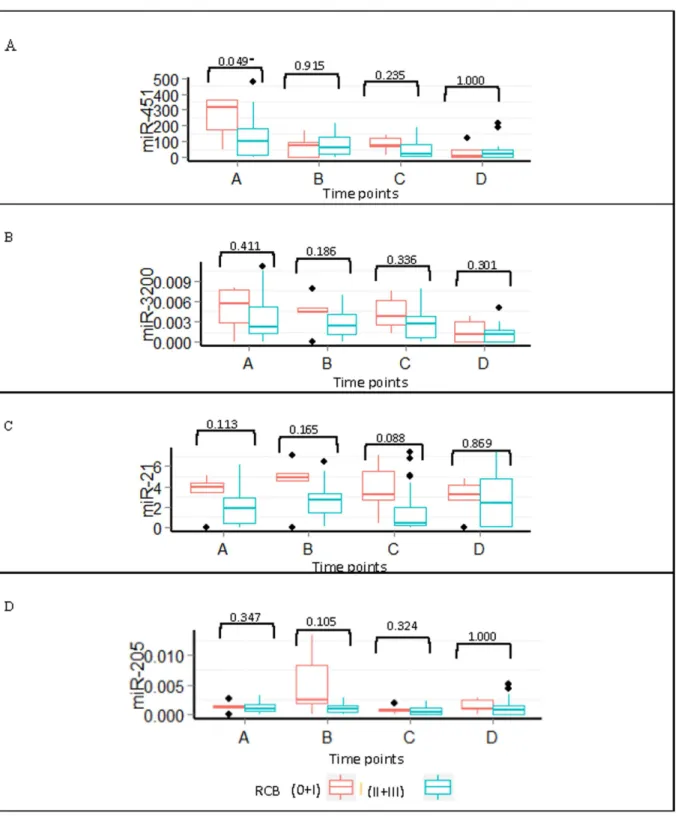
Patients also were stratified according to their RCB status into responders (n = 5) and non-responders (n = 22). We found no statistically significant differences between non-responders and non-responders in the serum levels of miR-451, miR-3200, miR-21, or miR-205 during chemo-therapy treatment. However, miR-451 at baseline levels was higher in responders versus non-responders (P= 0.049). The expression levels of all miRNAs in the responders remained ele-vated throughout the treatment (Fig 8).
Survival analysis
By the date of the survival analysis, 11 patients had relapsed and 6 patients had died. The median DFS was 39 months (13–51 months) with a median OS of 41 months (20–52 months).
Fig 7. Median fold change expression changes in miR-451 in clinical responders (data shown for the clinical responders only).*Significantpvalues
ofp<0.05 Wilcoxon sign rank test (n = 27).
Fig 8. Expression of miRNA throughout treatment for pathological responders and non-responders.Boxplots of the (A) miR-451, (B) miR-3200, (C) miR-21, and (D) miR-205 expression during treatment for patients with a pathological response (0+I) versus no response (II+III).*P<0.05 using the
Mann-Whitney U test.
Levels of miR-451 were significantly different with treatment between the patients that did not relapse (n = 10;P= 0.033). However such alterations miR-451 levels were not observed in those who relapsed (n = 11;P= 0.392). The levels ofmiR-3200 showed a similar pattern tomiR-451 alterations in patients who continued to be disease versus those who relapsed (P= 0.022 andP= 0.532, respectively)(Fig 9). The levels of miR-21 and miR-205 showed no significant changes throughout the treatment.
The serum levels of miR-3200, miR-21, and miR-205 at any point during chemotherapy treatment were not predictive for DFS; however, high levels of miR-451 at the time of diagnosis were associated with better DFS than were low levels (43 months [14–51 months] versus 31 months [13–46 months], respectively;Fig 10). None of the miRNAs was predictive for OS.
Discussion
The current study investigated the effect of NAC treatment (doxorubicin/cyclophosphamide x4 followed by docetaxel×4 ±trastuzumab) on miRNA expression in subsets of patients with locally advanced breast cancer. We used a unique, dynamic method in which multiple tissues and serum samples were collected at four time points; the changes in miRNA levels over time were correlated with clinico-pathological features, clinical and pathological response, and survival.
In this study, we demonstrated differential over- and under-expression of more than 100 miRNAs between tumor and tumor-adjacent healthy tissues with fold change that varied from -6.90 to +31.99 (Figs2and3). Several previous studies have demonstrated differential expres-sion of miRNAs between various types of cancer and the adjacent healthy tissue [27,28].
Tissue miRNA levels were associated with various clinico-pathological features (Fig 4). Tis-sue miR-378, miR-3200, miR-422a, miR-181, miR-1274a, miR-378c, and miR-18a were signifi-cantly associated with ER expression (P0.05). Specifically, we observed a 6-fold increase in the differential expression of 378 and 181. Previous studies have shown that miR-378 promotes cell survival by decreasing caspase-3 activity and stimulates tumor progression and ER positivity, which are consistent with our findings [29]. Previous studies have also found a tumor-suppressive role of miR-422a and its up-regulation in ER-positive inflammatory breast cancer, which is also consistent with our findings (Fig 4)[30,31]. Tissue miR-21 was previously shown to be significantly associated with tumor local and distant recurrence and exhibits an oncogenic function in which its suppression results in enhanced sensitivity to anticancer agents[32]. Similarly, It was shown that Serum miR-21 may be an independent poor prognostic factor for recurrence [32], and high stromal miR-21 expression is associated with significantly shorter recurrence-free survival in patients with colorectal cancer [33]. We found that tissue miR-451 was up-regulated more than 5× and significantly associated with pathological stage (Fig 3). Previous studies have demonstrated that miR-451 regulates the expression of multidrug resistance 1 gene, and transfection of MCF-7/DOX-resistant cells with miR-451 results in increased sensitivity to chemotherapy [34].
Fig 9. Fold change in miR-451 and miR-3200 expression during treatment in relation to relapse status.Boxplots of (A) miR-451 and (B) miR-3200
expression over time comparing relapsed patients versus non-relapsed.*P<0.05 using the Wilcoxon sign-rank test for the non-relapsing patients.
We performed RT-qPCR on four miRNAs (miR-451, miR-3200, miR-21, and miR-205) in the serum of 27 patients as these miRNA were selected based on their correlation to patients’
clinico-pathological features. The miRNAs were chosen because they had the highest differen-tial expression and/or correlated with some of the clinico-pathological features, as discussed above.
We first studied whether serum miRNA expression varied significantly during NAC. Inter-estingly, we found a gradual decline in serum levels of miR-451 during doxorubicin/cyclophos-phamide treatment (point B [P= 0.016] and point C [P= 0.004]) that continued during taxane treatment (point D [P= 0.009];Fig 5). Similar studies reported a correlation between miR-451 decline and chemosensitivity in response to doxorubicin treatment in MCF-7 cells [38]. By contrast, we saw a significant decline in serum levels of miR-3200 only after taxane treatment (point D [P= 0.007]). We found no significant variation in miR-21 serum levels, except a minor statistically non-significant increases in expression at point B (P= 0.05) and point D (P= 0.3). We also noted no significant variation in miR-205, most likely owing to its very low serum concentration. Taken together, these data suggest that miRNA expression varies during neo-adjuvant treatment, which could be taken into consideration for the utilization of miRNAs as a biomarker [39–41].
Fig 10. Disease-free survival and miR-451 expression.Kaplan-Meier estimates of disease-free survival based on low versus high expression of miR-451
at the time of diagnosis. Log-rankP= 0.046.
Expression of miRNA was correlated with certain clinico-pathological features of enrolled patients. At the end of the treatment, miR-451 correlated inversely with clinical lymph node stage (P= 0.002) and skin involvement (P= 0.028). Patients with skin involvement had high levels of miR-451at point A that were subsequently down-regulated, whereas patients without skin involvement had almost steady levels (Fig 6). Previous studies have shown that the down-regulation of miR-451 expression in non-small cells lung carcinoma (NSCLC) correlates with advanced stage of disease, including differentiation and lymph node stage [34]. We found that miR-3200 correlated inversely with clinical lymph node stage (N) and clinical tumor stage (T) by the end of the doxorubicin/cyclophosphamide treatment (point C). However, we found no previous studies on its role in carcinogenesis. Expression of miR-21 correlated inversely with ER status after the administration of doxorubicin/cyclophosphamide (point C), which was lost by end of taxane treatment. Studies show that activation of ER in MCF-7 cells by estradiol represses the oncogenic effect of miR-21 [42]. These findings suggest that correlation with a fixed time point during neo-adjuvant chemotherapy treatment may provide inaccurate snap-shot that does not take into account the dynamic alteration of various miRNAs.
We also correlated the clinical and pathological responses with miRNA expression. We found a gradual decline in miR-451 expression in the clinically responding patients versus non-responding patients. Interestingly, higher pre-treatment serum levels of miR-451 were associated with better clinical responses, as shown inFig 6. This observation is consistent with a previous study in osteosarcoma that reported a correlation between high expression of serum miR-451 and positive responses to NAC, suggesting that miR-451 can be used as a pivotal marker to predict response to chemotherapy [43]. The other miRNA did not exhibit any signif-icant differences between the clinically responding patients versus non-responding patients.
The pattern of miR-451 expression was retained in the pathological responding patients ver-sus non-responding patients with gradual declined near the end of the treatment. The other miRNA remained unchanged when categorized by pathological response (Fig 8). Despite the use of standard chemotherapy treatment, the number of patients achieving complete patholog-ical tumor response was low (7.4%) when compared with previous studies. This may reflect the very advanced nature of breast cancer lesions included in the study, with an average size of 8cm (SD = ±5cm), stage III and IV disease constituting 66.7% of cases, and skin involvement in approximately 44% of patients. Another characteristic that may have affected pathological response is the predominance of ER/PR-positive tumors and low number of patients with the triple-negative phenotype.
The findings presented inFig 9show that patients with higher miR-451 levels at baseline have lower relapse rates and better survival. This is supported by multiple studies that suggest miR-451 is tumor suppressive. Studies also have shown that low expression of miR-451 is an independent factor associated with worse OS for patients with NSCLC [34]. Expression of miR-451 is associated with clinical outcome in several cancers, including gastric and lung can-cer. Specifically, patients with gastric cancer who had low miR-451 expression had a shorter DFS and OS than patients with high miR-451 expression, which is consistent with our study (Fig 10) [34]. However, it is important to highlight the relatively higher concentration of serum of miRNA-451 compared to tissue concentration which obviously raises the issue of exogenous sources of miRNAs.
are required to determine the mechanism of action for miR-3200, our results suggest that higher pre-treatment serum levels are associated with a better response and lower risk of relapse.
The oncogenic role of miR-21 and its anti-tumor-suppressive activities have been studied extensively in breast cancer; the miRNA levels positively correlate with increased resistance to chemotherapeutic drugs, such as doxorubicin and docetaxel [44]. In contrast to previous results, we found no significant alteration of serum miR-21 during chemotherapy treatment and no significant association with clinical outcome. However, other factors were correlated with miR-21 expression. In fact, miR-21 serum levels were significantly increased by the end of doxorubicin/cyclophosphamide treatment (point C) (P= 0.018). Previous studies have shown that only in TNBC is there a correlation between high miR-21 level and poor prognosis [45, 46]. The difference in findings might be due to the small number of triple-negative and Her2/ neu-positive patients enrolled in our study.
Conclusions
To our knowledge, this is the first report of miRNA profiling on a cohort of females with LABC undergoing NAC treatment. This study investigated multiple tissue and serum samples over time to describe the mechanistic changes occurring during treatment and to examine the use of miRNA expression as a biomarker. The use of miRNA as a biomarker is particularly intriguing, because it could replace the invasive method of tissue sampling with the relatively noninvasive method of blood sampling. Our model differs from previous studies; we used mul-tiple samples taken at four time points, rather than pair-wise sampling. Expression of miR-3200 correlated with clinico-pathological feature, and elevated levels of serum miR-miR-3200 were associated with better pathological response and a lower risk of relapse. However, the selection of this miRNA was predicted using a computational model and not previous literature; there-fore, its function and mechanism of action remain largely unexplored. Our data propose for the first time the potential role of miR-3200 as a tumor-suppressive marker, though functional studies are still required to decipher its role in cancer.
Supporting Information
S1 Table. MicroRNA expression profiling of normal tissue versus tumor. (PDF)
Acknowledgments
We would like to acknowledge Dr. Amal Gadalla for her guidance in some of the statistical analyses and Dr. Andreas Montelius and Mr. Jonathan Mustonen for their assistance in depositing microarray data. We also would like to thank the core facility at Novum, BEA, Bio-informatics and Expression Analysis, which is supported by the board of research at the Karo-linska Institute and the research committee at the KaroKaro-linska hospital. We also thank our colleagues in Medical Oncology Unit at Sultan Qaboos University Hospital for their support. This work was funded and supported by the Research Council, Sultanate of Oman (RC/MED/ MEDI/11/01).
Author Contributions
References
1. Hutchinson L: Breast cancer: Challenges, controversies, breakthroughs. Nature Reviews Clinical Oncology 2010, 7:669–670. doi:10.1038/nrclinonc.2010.192PMID:21116236
2. R Ashish B A, Dinshaw Ketayun, Jalali Rakesh: Management of locally advanced breast cancer: Evolu-tion and current practice. Journal of Cancer Research and Therapeutics 2005, 1(1):21–30. PMID: 17998621
3. Lee MC, Newman LA: Management of Patients with Locally Advanced Breast Cancer. Surgical Clinics of North America 2007, 87(2):379–398. PMID:17498533
4. Cance WG, Carey LA, Calvo BF, Sartor C, Sawyer L, Moore DT, Rosenman J, Ollila DW, Graham M: Long-Term Outcome of Neoadjuvant Therapy for Locally Advanced Breast Carcinoma: Effective Clini-cal Downstaging Allows Breast Preservation and Predicts Outstanding LoClini-cal Control and Survival. ANNALS OF SURGERY 2002, 236(3):295–303. PMID:12192316
5. de Planell-Saguer Marià n, Rodicio MC: Detection methods for microRNAs in clinic practice. Clinical biochemistry 2013, 46(10–11):869–878. doi:10.1016/j.clinbiochem.2013.02.017PMID:23499588
6. Molnár V, Tamási V, Bakos B, Wiener Z, Falus A: Changes in miRNA expression in solid tumors: An miRNA profiling in melanomas. Seminars in Cancer Biology 2008, 18(2):111–122. doi:10.1016/j. semcancer.2008.01.001PMID:18296065
7. Fabbri M, Croce C, Calin G: MicroRNAs. The Cancer Journal 2008, 14(1):1–6. doi:10.1097/PPO. 0b013e318164145ePMID:18303474
8. Calin GA, Sevignani C, Dumitru CD, Hyslop T, Noch E, Yendamuri S, Shimizu M, Rattan S, Bullrich F,
Negrini M et al: Human microRNA genes are frequently located at fragile sites and genomic regions involved in cancers. Proceedings of the National Academy of Sciences of the United States of America 2004, 101(9):2999–3004. PMID:14973191
9. Calin GA, Dumitru CD, Shimizu M, Bichi R, Zupo S, Noch E, Aldler H, Rattan S, Keating M, Rai K et al: Frequent deletions and down-regulation of micro- RNA genes miR15 and miR16 at 13q14 in chronic lymphocytic leukemia. Proceedings of the National Academy of Sciences 2002, 99(24):15524–15529.
10. Iorio MV, Ferracin M, Liu C-G, Veronese A, Spizzo R, Sabbioni S, Magri E, Pedriali M, Fabbri M, Campi-glio M et al: MicroRNA Gene Expression Deregulation in Human Breast Cancer. Cancer Research 2005, 65(16):7065–7070. PMID:16103053
11. Wang B, Li JD, Sun M, Sun LH, Zhang XY: MiRNA Expression in Breast Cancer Varies with Lymph Node Metastasis and Other Clinicopathologic Features. IUBMB LIFE 2014, 66(5):371–377. doi:10. 1002/iub.1273PMID:24846313
12. Mattie M, Benz C, Bowers J, Sensinger K, Wong L, Scott G, Fedele V, Ginzinger D, Getts R, Haqq C: Optimized high-throughput microRNA expression profiling provides novel biomarker assessment of clinical prostate and breast cancer biopsies. Mol Cancer 2006, 5:24. PMID:16784538
13. van Schooneveld E, Wildiers H, Vergote I, Vermeulen P, Dirix L, Van Laere S: Dysregulation of micro-RNAs in breast cancer and their potential role as prognostic and predictive biomarkers in patient man-agement. Breast Cancer Research 2015, 17(1):21.
14. Heneghan HM, Miller N, Lowery AJ, Sweeney KJ, Newell J, Kerin MJ: Circulating microRNAs as Novel Minimally Invasive Biomarkers for Breast Cancer. ANNALS OF SURGERY 2010, 251(3):499–505. doi:10.1097/SLA.0b013e3181cc939fPMID:20134314
15. Asaga S, Kuo C, Nguyen T, Terpenning M, Giuliano AE, Hoon DSB: Direct Serum Assay for Micro-RNA-21 Concentrations in Early and Advanced Breast Cancer. Clinical Chemistry 2011, 57(1):84–91. doi:10.1373/clinchem.2010.151845PMID:21036945
16. Yan LX, Huang XF, Shao Q, Huang MY, Deng L, Wu QL, Zeng YX, Shao JY: MicroRNA miR-21 overex-pression in human breast cancer is associated with advanced clinical stage, lymph node metastasis and patient poor prognosis. RNA-A PUBLICATION OF THE RNA SOCIETY 2008, 14(11):2348–2360.
17. Zhu W, Qin W, Atasoy U, Sauter E: Circulating microRNAs in breast cancer and healthy subjects. BMC Research Notes 2009, 2(1):89.
18. Wang F, Zheng Z, Guo J, Ding X: Correlation and quantitation of microRNA aberrant expression in
tis-sues and sera from patients with breast tumor. Gynecologic Oncology 2010, 119(3):586–593. doi:10. 1016/j.ygyno.2010.07.021PMID:20801493
19. Kleivi Sahlberg K, Bottai G, Naume B, Burwinkel B, Calin GA, Børresen-Dale A-L, Santarpia L: A
Serum MicroRNA Signature Predicts Tumor Relapse and Survival in Triple-Negative Breast Cancer Patients. Clinical Cancer Research 2015, 21(5):1207–1214. doi:10.1158/1078-0432.CCR-14-2011 PMID:25547678
21. Khokher Samina Q MU, C NA: Comparison of WHO and RECIST Criteria for Evaluation of Clinical Response to Chemotherapy in Patients with Advanced Breast Cancer. Asian Pacific Journal of Cancer Prevention 2012, 13(7):3213–3218. PMID:22994736
22. Nahleh Z, Sivasubramaniam D, Dhaliwal S, Sundarajan V, Komrokji R: Residual cancer burden in locally advanced breast cancer: a superior tool. Current Oncology 2008, 15(6):271–278. PMID: 19079627
23. Burgos KL, Javaherian A, Bomprezzi R, Ghaffari L, Rhodes S, Courtright A, Tembe W, Kim S, Metpally R, Van Keuren-Jensen K: Identification of extracellular miRNA in human cerebrospinal fluid by next-generation sequencing. RNA 2013, 19(5):712–722. doi:10.1261/rna.036863.112PMID:23525801
24. Xiong Y, Chen S, Liu L, Zhao Y, Lin W, Ni J: Increased Serum MicroRNA-155 Level Associated with Nonresponsiveness to Hepatitis B Vaccine. Clinical and Vaccine Immunology: CVI 2013, 20(7):1089– 1091. doi:10.1128/CVI.00044-13PMID:23637039
25. Hu Z, Dong J, Wang L-E, Ma H, Liu J, Zhao Y, Tang J, Chen X, Dai J, Wei Q et al: Serum microRNA profiling and breast cancer risk: the use of miR-484/191 as endogenous controls. Carcinogenesis 2012, 33(4):828–834. doi:10.1093/carcin/bgs030PMID:22298638
26. Peltier HJ, Latham GJ: Normalization of microRNA expression levels in quantitative RT-PCR assays: Identification of suitable reference RNA targets in normal and cancerous human solid tissues. RNA 2008, 14(5):844–852. doi:10.1261/rna.939908PMID:18375788
27. Hamfjord J, Stangeland AM, Hughes T, Skrede ML, Tveit KM, Ikdahl T, Kure EH: Differential Expres-sion of miRNAs in Colorectal Cancer: Comparison of Paired Tumor Tissue and Adjacent Normal Mucosa Using High-Throughput Sequencing. PLoS ONE 2012, 7(4):e34150. doi:10.1371/journal. pone.0034150PMID:22529906
28. Della Vittoria Scarpati G, Calura E, Di Marino M, Romualdi C, Beltrame L, Malapelle U, Troncone G, De Stefano A, Pepe S, De Placido S et al: Analysis of Differential miRNA Expression in Primary Tumor and Stroma of Colorectal Cancer Patients. BioMed Research International 2014, 2014:8.
29. Lee DY, Deng Z, Wang C-H, Yang BB: MicroRNA-378 promotes cell survival, tumor growth, and angio-genesis by targeting SuFu and Fus-1 expression. Proceedings of the National Academy of Sciences of the United States of America 2007, 104(51):20350–20355. PMID:18077375
30. Van der Auwera I, Limame R, van Dam P, Vermeulen PB, Dirix LY, Van Laere SJ: Integrated miRNA and mRNA expression profiling of the inflammatory breast cancer subtype. Br J Cancer 2010, 103 (4):532–541. doi:10.1038/sj.bjc.6605787PMID:20664596
31. Vageli D, Doukas SG, Kerenidi T, Koukoulis GK, Gourgoulianis KI, Daniil Z: Correlation of miR-422a, miR-21 and miR-155 analysis with hMSH2 and hMLH1 mRNA expression profiles in non-small cell lung carcinomas and their adjacent normal tissues. European Respiratory Journal 2013, 42(Suppl 57).
32. Wang G, Wang L, Sun S, Wu J, Wang Q: Quantitative Measurement of Serum MicroRNA-21 Expres-sion in Relation to Breast Cancer Metastasis in Chinese Females. Annals of Laboratory Medicine 2015, 35(2):226–232. doi:10.3343/alm.2015.35.2.226PMID:25729725
33. Kang WK, Lee JK, Oh ST, Lee SH, Jung CK: Stromal expression of miR-21 in T3-4a colorectal cancer is an independent predictor of early tumor relapse. BMC Gastroenterology 2015, 15:2. doi:10.1186/ s12876-015-0227-0PMID:25609245
34. Pan X, Wang R, Wang Z-X: The Potential Role of miR-451 in Cancer Diagnosis, Prognosis, and Ther-apy. Molecular Cancer Therapeutics 2013, 12(7):1153–1162. doi:10.1158/1535-7163.MCT-12-0802 PMID:23814177
35. Majid S, Dar AA, Saini S, Chen Y, Shahryari V, Liu J, Zaman MS, Hirata H, Yamamura S, Ueno K et al: Regulation of Minichromosome Maintenance Gene Family by MicroRNA-1296 and Genistein in Pros-tate Cancer. Cancer Research 2010, 70(7):2809–2818. doi:10.1158/0008-5472.CAN-09-4176PMID: 20332239
36. Yang X-W, Shen G-Z, Cao L-Q, Jiang X-F, Peng H-P, Shen G, Chen D, Xue P: MicroRNA-1269
pro-motes proliferation in human hepatocellular carcinoma via downregulation of FOXO1. BMC Cancer 2014, 14(1):909.
37. Bisso A, Faleschini M, Zampa F, Capaci V, De Santa J, Santarpia L, Piazza S, Cappelletti V, Daidone
M, Agami R et al: Oncogenic miR-181a/b affect the DNA damage response in aggressive breast can-cer. Cell Cycle 2013, 12(11):1679–1687. doi:10.4161/cc.24757PMID:23656790
38. Kovalchuk O, Filkowski J, Meservy J, Ilnytskyy Y, Tryndyak VP, Chekhun VF, Pogribny IP: Involvement
of microRNA-451 in resistance of the MCF-7 breast cancer cells to chemotherapeutic drug doxorubicin. Molecular Cancer Therapeutics 2008, 7(7):2152–2159. doi:10.1158/1535-7163.MCT-08-0021PMID: 18645025
40. Kjersem JB, Ikdahl T, Lingjaerde OC, Guren T, Tveit KM, Kure EH: Plasma microRNAs predicting clini-cal outcome in metastatic colorectal cancer patients receiving first-line oxaliplatin-based treatment. Molecular Oncology 2013, 8(1):59–67. doi:10.1016/j.molonc.2013.09.001PMID:24119443
41. Ng EKO, Li R, Shin VY, Jin HC, Leung CPH, Ma ESK, Pang R, Chua D, Chu K-M, Law WL et al: Circu-lating microRNAs as Specific Biomarkers for Breast Cancer Detection. PLoS ONE 2013, 8(1):e53141. doi:10.1371/journal.pone.0053141PMID:23301032
42. Wickramasinghe NS, Manavalan TT, Dougherty SM, Riggs KA, Li Y, Klinge CM: Estradiol downregu-lates miR-21 expression and increases miR-21 target gene expression in MCF-7 breast cancer cells. Nucleic Acids Research 2009, 37(8):2584–2595. doi:10.1093/nar/gkp117PMID:19264808
43. Xu H, Mei Q, Shi L, Lu J, Zhao J, Fu Q: Tumor-suppressing effects of miR451 in human osteosarcoma. Cell biochemistry and biophysics 2014, 69(1):163–168. doi:10.1007/s12013-013-9783-5PMID: 24218283
44. To K: MicroRNA: a prognostic biomarker and a possible druggable target for circumventing multidrug resistance in cancer chemotherapy. Journal of Biomedical Science 2013, 20(1):99.
45. Kalniete D, Nakazawa-Miklasevica M, Strumfa I, Abolins A, Irmejs A, Trofimovics G, Gardovskis J, Mik-lasevics E: MicroRNA Expression in Different Sybtypes of Breast Cancer. Acta Chirurgica Latviensis 2013, 13(1):7–12.