BGD
8, 7859–7919, 2011Bio-optical anomaly and diurnal variability
of the particulate matter
H. Loisel et al.
Title Page
Abstract Introduction
Conclusions References
Tables Figures
◭ ◮
◭ ◮
Back Close
Full Screen / Esc
Printer-friendly Version
Interactive Discussion
Discussion
P
a
per
|
Dis
cussion
P
a
per
|
Discussion
P
a
per
|
Discussio
n
P
a
per
|
Biogeosciences Discuss., 8, 7859–7919, 2011 www.biogeosciences-discuss.net/8/7859/2011/ doi:10.5194/bgd-8-7859-2011
© Author(s) 2011. CC Attribution 3.0 License.
Biogeosciences Discussions
This discussion paper is/has been under review for the journal Biogeosciences (BG). Please refer to the corresponding final paper in BG if available.
Characterization of the bio-optical
anomaly and diurnal variability of the
particulate matter, as seen from the
scattering and backscattering
coe
ffi
cients, in ultra-oligotrophic eddies
of the Mediterranean Sea
H. Loisel1, V. Vantrepotte1, K. Norkvist1, X. M ´eriaux1, M. Kheireddine2, J. Ras2, M. Pujo-Pay3,4, Y. Combet5, K. Leblanc5, R. Mauriac5, D. Dessailly1, and
T. Moutin5
1
INSU-CNRS, UMR8187, LOG, Laboratoire d’Oc ´eanologie et des G ´eosciences, Universit ´e Lille Nord de France, ULCO, 32 avenue Foch, 62930 Wimereux, France
2
INSU-CNRS, LOV, Laboratoire d’Oc ´eanographie de Villefranche, UMR7093, Universit ´e Paris VI, Villefranche sur mer, France
3
BGD
8, 7859–7919, 2011Bio-optical anomaly and diurnal variability
of the particulate matter
H. Loisel et al.
Title Page
Abstract Introduction
Conclusions References
Tables Figures
◭ ◮
◭ ◮
Back Close
Full Screen / Esc
Printer-friendly Version
Interactive Discussion
Discussion
P
a
per
|
Dis
cussion
P
a
per
|
Discussion
P
a
per
|
Discussio
n
P
a
per
|
4
UPMC Univ Paris 06, UMR7621, LOMIC, Laboratoire d’Oc ´eanographie Microbienne, Obser-vatoire Oc ´eanologique, 66650 Banyuls/mer, France
5
INSU-CNRS, UMR6535, LOPB, Laboratoire d’Oc ´eanographie Physique et Biog ´eochimique, Universit ´e de la M ´editerran ´ee, Centre d’Oc ´eanologie de Marseille, Campus de Luminy Case 901, 13288 Marseille cedex 9, France
Received: 31 July 2011 – Accepted: 1 August 2011 – Published: 8 August 2011
Correspondence to: H. Loisel ([email protected])
BGD
8, 7859–7919, 2011Bio-optical anomaly and diurnal variability
of the particulate matter
H. Loisel et al.
Title Page
Abstract Introduction
Conclusions References
Tables Figures
◭ ◮
◭ ◮
Back Close
Full Screen / Esc
Printer-friendly Version
Interactive Discussion
Discussion
P
a
per
|
Dis
cussion
P
a
per
|
Discussion
P
a
per
|
Discussio
n
P
a
per
|
Abstract
The variability of the inherent optical properties is investigated in the ultra-oligotrophic waters of the Mediterranean Sea sampled during the BOUM experiment performed during the early summer 2008. Bio-optical relationships found for the ultra-oligotrophic waters of the three anticyclonic gyres sampled significantly depart from the mean
stan-5
dard relationships provided for the global ocean, confirming the particular character of these Mediterranean waters. These optical anomalies are diversely related to the specific biological and environmental conditions occurring in the studied ecosystem. Specifically, the surface specific phytoplankton absorption coefficient exhibits values lower than those expected from the general relationships mainly in relation with a
10
high contribution of relatively large sized phytoplankton. Conversely, the particulate backscattering coefficient,bbp, values are much higher than the mean standard values
for a given chlorophyll-aconcentration, TChl-a. This feature can presumably be related to the relevant influence of highly refractive submicrometer particles of Saharan origin in the surface layer of the water column. The present measurements also show that
15
the Mediterranean Sea is greener than TChl-a alone indicates, as already stressed in previous studies. This color anomaly is partly explained by the estimated colored dissolved organic matter and submicrometer particles absorption coefficients, and to a greater extent by the highbbp/TChl-avalues assuming that these particles backscatter
light similarly in the green and blue parts of the visible spectrum. The diel variation of
20
both the particulate matter attenuation and backscattering coefficients were also inves-tigated specifically. Despite some differences in the timing and the magnitude of the daily oscillations found for these optical parameters, potential for the backscattering coefficient daily oscillation to be used, similarly to that for the attenuation coefficient, as a proxy for estimating carbon community production budget has been highlighted
25
BGD
8, 7859–7919, 2011Bio-optical anomaly and diurnal variability
of the particulate matter
H. Loisel et al.
Title Page
Abstract Introduction
Conclusions References
Tables Figures
◭ ◮
◭ ◮
Back Close
Full Screen / Esc
Printer-friendly Version
Interactive Discussion
Discussion
P
a
per
|
Dis
cussion
P
a
per
|
Discussion
P
a
per
|
Discussio
n
P
a
per
|
1 Introduction
In situ and remote sensing measurements of inherent optical properties (IOPs) in nat-ural waters provide essential information to infer biogeochemical stocks and processes at different temporal and spatial scales (Smith and Baker, 1978; Nelson et al., 1998; Stramski et al., 1999; Oubelkheir et al., 2005; Boss et al., 2007; Vantrepotte et al.,
5
2011). General bio-optical relationships have long been established between these IOPs and some biogeochemical parameters, BP, such as the chlorophyll-a concen-tration, Chl-a, and particulate organic carbon, POC, in open ocean waters (Gordon and Morel, 1983; Yentsch and Phinney, 1989; Bricaud et al., 1995; Oubelkheir et al., 2005; Gardner et al., 2006; Uhot et al., 2008). These relationships can then be used
10
to assess the variability of the latter biogeochemical parameters from field or remote sensing measurements. The universal (i.e. global) status of these relationships can only be stated by characterizing and understanding the variability around these av-eraged laws which describe the mean trends observed between the IOPs and the biogeochemical parameters concentration. At first order, the IOPs variability is driven
15
by the concentration of the optically significant material present in the water masses. For instance, robust statistical relationships (Loisel and Morel, 1998; Bricaud et al., 1998) have been established between the particulate attenuation,cp, and absorption,
ap, coefficients with Chl-a over the whole trophic range (covering about three orders
of magnitude). The bio-optical characteristics of the particulate and dissolved
mat-20
ter, as well as the respective proportion between these different optically active pools, drive the natural variability observed around the averages IOPs vs. BP relationships. Here we examine the IOPs variability for ultra-oligotrophic waters of the Mediterranean Sea sampled in the frame of the BOUM (Biogeochemistry from the Oligotrophic to the Ultra-oligotrophic Mediterranean) cruise carried out in early summer, June–July 2008
25
(Moutin et al., 2011).
BGD
8, 7859–7919, 2011Bio-optical anomaly and diurnal variability
of the particulate matter
H. Loisel et al.
Title Page
Abstract Introduction
Conclusions References
Tables Figures
◭ ◮
◭ ◮
Back Close
Full Screen / Esc
Printer-friendly Version
Interactive Discussion
Discussion
P
a
per
|
Dis
cussion
P
a
per
|
Discussion
P
a
per
|
Discussio
n
P
a
per
|
in situ measurements performed in ultra oligotrophic waters (i.e. Chl-alower than about 0.05 mg m−3) are still very scarce. This is particularly true for the particulate backscat-tering coefficient,bbp, which has been rarely measured in oligotrophic waters. Recent
bio-optical relationships (Huot et al., 2008; Bricaud et al., 2010) were however recently established, thanks to the large trophic gradient covered in the frame of the BIOSOPE
5
cruise which was carried out in the eastern South Pacific Ocean (Claustre et al., 2008). Compared to the South Pacific gyre system, where ultra ologotrophic waters were sam-pled during BIOSOPE, the Mediterranean Sea waters and their associated bio-optical relationships can be affected by continental inputs such as rivers discharges and desert dust events. Different studies have already stressed the marginal character of this semi
10
enclosed sea at a bio-optical point of view (Gitelson et al., 1996; D’Ortenzio et al., 2002; Claustre et al., 2002; Bricaud et al., 2002; Morel and Gentili, 2009). A higher than ex-pected colored dissolved organic matter content, a presence of coccolithophorids, and Saharan dust events were advanced to explain the over-estimation, compared to the field values, of Chl-a loads retrieved from the standard bio-optical algorithms used to
15
process ocean color data collected from space. The first objective of the present study is to re-examine this well known, but still not fully understood, color anomaly found in ultra-oligotrophic waters of the Mediterranean Sea, with a particular focus on the par-ticulate backscattering coefficient,bbp, which was never measured during the previous
studies.
20
Diel variation incphas been extensively reported in various parts of the world oceans
and has been used to infer biogeochemical processes such as particles growth rates and productivity (Cullen et al., 1992; Claustre et al., 2008; Marra, 1997; Gardner et al., 1999; Oubelkheir and Sciandra, 2008; Gernez et al., 2011; Dall’Olmo et al., 2011). With minima near sunrise and maxima near sun set, thecpdiel variations have been
25
BGD
8, 7859–7919, 2011Bio-optical anomaly and diurnal variability
of the particulate matter
H. Loisel et al.
Title Page
Abstract Introduction
Conclusions References
Tables Figures
◭ ◮
◭ ◮
Back Close
Full Screen / Esc
Printer-friendly Version
Interactive Discussion
Discussion
P
a
per
|
Dis
cussion
P
a
per
|
Discussion
P
a
per
|
Discussio
n
P
a
per
|
2008). Conversely, diurnal cycles in bbp have not been documented yet and
repre-sent therefore the second major objective of the prerepre-sent study. The characterization of thebbp diel cycle is motivated by two major aspects. First, in the frame of the Mie
scattering theory,bbp is mostly influenced by submicrometer particles, whereascpis
mainly driven by particles with diameters between 0.5 and 20 µm (Stramski and
Kief-5
fer, 1991; Pak et al., 1988). Therefore, the comparison of the respective diel cycles of the two latter optical parameters could provide complementary information on re-lated biogeochemical processes. Note, however, that the influence of relatively large phytoplankton cells onbbp seems to be underestimated from Mie calculations
accord-ing to recent experimental studies (Vaillancourt et al., 2004; Dall’Olmo et al., 2009).
10
Due to the current uncertainties regarding the role of sea water constituents in light backscattering processes in the ocean (Stramski et al., 2004), and to the relatively short time series acquired during BOUM (3 days), the present study only represents the first step toward the potential use ofbbp to assess community production loss and
gain terms. Second, in contrast tocp which represents the sum of the particulate
ab-15
sorption and scattering coefficients,bbp can be assessed from space with a satisfying
accuracy (IOCCG, 2006). Recently launched (GOCI, Gestationary Ocean Color Im-ager, KORDI) and planed (GEO-OCAPI, CNES; HR-GEO, ISRO) geostationary spatial ocean color instruments will provide new opportunities to infer biogeochemical pro-cesses from space with an increased temporal resolution and provide new insights on
20
biogeochemical fluxes. In that context, a better understanding ofbbp diel cycles is of
particular interest.
2 Materials and methods
2.1 Sampling strategy
The BOUM cruise took place during summer 2008 (from 16 June to 20 July) in the
25
BGD
8, 7859–7919, 2011Bio-optical anomaly and diurnal variability
of the particulate matter
H. Loisel et al.
Title Page
Abstract Introduction
Conclusions References
Tables Figures
◭ ◮
◭ ◮
Back Close
Full Screen / Esc
Printer-friendly Version
Interactive Discussion
Discussion
P
a
per
|
Dis
cussion
P
a
per
|
Discussion
P
a
per
|
Discussio
n
P
a
per
|
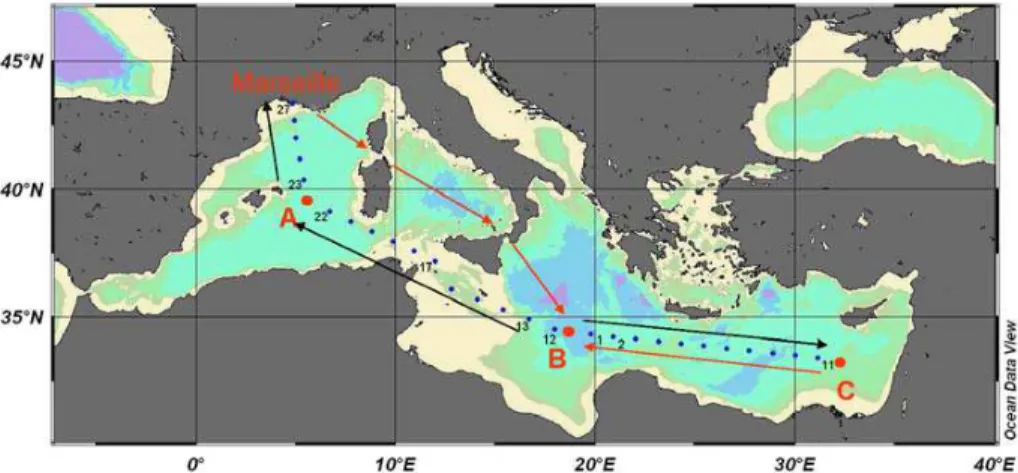
(western Mediterranean) to the Eratosthenes sea mount (eastern Mediterranean, Fig. 1). Along this transect, two kinds of stations were sampled: “short duration”(SD) and “long duration” (LD) stations (27 and 3 stations respectively, Fig. 1). Surface to bottom measurements were performed at each SD station distant of around 60 miles of each other. The 3 LD stations (A, B, C) were located in the centre of anticyclonic
5
eddies, approximately determined from satellite imagery and MERCATOR forecast and accurately located on board using hydrologic and hydrodynamic data (i.e. XBT, ther-mosalinograph and ADCP measurements). The latter fixed stations were sampled at high frequency (every 3 h) for 3 days in order to study the diurnal cycle of various bio-geochemical and optical parameters. Basic measurements consisted of CTD vertical
10
profiles (0–500 m). In addition, discrete Niskin bottles samples were taken at different depths of the water column. It is noteworthy that hydrodynamic conditions for the LD fixed stations remained stable all along the sampling time period (Moutin et al., 2011). 2.1.1 Biogeochemical parameters
Photosynthetic pigment (including total chlorophyll-a, TChl-a=chlorophyll-a+divinyl
15
chlorophyll-a+chlorophyillde-amg m−3) concentrations were measured at discrete depths collected from Niskin bottles (1 to 2.5 l) by High Performance Liquid Chromatog-raphy (HPLC) following the methodology described in Ras et al. (2008). The relative proportion of pico-, nano- and microphytoplankton was computed using the chemotax-onomic pigment ratios described in Vidussi et al. (2001) recently updated by Uitz et
20
al. (2006). Note that only one vertical profile of HPLC measurements is available at each long duration station.
Particulate organic carbon, POC, (in µg l−1) was collected on precombusted (24 h, 450 C) glass fiber filters (Whatman GF/F, 25 mm). Filters were dried in an oven at 50◦C and stored, in ashed glass vial and in a dessicator until analyses when return
25
from the cruise, on a CHN Perkin Elmer 2400.
BGD
8, 7859–7919, 2011Bio-optical anomaly and diurnal variability
of the particulate matter
H. Loisel et al.
Title Page
Abstract Introduction
Conclusions References
Tables Figures
◭ ◮
◭ ◮
Back Close
Full Screen / Esc
Printer-friendly Version
Interactive Discussion
Discussion
P
a
per
|
Dis
cussion
P
a
per
|
Discussion
P
a
per
|
Discussio
n
P
a
per
|
(60◦C) for 24 h and then stored at room temperature until analyses at the laboratory. Filters were analyzed for LSi following the HF digestion technique described by Nelson et al. (1989).
2.1.2 Optical measurements
Remote sensing reflectance
5
Hyperspectral radiometric measurements (3 nm resolution) were performed in the 350– 750 nm spectral range with two TriOS radiometers. The first radiometer was fixed on the deck and measured the above-surface downward irradiance,Ed(0+,λ), whereλis the
wavelength of light in nanometers (nm). The second radiometer recorded the upward radiance profile in the water column,Lu(z,λ). Remote-sensing reflectance,Rrs(λ), was
10
then calculated from the in-water method, following the protocols prescribed by Mueller (2003):
Rrs(λ)=Lw(λ)/Ed(0+,λ) (1)
whereLw(λ) is the water leaving radiance which is calculated from the upwelling
ra-diance just below the sea surface estimated from the Lu(z,λ) vertical profile. A full
15
description of the radiometric data processing is given by Lubac and Loisel (2007). Chlorophyll fluorescence
Continuous profiles of chlorophyll fluorescence were measured using a Chelsea Aqua-tracka III fluorometer and was calibrated to TChl-aconcentration using HPLC pigment measurements. In practice, a calibration was made for each LD stations, by linear
20
BGD
8, 7859–7919, 2011Bio-optical anomaly and diurnal variability
of the particulate matter
H. Loisel et al.
Title Page
Abstract Introduction
Conclusions References
Tables Figures
◭ ◮
◭ ◮
Back Close
Full Screen / Esc
Printer-friendly Version
Interactive Discussion
Discussion
P
a
per
|
Dis
cussion
P
a
per
|
Discussion
P
a
per
|
Discussio
n
P
a
per
|
2.3575·fluo+0.0059, r2=0.9771, N=30; station C: TChl-a=3.0638·fluo−0.0097, r2=0.9812,N=30).
Backscattering coefficient
The particulate backscattering coefficient, bbp(λ), is sensitive to particle load, nature
(refractive index), and size distribution, and usually dominates the backscattering in
5
coastal waters. However, in open ocean waters the backscattering of pure seawater, bbw(λ), is significant, and uncertainties in this term have a large impact when computing
the particulate component (Twardowski et al., 2007). Vertical profiles of the scattering coefficient at 650 nm and three angles, 100◦, 125◦ and 150◦ were performed with a WETLabs ECO-VSF meter during LD stations only. Integration and extrapolation of
10
the measured signal from 90◦to 180◦yield the total backscattering coefficient,bb(650),
after correction for the loss of photons along the path due to absorption by particulate and dissolved material. The particulate backscattering coefficient, bbp(650), is then
obtained by correcting the signal for backscattering by pure seawater as described in Loisel et al. (2007). The theoretical model by Zhang et al. (2009) was used to correct
15
for the scattering by pure seawater while absorption correction was performed using in situ discrete measurements.
Beam attenuation coefficient
Profiles of beam transmission at 660 nm were measured by a WETLabs Cstar trans-missiometer with a 25 cm pathlength at all stations. Data were processed to give the
20
beam attenuation coefficient, c(660), for sea water, expressed in m−1. In order to get the attenuation coefficient for suspended particles,cp(660), the contribution from pure
seawater has to be subtracted toc(660). Instead of using the factory calibration, the meanc(660) value measured between 350 and 400 m was subtracted from each pro-file since at these depths, the very low particle concentration inducesc(660) values
25
BGD
8, 7859–7919, 2011Bio-optical anomaly and diurnal variability
of the particulate matter
H. Loisel et al.
Title Page
Abstract Introduction
Conclusions References
Tables Figures
◭ ◮
◭ ◮
Back Close
Full Screen / Esc
Printer-friendly Version
Interactive Discussion
Discussion
P
a
per
|
Dis
cussion
P
a
per
|
Discussion
P
a
per
|
Discussio
n
P
a
per
|
Morel (1998), has the advantage of accounting for the effects of instrumental drift and varying cleanliness of the optical windows. Theoretically,cp(660) represents the sum
of absorption and scattering coefficients, but in practice at 660 nm it can be assumed thatcp(660) corresponds to the particle scattering coefficientbp(660) due to very low
particulate absorption in the red part of the spectrum, especially for the oligotrophic
5
waters sampled during BOUM (Loisel and Morel, 1998). Absorption coefficient
The total absorption coefficient, ap(λ), is the sum of the phytoplankton absorption
co-efficient, aph(λ), and the absorption coefficient by non-pigmented particles, anap(λ).
Water samples were taken at 5 m depth and close to the DCM (Deep Chlorophyll
Maxi-10
mum) during the diel cycle casts. Samples were stored in a cool and dark compartment until filtration, at most 6 h after collection. Depending on particle content, a volume of 2.8 to 5.6 l was filtered onto 25 mm pre-combusted Whatman GF/F filters, immediately put in liquid nitrogen and stored at −80◦C until analysis in the laboratory within two months of sampling. Note that precombustion shrinks the pore size of the GF/F filters
15
for which it is initially assumed that particles with diameter greater than 0.5–0.7 mm are retained before shrinking. A Cary 100 UV/VIS double-beam spectrophotometer was used for the analysis. The total Optical Density of the particles on the filter, ODfp(λ),
was measured between 300–900 nm. Due to high instrumental noise in the upper and lower ends of the spectrum, only measurements in the range 350–850 nm were used
20
for further analysis. The absorption coefficientap(λ) (m− 1
) is computed as
ap(λ)=2.303Af/βVf[[ODfp(λ)−ODbf(λ)−ODnull] (2)
where ODbf(λ) is the optical density of a hydrated blank filter and ODnull is a residual correction from the infrared spectrum where particle absorption is minimal. When a double-beam spectrometer with automatic baseline correction is used, with a blank
25
filter in one of the filter holders, ODbf does not need to be subtracted during the
BGD
8, 7859–7919, 2011Bio-optical anomaly and diurnal variability
of the particulate matter
H. Loisel et al.
Title Page
Abstract Introduction
Conclusions References
Tables Figures
◭ ◮
◭ ◮
Back Close
Full Screen / Esc
Printer-friendly Version
Interactive Discussion
Discussion
P
a
per
|
Dis
cussion
P
a
per
|
Discussion
P
a
per
|
Discussio
n
P
a
per
|
scattering within the filter increases the absorption pathlength, and the absorption coef-ficient must be corrected for this pathlength amplification. The pathlength amplification factorβis calculated as
β=[C1+C2[ODfp(λ)−ODnull]]−1 (3)
The pathlength amplification varies with phytoplankton community and especially cell
5
size. The coefficients C1 and C2 were set to 0.359 and 0.390, respectively. These
values were obtained from Bricaud et Stramski (1990). Once the ODfp(λ) has been
measured, the pigments are extracted in methanol as described in (Mitchell et al., 2003), and ODfd(λ) is measured. anap(λ) is calculated in the same way as ap(λ),
re-placing ODfp(λ) with ODfnap(λ) in Eq. (2). The phytoplankton absorptionaph(λ) is then
10
computed asap(λ)−anap(λ).
2.1.3 Ancillary parameters
Continuous PAR measurements were recorded on board (1 measure each 30 s). In addition, vertical profile of PAR were measured at each station (short and long duration) allowing to compute the euphotic depth (Zeu: depth where the PAR is equal to 1 % of
15
its surface value). The mixed layer depth, MLD, is taken from Moutin et al. (2011) as the MLD 2 days lagged (see their Table 1a).
2.2 Production model
Diel variation in the POC estimates obtained from cp can be used to assess various
terms of a production budget including gross community production, community losses
20
or net community production rates following the method documented by Claustre et al. (2008). This method is also applied here forbbp.
BGD
8, 7859–7919, 2011Bio-optical anomaly and diurnal variability
of the particulate matter
H. Loisel et al.
Title Page
Abstract Introduction
Conclusions References
Tables Figures
◭ ◮
◭ ◮
Back Close
Full Screen / Esc
Printer-friendly Version
Interactive Discussion
Discussion
P
a
per
|
Dis
cussion
P
a
per
|
Discussion
P
a
per
|
Discussio
n
P
a
per
|
productions. It can be assessed by estimation of the increase in POC content during daytime (D∆POC). In practice:
Opt
GCP=D∆POC/Dt (4)
where Dt is equal to the day time duration corresponding to each day sampled. In prac-tice we considered the difference between minimum and maximum POC values for the
5
calculation of the later biogeochemical rates rather than the actual POC values corre-sponding to the sunlight diel evolution (see in Sect. 3.4). Similar estimation of the Net Community Production (OptNCP in mg C m−2d−1) and of the community losses (OptCL i.e. respiration and other processes such as grazing and sinking) can be performed following the POC evolution during nighttime, however the latter are not considered for
10
this study due to the absence of concurrent estimation of these biogeochemical rates from classical methods prevailing any validation of the estimates derived.
3 Results and discussion
3.1 Vertical distribution of the particulate matter
3.1.1 Vertical profile of fluorescence and pigment-derived phytoplankton size
15
classes
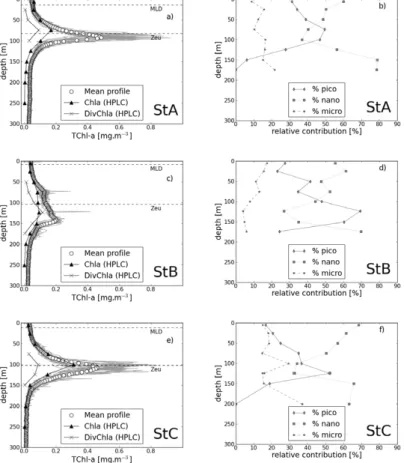
Vertical profiles of the total chlorophyll-a concentration, TChl-a, estimated from in situ fluorescence calibrated using discrete HPLC measurements (see material and method), present a general feature typical of oligotrophic conditions. A deep chloro-phyll maximum is found within the stratified part of the water column (Fig. 2a, c, e).
20
BGD
8, 7859–7919, 2011Bio-optical anomaly and diurnal variability
of the particulate matter
H. Loisel et al.
Title Page
Abstract Introduction
Conclusions References
Tables Figures
◭ ◮
◭ ◮
Back Close
Full Screen / Esc
Printer-friendly Version
Interactive Discussion
Discussion
P
a
per
|
Dis
cussion
P
a
per
|
Discussion
P
a
per
|
Discussio
n
P
a
per
|
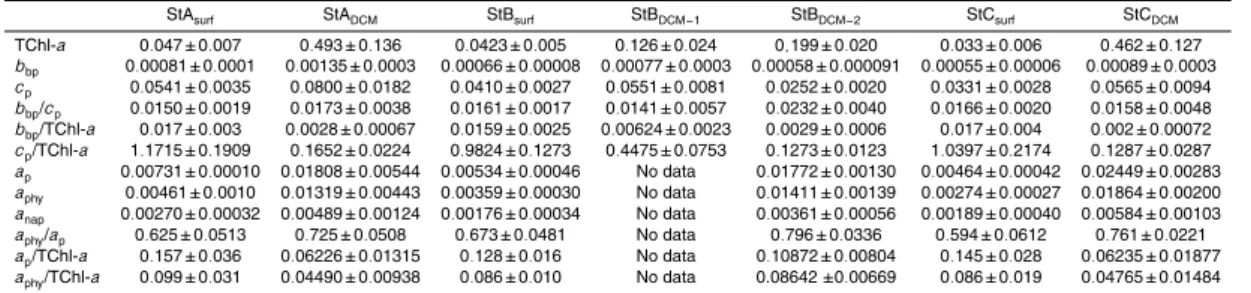
in good agreement with previous studies performed in oligotrophic areas (Moutin and Raimbault, 2002; Marty et al., 2002; Letelier et al., 2004; Uitz et al., 2006). The TChl-a values at the DCM are 0.49 and 0.46 mg m−3which, compared to their surface values, correspond to an increase in TChl-awith depth by a factor of 10.5 and 14, respectively. In contrast to these two stations, the TChl-aprofile at station B is characterized by two
5
unusual maxima (75 and 140 m) which are located above the euphotic depth (104 m) and below the top of the nitricline (114 m). Note that these TChl-a values slightly dif-fer from the one reported in Moutin et al. (2011) who used a single parameterization to convert the in situ fluorescence signal in terms of TChl-afor the three profiles measured at the LD stations A, B and C, while different parameterizations were used for each LD
10
station in the present manuscript. The surface TChl-a concentration at station B is equivalent to those of stations A and C, but increases only by a factor of 3 and 4.7 from the surface to the first and second maximum, respectively. As already discussed in sev-eral papers, the DCM is mainly explained by an intracellular increase in Chl-a, rather than by an increase in phytoplankton abundance (Kiefer et al., 1976; Cullen, 1982).
In-15
deed, the phytoplankton community physiologically adapts to the low irradiance level, and to the vicinity of the top of the nitricline. Chl-a concentration as measured from HPLC does not change between 75 and 150 m (=0.0845±0.0062 mg m−3), whereas Divinyl-chlorophyll-a presents a peak at 124 m (Fig. 2c). Therefore the two fluores-cence maxima observed at these stations do not reflect a change in the chlorophyll-a
20
concentration, but rather a change in the fluorescence/Chl-aratio which vary according to the nature, physiological state and optical properties of phytoplankton cells (Babin et al., 1996).
Vertical profiles of pigment-derived phytoplankton size classes as proposed by Claustre (1994) and Vidussi et al. (2001) and recently improved by Uitz et al. (2006)
re-25
BGD
8, 7859–7919, 2011Bio-optical anomaly and diurnal variability
of the particulate matter
H. Loisel et al.
Title Page
Abstract Introduction
Conclusions References
Tables Figures
◭ ◮
◭ ◮
Back Close
Full Screen / Esc
Printer-friendly Version
Interactive Discussion
Discussion
P
a
per
|
Dis
cussion
P
a
per
|
Discussion
P
a
per
|
Discussio
n
P
a
per
|
deep chlorophyll maximum, from where it starts increasing. The phytoplankton com-munity structure is equally dominated by pico and nano-phytoplankton at the DCM for stations A and C. This is in agreement with cytometry counting (Mauriac et al., 2011) and microscopic identification which show a mixture ofSynechococcus (about 1 µm) andProchlorococcus(0.5–0.8 µm). At station B, while the first DCM shows more
nano-5
phytoplankton (52 %) than pico-phytoplankton (35 %), the second DCM is mainly dom-inated by pico-phytoplankton (65 %). This diversity in the phytoplankton assemblages at the two DCM of station B which are characterized by the same Chl-a(as measured by HPLC) could explain the difference observed in the fluorescence peak intensity. 3.1.2 Vertical profiles of particulate attenuation and backscattering coefficients
10
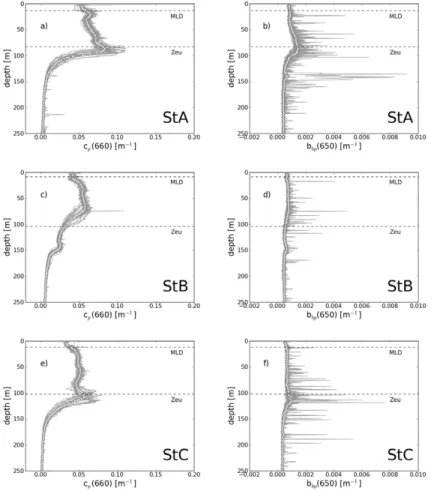
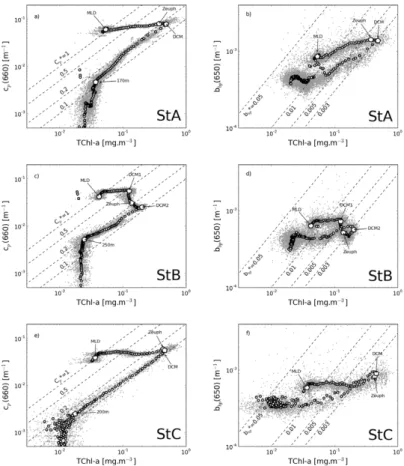
Particulate attenuation (Fig. 3a, c, e) and backscattering (Fig. 3b, d, f) coefficients were also acquired simultaneously to fluorescence profiles. The main vertical patterns observed in the fluorescence profiles are also identified for thecp and bbp ones. In
particular, both cp and bbp present a maximum located at the DCM, and their value
greatly decreases below. However, some differences are noticeable. Firstly, while
15
TChl-a sharply increases from the surface to the DCM, this increase is much less pronounced for both cp and bbp at each long duration stations. For instance, while
TChl-a increases by a factor of 14, cp and bbp only increase by a factor of 1.9 and
1.6, respectively at station C (Table 1). Secondly, the two TChl-amaxima measured at station B are also observable on thecpprofiles but their intensity is reversed. From the
20
first (z=75 m) to the second (z=140 m) peak thecpvalue decreases by a factor of 2.2,
whereas TChl-a increases by a factor of 1.6. Thirdly, twocp maxima (at 22 and 85 m)
are also observable at station A, where only one TChl-amaximum is measured. Finally, compared with the fluorescence and particulate attenuation profiles, the particulate backscattering profiles exhibit numerous brief and large spikes, which may be related
25
BGD
8, 7859–7919, 2011Bio-optical anomaly and diurnal variability
of the particulate matter
H. Loisel et al.
Title Page
Abstract Introduction
Conclusions References
Tables Figures
◭ ◮
◭ ◮
Back Close
Full Screen / Esc
Printer-friendly Version
Interactive Discussion
Discussion
P
a
per
|
Dis
cussion
P
a
per
|
Discussion
P
a
per
|
Discussio
n
P
a
per
|
Combination of vertical profiles of particulate scattering coefficients and fluorescence profiles have previously been used to explain the origin of the variability of TChl-awithin the whole water column (Kitchen and Zaneveld, 1990; Loisel and Morel, 1998). The cp vs. TChl-a diagrams, characterized by a 7-shape, are typical of oligotrophic
envi-ronments (Fig. 4). Between the surface and the DCM,cp is more or less constant,
5
and then linearly decreases with TChl-atoward the deeper aphotic level. The horizon-tal segment observed from surface waters to the DCM illustrates the photoacclimation process responsible for the intraspecific variation in the cellular chlorophyll concentra-tion. The cp vs. TChl-a linear behavior observed below the DCM can be interpreted
as a progressive dilution of the entire particulate matter assemblage seen by the
trans-10
missometer (Loisel and Morel, 1998). Values of the specific particulate coefficient, cp*(=cp/TChl-a), vary between about 1 and 0.1 m
2
(mg TChl-a)−1 from the surface layer to the DCM for the three long duration stations. The linear trend observed below the DCM is characterized bycp* values of 0.1–0.2 m
2
(mg TChl-a)−1
. These different cp* values are typical of those found in other oligotrophic environments (see Fig. 5 in
15
Loisel and Morel, 1998).
The two DCMs at station B are also clearly visible on thecpvs. TChl-adiagram. The
photoacclimation of phytoplankton cells is evidenced by the horizontal segment from the surface layer to the first DCM, withcp* value decreasing by a factor of 2 (from 1 to
0.5 m2(mg TChl-a)−1). Then, while TChl-aincreases by a factor of 1.58 between the
20
first and the second DCM, cp decreases by a factor of 2.2, inducing cp* to decrease
by a factor of about 5. Such highcp* variability observed over a relatively thin water
layer (65 m) may be caused by different factors. The value ofcp* at 660 nm, which is
equivalent tobp* (see material and method), is driven by the scattering cross section
of the microbial organisms (function of their refractive index and size distribution), as
25
BGD
8, 7859–7919, 2011Bio-optical anomaly and diurnal variability
of the particulate matter
H. Loisel et al.
Title Page
Abstract Introduction
Conclusions References
Tables Figures
◭ ◮
◭ ◮
Back Close
Full Screen / Esc
Printer-friendly Version
Interactive Discussion
Discussion
P
a
per
|
Dis
cussion
P
a
per
|
Discussion
P
a
per
|
Discussio
n
P
a
per
|
by a factor of 1.34 from the surface to the first DCM, probably due to the presence of detritus or other non-pigmented particles, and decreases by a factor of 2.2 between the two DCM due to the adaptation of phytoplankton carbon content to the irradiance level (Table 1).
The two distinct vertical patterns observed for thecpvs. TChl-arelationship (i.e. the
5
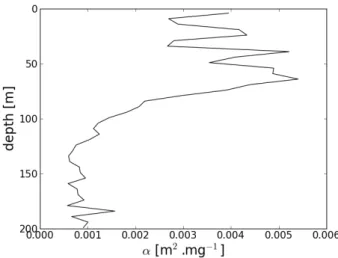
7-shape) are much less noticeable for the particulate backscattering coefficient. The evolution of bbp as a function of TChl-a from the surface layer to the DCM is nearly similar to that observed below the DCM. In contrast tocp,bbp tends to increase with
TChl-a from the surface to the DCM, especially for stations A and C. While cp* is
roughly constant from the DCM to deep waters,bbp* exhibits large variations of similar
10
amplitude for the two oceanic layers located above or below the DCM. Variation of bbp* from 0.003 to 0.01 m
2
(mg TChl-a)−1is found within these two oceanic layers, for instance at station A. For the same range of TChl-a, variations inbbp* computed from
the Huot et al. (2008)’s formulation gives 0.002 and 0.005 m2 (mg TChl-a)−1. These values are consistent with thebbp* measurements performed around the DCM, but are
15
significantly lower than those measured within the surface waters (by a factor of 2). The differences observed between the cp vs. TChl-a and bbp vs. TChl-a vertical patterns
certainly reflects variation in the sensitivity ofbbp and cp regarding the nature of the
whole particulate matter. The origins of these differences are discussed in the following section.
20
3.2 The bio-optical environment of the particulate matter at the three long duration stations
Relationships between inherent optical properties (IOPs) and biogeochemical param-eters are analyzed for the three long duration stations to establish their bio-optical en-vironment, which in turn is compared with standard relationships previously developed
25
BGD
8, 7859–7919, 2011Bio-optical anomaly and diurnal variability
of the particulate matter
H. Loisel et al.
Title Page
Abstract Introduction
Conclusions References
Tables Figures
◭ ◮
◭ ◮
Back Close
Full Screen / Esc
Printer-friendly Version
Interactive Discussion
Discussion
P
a
per
|
Dis
cussion
P
a
per
|
Discussion
P
a
per
|
Discussio
n
P
a
per
|
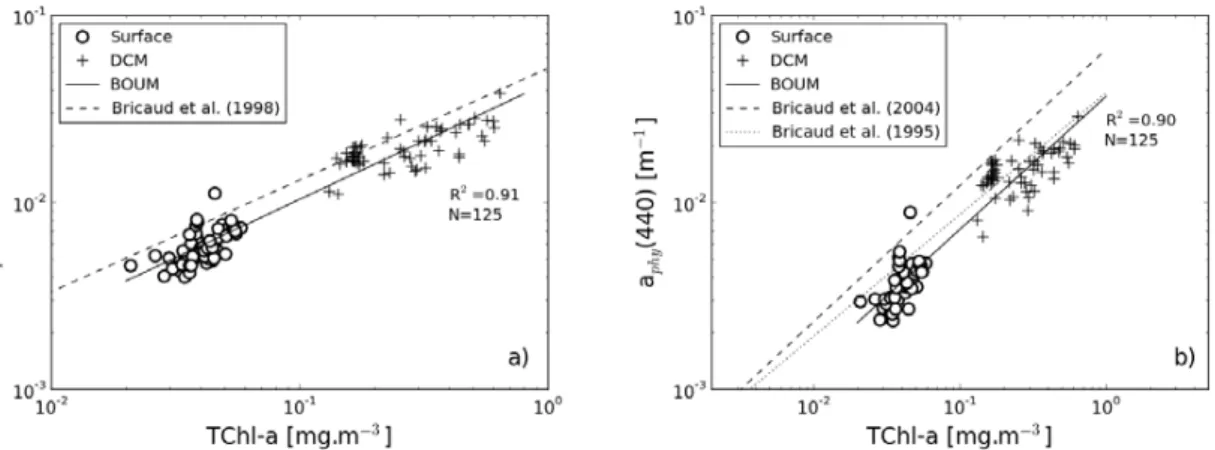
The behavior of the particulate, ap(440), and phytoplankton, aphy(440), absorption
coefficients are analyzed as a function of the total chlorophyll-aconcentration, TChl-a (Fig. 5). The variation ofaphy(440) andap(440) versus TChl-afrom the surface water
to the DCM can be described by the following relationships:
aphy(440)=0.0364TChl-a0.708 (N=125, r2=0.89) (5)
5
ap(440)=0.0432TChl-a0.622 (N=125, r2=0.91) (6)
whereN is the number of samples, and r2 is the determination coefficient. The non-linear character of these two relationships is particularly consistent with previous stud-ies (Yentsch and Phinney, 1989; Bricaud et al., 1995, 1998). Exponents in Eqs. (5) and (6) are relatively close to each other, emphasizing that absorption by non-algal
parti-10
cles is proportional to phytoplankton absorption at 440 nm. On average, phytoplankton absorption contributes to 62±5, 67±5, and 59±6 % of the particulate absorption mea-sured at 440 nm in surface waters of LD stations A, B, and C, respectively. These proportions are consistent with previous studies performed in the Mediterranean Sea (Bricaud et al., 1998; Oubelkheir et al., 2007). These proportions significantly increase
15
around the DCM to reach about 70 % (Table 1). The exponents in Eqs. (5) and (6) are similar to previous findings established using large data sets made of in situ measure-ments collected in various oceanic regions (Bricaud et al., 1995, 1998, 2004; Dupouy et al., 2003). For a given chlorophyll concentration, the values ofap(440) and espe-cially ofaphy(440) measured in the surface layer during the BOUM cruise are however
20
lower than the mean values previously published. For instance, the mean specific phy-toplankton absorption coefficients,aphy*(=aphy/TChl-a), measured in the surface layer
of station A, is lower by a factor of 1.5 and 1.1 compared to the mean values given in Bricaud et al. (2004) and Bricaud et al. (1995), respectively (see Table 1). However, theaphy* values measured at the three long duration stations are in the range of the
25
natural variability ofaphy* reported by Bricaud et al. (2004), and very close to the ones
BGD
8, 7859–7919, 2011Bio-optical anomaly and diurnal variability
of the particulate matter
H. Loisel et al.
Title Page
Abstract Introduction
Conclusions References
Tables Figures
◭ ◮
◭ ◮
Back Close
Full Screen / Esc
Printer-friendly Version
Interactive Discussion
Discussion
P
a
per
|
Dis
cussion
P
a
per
|
Discussion
P
a
per
|
Discussio
n
P
a
per
|
the same TChl-a range (about 0.02–0.05 mg m−3), the BOUMaphy* values are also in
agreement with those obtained in ultra-oligotrophic waters sampled in the South Pacific Gyre during the BIOSOPE cruise (Bricaud et al., 2010).
The relatively low aphy values reported in the present study compared to the
val-ues generally adopted in open ocean waters can be explained by a difference in the
5
size structure and accessory pigments of the phytoplankton assemblage. The phyto-plankton size index (SI) values, calculated as in Bricaud et al. (2004), are in the upper limit of the reported values by Bricaud et al. (2010) which corresponds to those mea-sured in ultra-oligotrophic waters sampled during BIOSOPE. Based on HPLC measure-ments, the SI (and TChl-a) values at stations A, B, and C are 11.1 (0.06 mg m−3), 11.7
10
(0.04 mg m−3), and 7.7 (0.026 mg m−3), respectively. These relatively high SI values explain the lowaphycoefficient through the packaging effect (Morel and Bricaud, 1981).
Concerning accessory pigments, while the ratio values of photosynthetic carotenoids, i.e. fucoxanthin, peridinin, 19′-HF and 19′-BF; to TChl-a are in the range of expected values, the non photosynthetic pigments (zeaxanthin, diadinoxanthin, alloxanthin, and
15
β-carotene) to TChl-a ratio values are very low (about 0.15–0.33). These two fac-tors (i.e. relatively high SI and low non photosynthetic pigments to TChl-aratio), which both explain the relatively low aphy values, are consistent with a significant
contribu-tion of nanophytoplankton to the total phytoplankton biomass. The same conclusion was reached by Bricaud et al. (2010) for the phytoplankton absorption measurements
20
performed in the very clear water of the South Pacific Gyre.
The behavior ofcp(660) with Chl-a, and POC has been studied in various parts of the
global ocean for about 3 decades (Gordon and Morel, 1983; Loisel and Morel, 1998; Gardner et al., 1999; Stramska et al., 2005). In contrast, open ocean water field mea-surements of the particulate backscattering coefficient,bbp(650), are relatively scarce
25
BGD
8, 7859–7919, 2011Bio-optical anomaly and diurnal variability
of the particulate matter
H. Loisel et al.
Title Page
Abstract Introduction
Conclusions References
Tables Figures
◭ ◮
◭ ◮
Back Close
Full Screen / Esc
Printer-friendly Version
Interactive Discussion
Discussion
P
a
per
|
Dis
cussion
P
a
per
|
Discussion
P
a
per
|
Discussio
n
P
a
per
|
assemblage. Based on Mie scattering theory, which assumes that suspended par-ticles are homogeneous spheres, more than 80 % of the scattering signal is due to particles less than 8 µm in diameter. In contrast, for the same particle size distribution (a Junge type with an exponent of−4), and a mean refractive index relative to water of 1.05 (typical of phytoplankton cells), most of the backscattering signal is caused by
5
particles smaller than about 1 µm (Stramski and Kieffer, 1991; Morel and Ahn, 1991). However, recent fractionation experiments performed in the open ocean (Dall’Olmo et al. 2009) and in coastal waters (Roesler and Boss, 2008) indicate contributions tobbp
from particles larger than 3 µm of 53±7 % (at 470 nm) and about 70 % (at 440 nm), respectively, and much lower contributions (10–30 %) from submicron particles. The
10
origin of thebbp signal is then still controversial and more laboratory experiments and
in situ measurements are needed to explain the variability observed in the particulate backscattering signal (Stramski et al., 2004).
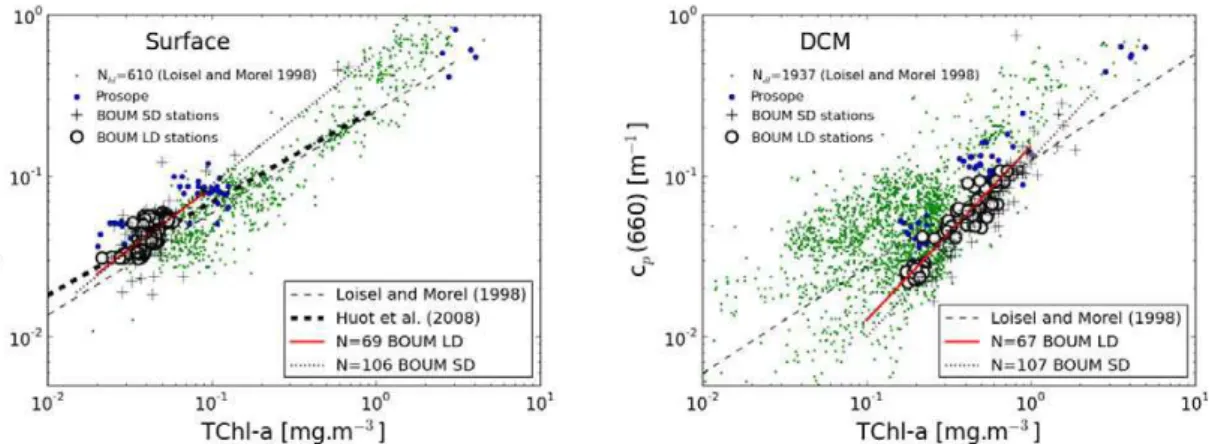
The (TChl-a,cp) data points obtained at the surface for the long (N=69) and short (N=106) duration stations fall within the range of variability obtained over a larger data
15
set (Loisel and Morel, 1998), which covers different oceanic regions, and are in agree-ment with previous measureagree-ments performed in the Mediterranean Sea during the PROSOPE (French acronym for “Productivit ´e des Syst `emes Oc ´eaniques PElagiques” or “productivity of oceanic pelagic systems” ) cruise in September 1999 (Oubelkheir et al., 2005) (Fig. 6). The standard non-linear behavior ofcp(660) with TChl-ais well
char-20
acterized from the surface waters measurements performed at the three LD stations (Fig. 6a):
cp(660)=0.499TChl-a0.77 (N=69, r2=0.56) (7)
While the exponent 0.77 is remarkably close to the one found in Loisel and Morel (1998) for the upper homogeneous layer of the ocean, the coefficient (0.499) falls above the
25
BGD
8, 7859–7919, 2011Bio-optical anomaly and diurnal variability
of the particulate matter
H. Loisel et al.
Title Page
Abstract Introduction
Conclusions References
Tables Figures
◭ ◮
◭ ◮
Back Close
Full Screen / Esc
Printer-friendly Version
Interactive Discussion
Discussion
P
a
per
|
Dis
cussion
P
a
per
|
Discussion
P
a
per
|
Discussio
n
P
a
per
|
used over different regions of the global ocean (Loisel and Morel, 1998). The rela-tionship described in Eq. (7) is similar to the one established using all the surface measurements performed at short duration stations:
cp(660)=0.574TChl-a0.81 (N=106, r2=0.64) (8)
The exponent in Eq. (7) is closer to those obtained in Loisel and Morel (1998) when
5
all pairs of available data are considered (their subset 1+2+3 in Table 2), and larger to the one obtained when data measured in the north Atlantic ocean are excluded (their subset 1). The mean surface specific particulate attenuation coefficients, cp*(=
cp/TChl-a), at stations A, B, and C, are 1.17±0.19, 0.98±0.13, and 1.04±0.21 m 2
(mg TChl-a)−1 (Table 1). These values are significantly higher than those calculated
10
using the mean global relationships (subset 1+2+3) of Loisel and Morel (1998) which are 0.71, 0.73, and 0.77 m2(mg TChl-a)−1at stations A, B, and C, respectively. Note that the BOUM surfacecp* values are consistent with those measured in oligotrophic
waters sampled during the PROSOPE cruise (Fig. 6a).
A tight relationship is also observed betweencpand TChl-aat the DCM (Fig. 6b):
15
cp(660)=0.152TChl-a1.08 (N=67, r2=0.9) (9)
Note that cp vs. TChl-a relationship is closer to linearity in the DCM (Eq. 9) than in
surface waters (Eq. 7). This relationship is equivalent to the one established for the short duration stations (not shown). Compared with surface waters, the variability incp
is more tightly related to that of TChl-a at the DCM, as stressed by the relatively high
20
determination coefficient found for the latter relationship. The mean specific attenuation coefficient decreases from the surface water to the DCM by a factor of 6.4, 7.7, and 5.2 at stations A, B (second maximum), and C (Table 1).
In situcp measurements have been extensively used to assess the spatio-temporal
variability of POC in open ocean waters (Marra et al., 1995; Loisel and Morel, 1998;
25
Claustre et al., 1999; Karageorgis et al., 2008). The conversion factor betweencpand
BGD
8, 7859–7919, 2011Bio-optical anomaly and diurnal variability
of the particulate matter
H. Loisel et al.
Title Page
Abstract Introduction
Conclusions References
Tables Figures
◭ ◮
◭ ◮
Back Close
Full Screen / Esc
Printer-friendly Version
Interactive Discussion
Discussion
P
a
per
|
Dis
cussion
P
a
per
|
Discussion
P
a
per
|
Discussio
n
P
a
per
|
size distribution, shape and internal structure of the particles in suspension. Despites the large natural variability of these different parameters, relatively similar relationships have been established between cp and POC in different oceanic regions (Fig. 3c in
Stramska et al., 2005). For the surface waters (Eq. 10) of the BOUM stations, POC is related tocpas follows:
5
POC=404.cp(660)+29.25 (N=31, r2=0.6) (10)
This equation was developed using mainly the short stations, since only two POC pro-files were measured during each long duration stations. The coefficient 404 is in the range of previously published values used to convertcp into POC (see references in
Stramska et al., 2005). The relationship between POC and cp presents much less
10
variability from the surface layer to the DCM (not shown) than thecp vs. TChl-a re-lationship which greatly changes along the water column. This is explained by the fact that the vertical profiles of POC are much more constant than those of TChl-a, as already shown previously (Dufor ˆet-Gaurier et al., 2010).
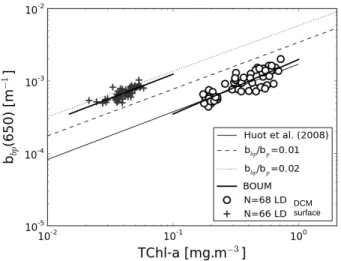
The evolution of bbp as a function of TChl-a (Fig. 7) significantly differs between
15
surface waters (Eq. 11) and the DCM (Eq. 12):
bbp(650)=0.00573TChl-a0.67 (N=68, r2=0.59) (11)
bbp(650)=0.00197TChl-a0.75 (N=66, r2=0.75) (12)
Similarly to thecp vs. TChl-a relationships established at the surface and DCM, the
exponents in Eqs. (11) and (12) are relatively similar, but the coefficients sharply
de-20
crease from the surface to the DCM. Between these two layers, the specific backscat-tering coefficients, bbp/TChl-a, decrease by a factor 3 to 5, depending on the station
(Table 1). This vertical pattern stresses that the bulk particulate matter is a much more efficient backscatter at the surface than at the DCM for the same TChl-a. Note that the bbp/TChl-a mean values are remarkably similar between the three long duration
25
BGD
8, 7859–7919, 2011Bio-optical anomaly and diurnal variability
of the particulate matter
H. Loisel et al.
Title Page
Abstract Introduction
Conclusions References
Tables Figures
◭ ◮
◭ ◮
Back Close
Full Screen / Esc
Printer-friendly Version
Interactive Discussion
Discussion
P
a
per
|
Dis
cussion
P
a
per
|
Discussion
P
a
per
|
Discussio
n
P
a
per
|
The evolution ofbbp as a function of TChl-aestablished during the BOUM cruise is
compared with the empirical formulation documented by Huot et al. (2008), and with the semi-analytical model of Morel and Maritorena (2001). In the latter, the mean for-mulation used between bp and TChl-a (Loisel and Morel, 1998) is replaced by the
empirical formulation developed over the BOUM data set (Eq. 7), and two different
val-5
ues of the backscattering ratio,bbp/bp, are successively used: 2 % as in Morel (1988),
and 1 % as in Morel and Maritorena (2001) who decreases the Morel (1988)’s value on the basis of theoretical considerations. The bbp BOUM parameterization (Eq. 11)
follows the same trend with TChl-acompared to the three other models, especially the one developed by Huot et al. (2008) which presents exactly the same exponent than
10
in Eq. (11) (Fig. 7). However, for a given chlorophyll concentration, the bulk particulate matter suspended in the surface water of the long duration stations backscatters light much more efficiently than what is expected for oligotrophic waters. Considering for instance a TChl-a of 0.05 mg m−3
,bbp calculated using Eq. (11) is greater by a factor
of 3.3 compared to the value computed using the Huot et al. (2008)’s model. A
rel-15
atively good agreement can be observed between the BOUM data set and the Morel and Maritorena (2001)’s model when the greatest particulate backscattering ratio value (2 %) is used and whenbp vs. TChl-a is modeled using Eq. (7) instead of the Loisel
and Morel (1998)’s parameterization which is characterized by a lowerbp/TChl-avalue
(Fig. 7). However, based on Mie scattering calculations, it appears thatbbp/bpvalue of
20
2 % is too high for organic particles, which are predominant in case 1 waters (Ulloha et al., 1994; Morel and Maritorena, 2001). Similar or higherbbp/bp values are currently
encountered in coastal areas (Sullivan et al., 2005; Loisel et al., 2007), but have never been measured in open ocean waters, at least in absence of suspended mineral par-ticles from organic (coccolithophorids) or inorganic (atmospheric inputs) origin. The
25
reasons of such singularbbp/bp values andbbp vs. TChl-a relationship are discussed
BGD
8, 7859–7919, 2011Bio-optical anomaly and diurnal variability
of the particulate matter
H. Loisel et al.
Title Page
Abstract Introduction
Conclusions References
Tables Figures
◭ ◮
◭ ◮
Back Close
Full Screen / Esc
Printer-friendly Version
Interactive Discussion
Discussion
P
a
per
|
Dis
cussion
P
a
per
|
Discussion
P
a
per
|
Discussio
n
P
a
per
|
3.3 The Mediterranean color anomaly as seen during the BOUM cruise
3.3.1 Ocean color anomaly
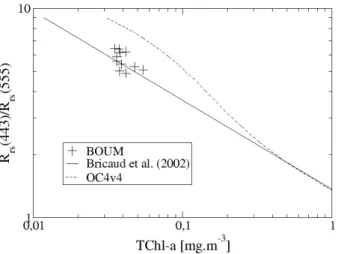
Remote sensing reflectance measurements performed during the BOUM cruise con-firm the marginal bio-optical character of the Mediterranean Sea, as previously stressed in different studies (Gitelson et al., 1996; Claustre et al., 2002; Antoine et
5
al., 2006). The blue-to-green reflectance ratios vs. TChl-a measurements depart sig-nificantly from the OC4v4 empirical formulation (O’Reilly et al., 1998) currently used to assess TChl-afrom the Seaviewing Wide Field-of-view Sensor (SeaWiFS) (Fig. 8). Based on the restricted BOUM radiometric data set, the OC4v4 algorithm overesti-mates TChl-aby a factor of two, with a mean ratio of the retrieved-to-in situ TChl-a
us-10
ing OC4v4 of 2.2±0.3. This ratio drops to 0.9±0.2 when using the regional algorithm developed from a data set of reflectance and chlorophyll measurements collected dur-ing the PROSOPE and AMOFRONT-2 cruises in the Mediterranean Sea (Bricaud et al., 2002). Different assumptions were proposed to explain the fact that the Mediterranean Sea is greener than TChl-a alone indicates. The presence of phytoplankton cells with
15
a high specific attenuation coefficient, such as coccolithophorids, was suggested to ex-plain the bias observed in ultra oligotrophic waters of the eastern Mediterranean Sea (Gitelson et al., 1996). In contrast to this assumption based on a specific phytoplank-ton nature, the presence of submicron Saharan dust in suspension within the upper layer was advanced by Claustre et al. (2002) to explain the enhanced absorption in the
20
blue as well as the enhanced backscattering in the green part of the visible spectrum, which tend to decrease the blue-to-green reflectance ratio values. More recently, Morel and Gentili (2009) proposed that the TChl-aoverestimation by standard (global) algo-rithms (such as OC4v4) reflects the presence of a high CDOM background within the Mediterranean waters.
25
BGD
8, 7859–7919, 2011Bio-optical anomaly and diurnal variability
of the particulate matter
H. Loisel et al.
Title Page
Abstract Introduction
Conclusions References
Tables Figures
◭ ◮
◭ ◮
Back Close
Full Screen / Esc
Printer-friendly Version
Interactive Discussion
Discussion
P
a
per
|
Dis
cussion
P
a
per
|
Discussion
P
a
per
|
Discussio
n
P
a
per
|
respectively. The same mean TChl-a value can be obtained using OC4v4 with a BG value of 8.2, that is about 1.4 times higher than the BG in situ value. The lower than expected BG value is explained by a lower than expected green-to-blue backscatter-ing ratio,bb(443)/bb(555), and/or a higher than expected blue-to-green absorption
ra-tio,a(555)/a(443). Based on standard IOPS vs. TChl-a relationships the variability of
5
BG with TChl-a, as driven by the empirical OC4v4 algorithm, can be reproduced to study the impact of each IOPs on the BG value. For that purpose,bbp(λ),ap(λ), and acdom(λ) are modeled as a function of TChl-aaccording to Huot et al. (2008), Bricaud
et al. (1998), and Morel and Gentili (2009), respectively. For the mean TChl-a value obtained from the present data set (i.e. 0.041 mg m−3) the BG value (=7.9) calculated
10
using these different relationships is close to the OC4v4 BG value (=8.2), emphasiz-ing that these relationships can be used in this sensitivity analysis. The impact of each IOPs measured during BOUM on the BG values is now examined by modifying the mean IOPs vs. TChl-arelationships based on the BOUM data set.
3.3.2 Absorption by particles larger than about 0.5–0.7 µm
15
The substitution of the mean (global) ap(λ) relationships at 443 and 555 nm by those
established from the present in situ data set in the BG parameterization only induces a very slight increase of BG. This increase is due to the lower than expectedap(440)
andap(555) values. Such low values are consistent with measurements performed by
Bricaud et al. (2010) during BIOSOPE. The measured non-algal particles,anap(440),
20
values are consistent with those calculated using the mean relationship established by Bricaud et al. (2010) betweenanap(440) and TChl-a from data collected in diff
er-ent oceanic areas ranging from ultra-oligotrophic and eutrophic waters. For instance, for TChl-a=0.05 mg m−3,anap(440) is equal to 0.0023 and 0.0021 m−
1
for the BOUM data set and from the Bricaud et al. (2010)’s parameterization, respectively.
There-25
BGD
8, 7859–7919, 2011Bio-optical anomaly and diurnal variability
of the particulate matter
H. Loisel et al.
Title Page
Abstract Introduction
Conclusions References
Tables Figures
◭ ◮
◭ ◮
Back Close
Full Screen / Esc
Printer-friendly Version
Interactive Discussion
Discussion
P
a
per
|
Dis
cussion
P
a
per
|
Discussion
P
a
per
|
Discussio
n
P
a
per
|
precombustion) can not explain the 40 % BG decrease (compared to its expected val-ues for the same TChl-a).
3.3.3 Absorption by small particles and colored dissolved organic matter
Decrease in the blue-to-green reflectance ratio by a factor of 1.4 by modifying only the amount of colored dissolved organic matter would require to increase each of the
5
mean values ofacdom(443) andacdom(555) as modeled by Morel and Gentili (2009) by
a factor of 2.9. Unfortunately, absorption by colored dissolved organic matter,acdom(λ),
and absorption by small particles with diameters between about 0.2 and 0.7 µm,asp(λ),
have not been measured during the BOUM cruise. asp(λ) represents the missing part
in the absorption budget, asap(λ) represents the absorption by particles retained by
10
a filter with a nominal pore size of about 0.5–0.7 µm, andacdom(λ) is the absorption
of the matter after filtration onto membrane filters with a 0.22 µm pore size. However, acdom(λ)+asp(λ) can be modeled by subtracting the measured particulate absorption,
ap(λ), and the pure sea water absorption, aw(λ) (Pope and Fry, 1997), coefficients to the total absorption coefficient, a(λ), retrieved from radiometric measurements. The
15
remote-sensing reflectance, the average attenuation coefficient for downwelling irradi-ance,Kd(λ), between the surface and the first attenuation depth, and the solar zenith angle, are used as input parameters in the new version of the Loisel and Stramski (2000)’s model to assess the total absorption and backscattering coefficients. This new version (Loisel et al., 2011) directly accounts from Rrs instead of irradiance
re-20
flectance,R(0−), and includes more realisticb/a
−bw/bcombination in the different
pa-rameterizations used in the model (bandbware the total and pure sea water scattering
coefficients, respectively). Based on a synthetic data set (IOCCG, 2006)bbp(443) and
a−aw(443) are retrieved with a Root Mean Square error of 0.01 and 0.02. Based on
the BOUM data set whenbbp,Rrs and Kdmeasurements are available, the
inversed-25
to-measured bbp(650) ratio is 0.92±0.11. The mean and standard deviation
mea-sured and inversedbbp(650) values are 0.00074±0.00005 and 0.00068±0.00011 m− 1
BGD
8, 7859–7919, 2011Bio-optical anomaly and diurnal variability
of the particulate matter
H. Loisel et al.
Title Page
Abstract Introduction
Conclusions References
Tables Figures
◭ ◮
◭ ◮
Back Close
Full Screen / Esc
Printer-friendly Version
Interactive Discussion
Discussion
P
a
per
|
Dis
cussion
P
a
per
|
Discussion
P
a
per
|
Discussio
n
P
a
per
|
respectively. Even if the number of stations is limited (N=7), this result gives us a certain degree of confidence for the absorption assessment using the present model. The mean and standard deviation ofacdom(443)+asp(443) are 0.0054±0.0011 m−
1
for these stations. These inversed values are slightly higher than those calculated from the mean global relationship of Morel and Gentili (2009) betweenacdom(443) and TChl-a.
5
Indeed, for the TChl-a values measured at the stations considered for the inversion, the mean and standard deviation values ofacdom(443) are 0.0042±0.0004 m−
1
. The inversed values are greater by a factor of 1.29 than the averaged values, which is far from the factor 2.9 that should be considered to explain the BG anomaly with only absorption by CDOM (and submicron particles).
10
3.3.4 The scattering and backscattering anomalies
The present in situ data set reveals that both surface cp* and bbp* are higher than
expected using standard relationships developed for open ocean waters (Loisel and Morel, 1998; Huot et al., 2008). Our highcp* values are consistent with the findings of
Gitelson et al. (1996) and Claustre et al. (2002). For instance, Claustre et al. (2002)
15
have shown that the particulate scattering coefficients measured in the Ionian Sea (eastern basin of the Mediterranean sea) were higher by a factor of 2.4 than the ones modeled according to Loisel and Morel (1998) using their data subsets 2 and 3. With the BOUM data set this overestimation reaches a factor of 1.4. The discrepancy be-tween the measured and modeledcp, is even more pronounced for bbp in the ultra
20
oligotrophic parts of the Mediterranean Sea sampled during the BOUM cruise. This is the first time that such greatbbp* values are reported in ultra oligotrophic
environ-ments, as only scattering or attenuation measurements were performed in the previ-ously cited studies (mainly due to the relatively recent commercial availability of appro-priate instrumentation). While recent studies stressed that higher than averagedbbp*
25