The article was reported at the International Conference «The Advanced Technology, Equipment and Analytical Systems for Materials», Kursk, 13-14 May, 2014
3D-Self-Assemblage and Self-Organization on Natural Colloidal Microinclusions in Mineral Sediments
A.P. Kuzmenko1, Chan Nyein Aung1, V.V. Rodionov1, M.B. Dobromyslov2
1 South-West State University, 94, 50 Let Oktyabrya Str., 305040 Kursk, Russia
2 Pacific National University, 136, Tikhookeanskaya Str., 680035 Khabarovsk, Russia
(Received 19 May 2013; revised manuscript received 09 July 2014; published online 15 July 2014)
The results of micro- and nanoscale research of fractal structure sediments from mineral water re-ceived by the drop method are given. Qualitative analysis of the underlying physical phenomena, allowed us to establish the conditions of their 3D-fractalization that consider the size of colloidal nanoparticles, its location and height from the drop center : rminRmaxhmax and rmaxRminhmin. It is shown that the main contribution to 3D fractalization is due to surface tension forces and the Coulomb force interaction.
Keywords: Self-assemblage, Self-organization, Fractal structure, Colloidal micro and nanoinclusions, Surface tension, Coulomb force interaction.
PACS numbers: 05.65. + b, 61.43.Hv
1. INTRODUCTION
Changeover to the electronic elemental base with transistor elements of a nano-domain size ( 10 nm) [1, 2] indicates that traditional technological approach-es are faced with the problem that is due to fundamen-tal physical limits, making progress in nanoelectronics critically difficult. This is dictated in many ways by the fact that the changeover to nano-domain is accompa-nied by a manifestation of new physico-chemical effects [3], in particular, organization and self-assemblage, on practical use of which development en-gineers of both electronics and new nanostructured materials place great hopes.
In this connection , natural drop-like entities that contain colloidal micro-inclusions with particle radius (R) whose total energy (E) is determined in this way: ER3 + R2 + R, where contributions ofvolume
en-ergy –, surface energy – and surface tension – are included, present an appropriate model for studying regularities in space organization and self-assemblage. In [4] with 2D-cell automate a computer planar model was examined of self-assemblage and self-organization of cluster nanodendritic formations, as components of noncovalent synthesis, as a result of adhesion between molecules and ensembles with con-sideration for the density distribution of diffusing par-ticles. However, planar problems were sold only. For-mation of columnar semiconducting polymeric nanostructures that originate in spin casting with con-sideration for the effect of substrate, solvent, concen-tration and external electric field applied was investi-gated in [5]. Synthesis and study of self-assembled 3D droplet colloidal microstructures formed at a superhy-drophobic surface that has nucleating structural ele-ments of colloidal sizes as functions of evaporation con-ditions, number of particles and their size are consid-ered in [6]. The workers in [7], as applied to binary sys-tems from metals, proposed an analytical model of clus-ter self-organization via voluminous crystallization in a supercooled state that considers their kinetic varia-tions, nonlinearity, and processes of their generation as being non-equilibrium. Those formations are assigned
sets of eigen-frequencies. Parametric or resonant exci-tation of these frequencies makes it possible, according to [7], control the crystallization of cluster binary sys-tems. The results of investigation with fractal struc-tures (FSs) from heterogeneous and heterophase sys-tems of natural origin are provided in [8, 9]. Those structures were obtained by the drop method when hydrodynamic streams and gravitational effects are small i.e. L ( / g)1/2 3 nm for water, and capillary
forces (dependent on surface forces ), adsorption, and interphase forces that are dependent on the density of interacting systems, are major contributors to the pro-cesses of self-organization and self-assemblage.
The data obtained on 3D-fractalization in distribu-tion of chemical elements and compounds that appear as a result of mineral waters (MWs) evaporation pre-senting ideal natural colloidal solutions, in our view, add to the knowledge about organization and self-assemblage in such systems and are of great im-portance for the developments in nanomaterial science and electronics.
2. EXPERIMENTAL PROCEDURES
Sediments of MWs from mineral springs of North-ern Caucasus and Kursk region (Russia) have been studied. These MWs are characterized by a diversity of cation and anion colloidal formations from which at normal conditions (NCs) dendritic structures are formed after precipitation by the drop method. The features of FSs have been studied with the help of atomic-force microscope (AFM) (SmartSPM AIST NT,Russia), scanning electron microscope (SEM) – (JSM 6610-LV, JEOL, Japan), digital holographic mi-croscope (Lynceetec, Switzerland). The elemental com-position of FSs and their distribution through thick-ness were analyzed by energy dispersive analysis (EDA) – (EDX Oxford Instruments, Great Britain). Chemical structure was determined by IR-Fourier spectroscopy (NicoletiS50, Thermo Fisher Scientific, USA).
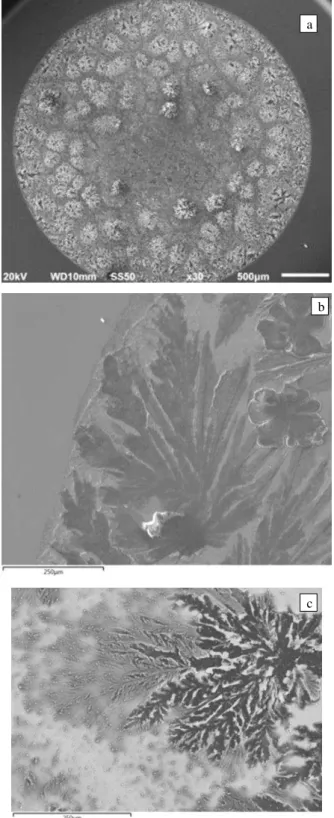
simplicity and range of applicability. To form FSs sub-strates from glass, single crystal silicon and aluminum were used. It turned out that the most contrast images were formed at a silicon substrate. Typical SEM-images of such structures from MWs of Borjomi, Essen-tuki (Caucasus) – 4 and 17 are given in Fig. 1 a-c. Similar structures were formed from MWs of Kursk region.
Fig. 1 – SEM-images of MW sediments at a silicon substrate: a – ring-formation from Borjomi FSs, b and c – fragments of FSs Essentuki 4 and 17, respectively
Table 1– Elemental analysis of FSs in sediments of different MWs with the evaluation of the degree of each element
Minerals
Elements
C O Na S Cl Ca Mg
Essentuki 4 At fractal 10 48 20 – – –
At. Wt. % 19 47 27 – 6 – 1
Essentuki 17
At fractal 17 59 75 –
At. Wt. % 20 41 26 12
Borjomi At fractal 10 41 27 –
At. Wt. % 22 48 23 5 1
Spring 1 Kursk
At fractal – 11 6 69 32 –
At. Wt. % – 43 7 3 9 3
Spring 2 Kursk
At fractal – 27 11 63 42
At. Wt. % – 48 7 4 9 3
The EDA data of chemical element distribution that form FSs are given in Fig. 2 a-b in which, as an exam-ple, an individual fragment sediment of Essentuki – 4 is shown in Fig. 1 b. Comparison of SEM-images of many-layered EDA (see Fig. 2 a) with images of their distributions for Na and Cl indicates a coincidence both in terms of the general configuration and in details of individual elements: Na, O, and C. The distribution of these elements in the central part of FSs is character-ized by uniformity. At the same time, the elemental distribution for Na occurs, which repeats only external contour of FSs. This feature is typical of all other sedi-ments studied, in which chlorides and carbonates are well representative. Fig. 2 c shows SEM-images of both the whole studied FS (transverse size 211 m) and the detailed image of its edge fragment with the size of 8.6 m (insert). It should be noted that the elemental analysis data indicate the absence of Cl just in this part. Image in Fig. 2c on morphological structure has whiskers (crystals) [10].
Fig. 2 – Elemental distribution in FS on MWs sediments Es-sentuki – 4: a – general view of elements (Mg, Cl, Si, Na, O, C), b – for Na, c – SEM-image of FS and its enlarged by 15 103 times edge fragment
a
b
c
a b
Table 2– Chemical composition of FS according to EDA data dependent on the accelerating voltage value, kV. The denomi-nator shows predicted radius of electron penetration, m
Voltage, kV
Atomic weight, % / predicted penetration radi-us, µm
C O Na Mg Cl
2 46.3/0.02 26/59.7 25.9/0.06 1.9/0.04 – /0.02 3 26/0.04 36/117.5 37/0.12 1.5/0.07 – /0.04 5 21.7/0.1 34.6/276 29.3/0.28 0.8/0.16 13.6/0.09 10 20.5/0.33 41.4/878 28.1/0.9 0.6/0.52 6.4/0.29 20 21.8/1.04 45.8/2794 26.2/2.87 0.6/1.66 5.6/0.9 EDA made it possible, at various accelerating volt-ages (2, 4, 5, 10, and 20 kV) when the penetration depth of the electron beam is varied, to determine the content of chemical elements at different levels from surface in all FS studied (Table 2). The variation in content of individual elements with depth can be indic-ative of their 3D distribution in FS sediments. For ex-ample, content of C and Mg continues to be constant starting from 5 kV, whereas at this voltage Cl only be-gins to be detected, which is clear proof that Cl sets in the low part of FS.
Analysis of images of FS formations obtained with dig-ital holographic microscope also points to their tridimen-sionality. Given in Fig. 3 a is a reversed image of 3D-image of such structure and its profile along one brunch of FS: from the center to the edge with height difference within the range from – 50 to – 370 nm. As is seen from Fig. 3 b the height variation of FS is of stepwise character. The heights determined from the figure at different levels of FS with respect to the substrate are given in Table 3. The FS thickness from the top level (– 370 nm) monoton-ically decreases taking on values 303, 285, 165, and 137 nm. This series of values is approximated with the expression h –0.12r2 + 1.09r –0.1, where r is the
dis-tance from the FS center. Tridimensionality of FS is also supported by the data of SEM-images (see Fig. 3 c) from which it follows that the maximum height difference val-ue of the sediment is on the order of 40 m.
Fig. 3 – Image of one fractal from the sediment of Essentuki-4: a – 3D-image, b – it’s profile, c – 3D-SEM-image
Table 3– Variation of FS height above the level of the silicon substrate (see Fig. 3 b)
Kind of mineral water
The height and number of levels above the substrate fractal Si (h), m
0-1 0-2 0-3 0-4
Essentuki-4 0.135 0.44 0.725 0.89
Essentuki-17 1.3 2.2 2.8 3.2
Borzhomy 1.2 2.2 2.8 3
As is seen from Fig. 3 b to this distribution of com-pounds of Cl and Na (specifically, sodium bicarbonate) there corresponds the low step (– 70 nm in the reversed image). This fact is in reasonably good accord with SEM-data (see Fig. 2 c, insert) according to which com-pounds of NAHCO3-type are detected just at the edges
of FS. It can be proposed that the following steps corre-spond to the chemical compounds with lower molecular mass that contain Mg, Na, etc., that are the compo-nents of all studied sediments of MWs.
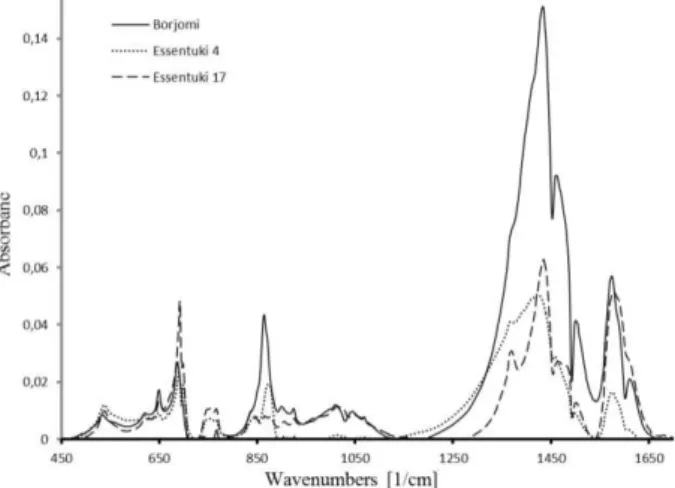
Fig. 4 – IR-spectra of FS in MW sediments
For all MWs in the fundamental range of the IR-absorption spectrum IR-absorption at lines 3397 and 1640 cm– 1 occurred. For the determination of chemical
structures that form FS because of the material under study was small in both size and amount only IR-Fourier spectroscopy was found applicable. IR analysis spectra obtained for MW sediments with FS beginning from the edge of the middle range 450 cm– 1 and up to
1700 cm– 1 are shown in Fig. 4, and appearing
absorp-tion lines and their identificaabsorp-tion are given in Table 4.
a
b
Table 4 –IR spectra of MW sediments
Compound
Absorption lines (cm–1)
Borzhomy Essentuki-4
Essentuki-17 H2O4S 1610
H3BO33 –,
Cl–
1574 1575 1578
1500 1498 1501
1460 1457 1466
1434 1435
1424
NO3 – 1367 1370
BO33 –,
SiO44 –,
1068
1044 1047
1010 1014
924 925
905 899
SO42 – 872 877
CO32 – 863 865
Cl– 847
CO32 –,
NO3 –
838
BO33 –,
SiO44 –
765 766
754 754
700
690 691
648 648 649
SO42 –
620 620 620
595 SiO44 –,
SO42 –
534 538 538
3. RESULTS AND DISCUSSION
It should be stressed that FSs were formed from compounds and trace elements that are constituents of MWs in a cation or anion form (as carbonate, sulfate, and other chemical compounds – Table 4).
EDA conducted at different accelerating voltages (see Table 2) makes it possible to calculate radii of pen-etration area for the electron using empirical depend-ence that follows from the Bethe equation at Kanaya-Okayama approximation: H 0.276 AE01.67 / (Z0.88 ).
Here A and Z are atomic weight and number of chemi-cal element, E0 is the energy of incident electrons E0 eU, ρ is density. The prediction results are given in
Table 2. Numerical analysis of collision trajectories of electrons with atoms of FS studied carried out with a lot of electrons (not less than 100) by the Monte-Carlo method made it possible to determine the size of this interaction area for some compounds. In particular, for sodium bicarbonate (NaHCO3), one major sediment
component in MW Essentuki-4, calculated diameter of interaction area and penetration depth at voltages of 3, 5, 10, and 20 kV amounted to 316, 720, 2080, 8800 nm, respectively for the diameter and 240, 446, 1580, 6700 nm – for the depth. Calculated diameter of the interaction area at an accelerating voltage of 20 kV
(8,8 m) has practically coincided with the size of ob-served area with filamentary crystal formations char-acteristic of NaHCO3– 8.6 m (see Fig. 2 c, insert).
Such structure is typical of NaHCO3 [10]. As was noted,
this inference follows from the transverse profile of FS (see Fig. 3 b and Table 2). In this case, the sizes of rele-vant areas are in good agreement.
Analysis of IR spectra revealed that the spectral resolution of 1 cm– 1 is enough for studying those
mi-cro-objects since absorption lines observed in a MW drop correspond to the following vibrations: along or perpendicular to the c axis – radial vibrations of the II and asymmetric vibrations of the I type, respectively. In [11] according to IR- spectroscopy difference in fre-quencies of these vibrations (1 and 2) are found, re-spectively by 54 and 35 cm– 1 in the water layer of
about 100 m thickness. It is noted that 1 shifts to the low-frequency domain with increasing thickness of samples studied and 2, conversely, shifts to the
high-frequency domain. In our case at a typical MW thick-ness of order 250 m according to IR-spectroscopy the second type vibrations are excited, for which two sce-narios are implemented, namely, as a single connection of a water molecule with a Na cation or as a connection with the cation of two water molecules. In doing so, we also note an increase in the frequency shift between the vibrations (1 and 2) in diametrically opposed direc-tions, which supports the applicability of IR spectros-copy for studying colloidal microinclusions as in both water solutions and their sediments.
Using spectra of originating vibration excitations on FSs in MW sediments (Fig. 4) with data base [12] anionic (hydrogen carbonate –НCO3 –, sulfate – SO42 –, chloride –
Cl–) and cationic (calcium –Cа2 +, magnesium – Mg2 +,
sodium and potassium – Na +, K +) are identified (see
Ta-ble 4). Molecular masses of compounds formed from these colloidal microinclusions, in particular, NaHCO3 and
sulfates of sodium, potassium, magnesium are equal to 84, 120, 142, 174 g/mol, respectively. According to EDA data for FSs, content of Mg2 + and K + is barely detected
and hence their contributions can be neglected. From analysis of IR spectra (see Fig. 4) total intensities (the sum of all lines in IR Fourier spectra) for every colloidal microinclusion for all given chemical compounds are ICO3– 38.5 %, ISO42 – 7%, IBO3 – 6.9 %. It follows
from here that the major role at the initial stage of fractal-formation is played by exactly hydrocarbides of NaHCO3– type and chlorides Ca, Mg, Na, and K that
have most molecular mass. In other words, distribution of chemical elements and compounds across the FS height is described by an empirical dependence of the type H – 1.
Using assumptions proposed by J.K. Maxwell for studying processes in the droplet within diffusion mod-el of solvent evaporation (MW) into the atmosphere. According to them gravitational force, temperature reduction, and auto vibration can be ignored, i.e. the Marangoni effect is not considered. Indeed, in our case for MWs studied evaluations Mg LT(α)– 1 d / dT
con-ductivity of water and become dominant in dictating the quantity Mg. This means that in fractalization there are no convection phenomena.
The most important processes, which affect the droplet shape due to the evaporation of colloidal solu-tion, are hydrodynamic streams within the droplet and the interaction between the microinclusions and the substrate. All studied were conducted in the pinning mode along the contact line “water-substrate” i.e. at high wettability of the droplet with the substrate. To analyze the interparticle interactions of microinclu-sions in the solution and on the substrate we utilize conclusions from [13]. Geometry and material composi-tion (MW and colloidal microinclusions) dictates im-plementation of the fractalization scenario: water evaporation hydrodynamic stream radial distri-bution of particles. Ring-like shape of FSs in all MW sediments (see Fig.1a) supports this scenario.
Radial motions of microinclusions are described by the dissipative dynamics as Langevin’s equations mo d-ernized by workers in [13]. The existence of anion and cation microinclusions in MWs requires consideration of Coulomb interactions Fc qiqj / (40rij2), which criti-cally influences on the dynamics of motion of colloidal particles and their fractalization. In our view, consid-eration of Fc corresponds as well to experimentally
found quadratic dependence of FS height variation for different colloidal microinclusions. The final equation of motion of particles is the following:
( )
( ) ( ) ( ) 6 ( )
i
N
ij s s L L i B C
i j
dv V
m m v V
dt t
U r F r F r a v V F F
This equation includes interaction forces with the substrate – Fs(rs) –nAsexp (–ars) and with interphase
boundary “water-air” – FL(rL) 2Rfn for |rL| {h, L}
(only particles within the droplet of height h and diam-eter L are considered). Here n is an internal unitary normal to the interphase boundary“water-air”, f is the effective density of surface energy (per unit area of the contact between a particle and a solvent) of sum of the interaction forces between i-th and j-th particles if part of the potential from the well known model of Der-jaguin-Landau-Vervey-Overbik acts as a Debye-Gakkel’s function in the form U(r) (A / r)exp(–r / ), where is the Debye shielding distance for the particle, А (Ze exp(–R / )2 / (4
0(1 + R / )2) is a constant
dictated by particle characteristics. Considered also are the Stokes force of the viscous friction, 6R(vi –V), the random force of the Brownian motion of the Gauss form, FВ, and the forces due to droplet volume varia-tion, m[(∂V / ∂t) + v(∇V)].
The given equation of dynamics takes properly into account the role of Coulomb forces, which earlier were considered only in the interaction potential U(r) with consideration for . Colloidal microinclusions in MWs studied, as it follows from IR analysis, have the electri-cal charges that vary in sign and value. For example, there are anionic charges SO42 –, Cl–, and also cationic charges Cа2 +, Mg2 +, Na +, K +. The present composition
has an additional effect on the processes of radial
mo-tions of colloidal microinclusions, which are accompa-nied by neutralization of charges and their agglomera-tion (coagulaagglomera-tion). In the most general case the interac-tion potential of colloidal particles with charges Ziand Zj, radii Riand Rj with distance between them being r, according to [14] is: Uij(r) kBTZiZjupk(Ri + Rj – r)[(1 + kRi)(1 + kRj)r]– 1. At a first approximation we obtain Uij(r) kBTupk(Ri + Rj – r) / r, where k (8BC)1/2, and B – the Bjerrum length, which equals 0.7 nm for H2O at normal conditions.
Extrapola-tion of dependence Uij(r) at the initial and final sites makes it possible to find characteristic distances: rmin
and rmax from the droplet center that determine the
range for the given system from particles with the max-imum and minmax-imum radii: rminRmax, and rmaxRmin, where the scenario of stable fractal- formation should be implemented.
Fig. 5 – a – AFM images of the FS fragment and its part (2 2 m), b – transverse profile of FS along the line “1”
Under isothermal conditions for heterophase colloi-dal systems the rate of FS formation essentially de-pends on quantities R and E. In accordance with Stokes-Einstein’s formula D kBT / (6R), the value of
the diffusion coefficient of particles in a solution is in-versely dependent on their size. This means that large particles are not capable of traveling long distances and are obviously the first to precipitate, other things being equal. Of note is the fact that the rate of particle agglomeration is determined by the Fouks formula: ∂n / ∂t– 8RDn2 exp(–E / kBT). Here n is
concentra-tion of non-agglomerated particles, D is the diffusion coefficient of particle in a solution, E is the height of energy agglomeration barrier, T is the solution tem-perature. Virtually, the Fouks formula dictates the rate of particle unification with the FS formation, which is reduced with increase in E, diffusion layer thickness, and also with reduce in the dropt radius.
Agglomera-a
tion indicates both higher rate of this process for larger particles (radii Rior Rj), and the existence of differing in height potential barriers (E), which is indirectly supported by a stepwise nature of FS (see Fig. 3 b and Table 3). In doing so, the droplet height is of critical importance. Obviously, as soon as the droplet becomes the size of large particles, their diffusion motion either turns difficult or stops at all, which corresponds to the low limit of the fractalization range. Similarly with further evaporation, when the droplet height reaches the minimum particle size their diffusion translations also become impossible.
Thus, there is reason to believe that 3D fractalization occurs if the following equalities are fulfilled: rminRmax hmax and rmaxR min hmin. This conclusion
is supported by AFM images presented in Fig. 5 a and insert with shown AFM images: of the whole FS frag-ment in the field 21 21 m and its part – 2 2 m. Here shown is the profile of AFM image with cross-section of one branch of FS along the line “1”. Measuring accuracy across profile cross-section along Z-coordinate
was not greater than 40 pm. The profile of cross-section has three areas differing in height. Two extreme ones are virtually coincide whereas the middle is elevated by nearly 50 nm. It should be noted that this area is formed from nanoparticles the size of 100 nm, as is seen from insert to Fig. 5 a. Here the height differential at different FS components coincided with its measurement (see Fig. 3 b and Table 3) according to which it was deter-mined with an accuracy of order 1 nm, typical of utilized holographic microscope.
4. CONCLUSIONS
The results obtained in nano-scale investigations of self-organization and self-assemblage processes of col-loidal microinclusions observed in mineral water sedi-ments, and deduced conditions for their fractalization are of great practical importance for both modeling these phenomena and design, on their basis, of novel nanostructured materials and components, including the field of electronics.
REFERENCES
1. Wei Lu, Ann Marie Sastry, IEEE T. Semiconduct. M. 20 No 4, 421 (2007).
2. R.P. Seisyan, Tech. Phys. 56 No 8, 1061 (2011).
3. G.B. Sergeyev, Chem. J. Russ. 46 No 5, 22 (2002) [In Rus-sian].
4. S.A. Beznosyuk, Ya.V. Lerkh, T.M. Zhukovskaya, Polzunovsky Vestnic No 4-1, 143(2005) [In Russian]. 5. Tauc-Quyen Nguyen, Richard Martel, Mark Bushey, et al.,
Phys. Chem. Chem. Phys. 9, 1515 (2007).
6. A.G. Marin, Hanneke Gelderblom, Arturo Susarrey-Arce, et al., PANS 109 No 41, 16455 (2012).
7. F. Mizade, Tech. Phys. 51 No 9, 1183 (2006).
8. A.P. Kuzmenko, V.V. Chakov, Chan Nen Aung, Nauzn. Vedomosti of Belgorod State University. Series: Mathemat-ics. Physics154 No 11, 174 (2013) [in Russian].
9. A.P Kuzmenko, V.V. Chakov, Chan Nyein Aung, M.B. Dobromyslov, J. Nano- Electron. Phys. 5 No 4, 04019 (2013).
10.A.A. Mohammad, Ali Morsali, Nanocrystal. – ISBN 978-953-307-199. 237 (2011).
11.J. Fukuda, K. Shinoda, Phys. Chem. Mineral. 35, 347 (2008).
12.Database of IR spectroscopy:
http://sdbs.db.aist.go.jp/sdbs/cgi-bin/direct_frame_top.cgi. 13.L.V. Andreeva, A.V. Koshkin, P.V. Lebedev-Stepanov,
A.N. Petrov, M.V. Alfimov, Colloid. Surface. A: Phys.-Chem. Eng. Aspects 300, 300 (2007).