TCD
9, 5053–5095, 2015Asyntheticice core
approach to estimate ion relocation in an
ice field site
C. P. Vega et al.
Title Page
Abstract Introduction
Conclusions References
Tables Figures
◭ ◮
◭ ◮
Back Close
Full Screen / Esc
Printer-friendly Version
Interactive Discussion
Discussion
P
a
per
|
Discussion
P
a
per
|
Discussion
P
a
per
|
Discussion
P
a
per
|
The Cryosphere Discuss., 9, 5053–5095, 2015 www.the-cryosphere-discuss.net/9/5053/2015/ doi:10.5194/tcd-9-5053-2015
© Author(s) 2015. CC Attribution 3.0 License.
This discussion paper is/has been under review for the journal The Cryosphere (TC). Please refer to the corresponding final paper in TC if available.
A
synthetic
ice core approach to estimate
ion relocation in an ice field site
experiencing periodical melt; a case
study on Lomonosovfonna, Svalbard
C. P. Vega1, V. A. Pohjola1, E. Beaudon2,a, B. Claremar1, W. J. J. van Pelt1, R. Pettersson1, E. Isaksson3, T. Martma4, M. Schwikowski5, and C. E. Bøggild6,b
1
Department of Earth Sciences, Uppsala University, Villavägen 16, 75236 Uppsala, Sweden 2
Arctic Centre, University of Lapland, 96101 Rovaniemi, Finland 3
Norwegian Polar Institute, Fram Centre, 9296 Tromsø Norway 4
Institute of Geology, Tallinn University of Technology, Tallinn, Estonia 5
Paul Scherrer Institut, 5232 Villigen PSI, Switzerland 6
The University Centre in Svalbard, UNIS, Pb. 156 9171, Longyearbyen, Norway a
now at: Byrd Polar and Climate Research Center, 082A Scott Hall, 1090 Carmack Road, Columbus, OH 43210-1002, USA
b
TCD
9, 5053–5095, 2015Asyntheticice core
approach to estimate ion relocation in an
ice field site
C. P. Vega et al.
Title Page
Abstract Introduction
Conclusions References
Tables Figures
◭ ◮
◭ ◮
Back Close
Full Screen / Esc
Printer-friendly Version
Interactive Discussion
Discussion
P
a
per
|
Discussion
P
a
per
|
Discussion
P
a
per
|
Discussion
P
a
per
Received: 12 August 2015 – Accepted: 7 September 2015 – Published: 29 September 2015
Correspondence to: C. P. Vega ([email protected])
TCD
9, 5053–5095, 2015Asyntheticice core
approach to estimate ion relocation in an
ice field site
C. P. Vega et al.
Title Page
Abstract Introduction
Conclusions References
Tables Figures
◭ ◮
◭ ◮
Back Close
Full Screen / Esc
Printer-friendly Version
Interactive Discussion
Discussion
P
a
per
|
Discussion
P
a
per
|
Discussion
P
a
per
|
Discussion
P
a
per
|
Abstract
Physical and chemical properties of four different ice cores (LF-97, LF-08, LF-09 and LF-11) drilled at Lomonosovfonna, Svalbard, were compared to investigate the effects of meltwater percolation on the chemical and physical stratigraphy of these records. A synthetic ice core approach was employed as reference record to estimate the
5
ionic relocation and meltwater percolation length at this site during the period 2007– 2010. Using this method, the ion elution sequence obtained for Lomonosovfonna was SO24−>NO−3>NH+4>Mg2+>Cl−, K+>Na+>Ca2+, with acidic ions being the most mobile within the snowpack. The relocation length of most of the ions was in the order of 1 m, with the exception of SO24− showing relocation lengths>2 m during this period.
10
In addition, by using both a positive degree day (PDD) and a snow-energy model ap-proaches to estimate the percentage of melt at Lomonosovfonna, we have calculated a melt percentage (MP) of the total annual accumulation within the range between 48 and 70 %, for the period between 2007 and 2010 which is above the MP range sug-gested by the ion relocation evidenced in the LF-syn core (i.e. MP=30 %). Using a
15
firn-densification model to constrain the melt range, a MP of 30 % was found over the same period which is consistent with the results of the synthetic ice core approach, and a 45 % of melt for the last 60 years. Considering the ionic relocation lengths and annual melt percentages, we estimate that the atmospheric ionic signal remains preserved in recently drilled Lomonosovfonna ice cores at an annual or bi-annual resolution.
20
1 Introduction
Pollutants produced in low- and mid-latitudes are transported to the polar regions where they are included in the snow by different mechanisms, mainly wet and dry deposition, accumulating in glaciers and ice caps. Major ions, such as SO24−, NO−3, Na+, and Cl−, are deposited in the snowpack and can be measured in ice cores,
pro-25
atmo-TCD
9, 5053–5095, 2015Asyntheticice core
approach to estimate ion relocation in an
ice field site
C. P. Vega et al.
Title Page
Abstract Introduction
Conclusions References
Tables Figures
◭ ◮
◭ ◮
Back Close
Full Screen / Esc
Printer-friendly Version
Interactive Discussion
Discussion
P
a
per
|
Discussion
P
a
per
|
Discussion
P
a
per
|
Discussion
P
a
per
sphere, and transport patterns to the sampling site (Laj et al., 1992; Goto-Azuma and Koerner, 2001; Kekonen et al., 2002; Hastings et al., 2004, 2009). Nitrate (NO−3), for example, has been used as a record for past atmospheric nitrogen oxides (NOx=NO2+NO) (Kekonen et al., 2002; Röthlisberger et al., 2002; Hastings et al., 2005, 2009; Vega et al., 2015b). However, this proxy has been difficult to develop since
5
NO−3 in snow has several sources and experiences post-depositional processes, such as photolysis, diffusion within the ice, evaporation as HNO3, or relocation by meltwa-ter (Goto-Azuma et al., 1994; Honrath et al., 1999; Rempel et al., 2002; Röthlisberger et al., 2002). The latter has been an enigma to potential ice core sites since relocation and preferential elution of chemical species gives an altitudinal and latitudinal
thresh-10
old for potential drilling sites. To make use of environmental data from outside the dry snow zones on glaciers in the polar areas, it is important to give better regional cov-erage of the atmospheric chemistry outside the large polar ice sheets. For a correct interpretation of the chemical ice core data from drilling sites where significant summer melting occurs, it is necessary to estimate the post-depositional effects of meltwater
15
percolation on the chemical content of snow and ice.
It is known that most of the ice core drilling sites at Svalbard experience summer melting, which may damp the chemical signal of ionic species, making difficult to under-stand the transfer function between ion concentrations in the atmosphere and the snow (Goto-Azuma et al., 1994; Isaksson et al., 2001; Moore et al., 2005; Grinsted et al.,
20
2006). Ions do not move uniformly when are removed from the snowpack by meltwater. Instead, they are released following a preferential elution (Goto-Azuma et al., 1994; Eichler et al., 2001; Ginot et al., 2010). The elution of ions is a consequence of se-quential grain-scale processes during dry metamorphism (Brimblecombe et al., 1985; Schöndorf and Herrmann, 1987; Goto-Azuma et al., 1994) and also influenced by the
25
TCD
9, 5053–5095, 2015Asyntheticice core
approach to estimate ion relocation in an
ice field site
C. P. Vega et al.
Title Page
Abstract Introduction
Conclusions References
Tables Figures
◭ ◮
◭ ◮
Back Close
Full Screen / Esc
Printer-friendly Version
Interactive Discussion
Discussion
P
a
per
|
Discussion
P
a
per
|
Discussion
P
a
per
|
Discussion
P
a
per
|
K+ being eluted later. The elution sequence changed slightly in ice, where NO−3 is the most mobile specie and Mg2+ the latest ion to elute. Moore and Grinsted (2009), Ginot et al. (2010) and Eichler et al. (2001) results point to the ionic charge as the control factor in the elution process instead of the acidic character of the ion as reported by Brimblecombe et al. (1985) and Goto-Azuma et al. (1994).
5
The special characteristics of snow and firn properties on high altitude ice fields with heterogeneous stratigraphy as Lomonosovfonna are a consequence of the long winter season with air temperatures below the freezing point, enhanced snow drift by strong winds, relatively low annual snow accumulation and cold ground surfaces, punctuated by intermittent melt events. The interaction between the meltwater front formed during
10
episodic melt events and the different stratigraphic horizons form preferential flow pat-terns and create a secondary stratigraphy if refreezing takes place within colder layers (Colbeck, 1991). The secondary stratigraphy produced by refreezing water will have a large influence in meltwater flow and discharge (Bøggild, 2000). During the intermit-tent melt periods, dislocation of water from more superficial layers percolates into the
15
deeper stratigraphy routed as preferential meltwater flow and the formation of solute enriched ice layers during refreeze of the percolated water will affect the chemistry (i.e. ionic concentrations in this study) recorded in ice cores drilled at the high altitude ice fields of Svalbard.
One estimate to measure if snow melting and percolation have occurred in an ice
20
core stratigraphy is to construct an ion ratio, based on the selection of a pair of ions that originate from the same source but have dissimilar elution coefficients, e.g. Na+/Mg2+ and Cl−/K+ as reported by Iizuka et al. (2002) and Grinsted et al. (2006). Using the logarithms of the different ionic ratios as melt indices, denoted as WNaMg or WClK de-pending upon the pair of ions selected, a reconstruction of the melting history of a
par-25
TCD
9, 5053–5095, 2015Asyntheticice core
approach to estimate ion relocation in an
ice field site
C. P. Vega et al.
Title Page
Abstract Introduction
Conclusions References
Tables Figures
◭ ◮
◭ ◮
Back Close
Full Screen / Esc
Printer-friendly Version
Interactive Discussion
Discussion
P
a
per
|
Discussion
P
a
per
|
Discussion
P
a
per
|
Discussion
P
a
per
SO24−, which presented∼50 % higher concentrations in ice compared with firn layers. On the other hand, NH+4 presented an even distribution between firn and ice. A perco-lation mechanism was proposed to have an important role in the redistribution of this specie in the ice crystals after deposition. Pohjola et al. (2002) concluded that although some ions may have had a high mobility within the upper part of the LF-97 ice core (0–
5
36 m deep) during anomalously warm summers, the signal was still identifiable, being retained within an annual or biannual resolution.
The aim of this work is to study the temporal change of the snow/firn chemical and physical stratigraphy on the ice field Lomonosovfonna, Svalbard. In this study we will use data from shallow ice cores and snow pits repeatedly studied in 2008, 2009, 2010
10
and 2011 at Lomonosovfonna to investigate the temporal and vertical change in the stratigraphy and ion composition of the snow/firn column. To manage the sequential change in ion concentrations we will create a synthetic ice core using the top layer (∼1 year accumulation) of different shallow ice cores and snowpits to have a reference record to assess the relocation of major ions by meltwater and the percolation length at
15
the site during recent years. In addition, the melt percentage of the annual accumula-tion at Lomonosovfonna is obtained by using a positive degree day and a snow-energy model approach, and used together with thesyntheticcore to infer the effects of melt-water on the ionic signals present in recent ice cores drilled at Lomonosovfonna.
2 Methods
20
2.1 Study sites
Four ice cores (97, 08, 09 and 11) and a 1.50 m deep snowpit (SP LF-10) were considered in this study, all retrieved at the Lomonosovfonna ice cap, which is one of the highest glaciated areas in Svalbard with an elevation of ∼1250 m a.s.l. (Isaksson et al., 2001; Beaudon, 2012; Vega et al., 2015b) (Fig. 1). Lomonosovfonna
25
TCD
9, 5053–5095, 2015Asyntheticice core
approach to estimate ion relocation in an
ice field site
C. P. Vega et al.
Title Page
Abstract Introduction
Conclusions References
Tables Figures
◭ ◮
◭ ◮
Back Close
Full Screen / Esc
Printer-friendly Version
Interactive Discussion
Discussion
P
a
per
|
Discussion
P
a
per
|
Discussion
P
a
per
|
Discussion
P
a
per
|
Pyramiden, a smaller settlement where coal mining activities were carried out until 1998. Two of the ice cores (LF-97 and LF-08) were drilled at the highest point of the ice cap ca. 100 m apart from each other, while the LF-09 and LF-11 ice cores were drilled ca. 4.5 km east-south-east from the site cored in 1997 and 2008 (Fig. 1, Table 1).
2.2 Sampling and analyses
5
The cutting, sampling and chemical analyzes of the LF-97 and LF-08 ice cores are reported by Kekonen et al. (2005) and references therein and Beaudon (2012), re-spectively. The LF-09 and LF-11 ice core cutting and SP LF-10 sampling were done in clean conditions, wearing clean overalls, face masks and powder free gloves. All materials employed to collect the samples were rinsed with ultra-pure water (18 MΩ)
10
and kept in clean plastic bags. Samples and standards were melted and handled un-der laminar flow hood (class 100) to minimize any contamination from the laboratory environment. Samples and standards were placed in the auto-sampler covered with aluminium foil to avoid any dust contamination. Three sample blanks (made of ultra-pure water) were analysed at the beginning and the end of every batch. Sample checks
15
(bulk-snow from Ny-Ålesund or Uppsala) were analysed every ten samples to ensure the replicability of the measurements within a batch. The analytical error was below 5 % for each ion. Detection limits (D.L.) for each ion were calculated as the average value of six blanks plus 1.68 times the standard deviation (σ) of the six measurements (i.e. D.L.=averageblank+1.68×σblank), being below 0.3 µeq L−1for all ions.
20
Water stable isotopes (δ18O−H2O) were analysed at the Institute of Geology at Tallinn Technical University, Estonia. The measurements were done with a Picarro L2120-i water isotope analyser (cavity ringdown spectroscopy technology) with a high precision vaporizer A0211. All isotope measurements were calibrated in a two-point scale against the international standards VSMOW (Vienna Standard Mean Ocean
Wa-25
TCD
9, 5053–5095, 2015Asyntheticice core
approach to estimate ion relocation in an
ice field site
C. P. Vega et al.
Title Page
Abstract Introduction
Conclusions References
Tables Figures
◭ ◮
◭ ◮
Back Close
Full Screen / Esc
Printer-friendly Version
Interactive Discussion
Discussion
P
a
per
|
Discussion
P
a
per
|
Discussion
P
a
per
|
Discussion
P
a
per
The ice layer and grain size were inspected in each core section by visual examina-tion on a lighted bench located in the cold laboratory (−20◦C) at the Norwegian Polar Institute. Bulk density was calculated by scaling and measuring each ice core piece. The stratigraphic melt index was calculated as the percentage of clear ice present in the ice core (considering the ice core length in m w.e. (m water equivalent)).
5
2.3 Synthetic ice core construction
In order to estimate the effects of meltwater percolation on the chemical record at Lomonosovfonna, a synthetic ice core approach was implemented. This consists in building an unperturbed ice core using only the top meter snowpack record from diff er-ent ice cores (top meters of the LF-08 and LF-09 cores corresponding to approx. 3/4
10
of the year previous to the drilling date) and the SP LF-10 snowpit, thus, constructing a snow-firn record covering over early spring, previous winter and fall of each year of the period 2007–2010 (Table 2).
2.4 Calculation of the meltwater
In order to quantify the meltwater produced at Lomonosovfonna, two independent
ap-15
proaches were used: a simple positive degree day (PDD) model using instrumental temperature data from stations near Lomonosovfonna; and a coupled snow-energy balance model (van Pelt et al., 2012) that delivers snowmelt as output.
2.4.1 PDD model
We considered temperature instrumental data from three different sites in Svalbard:
20
TCD
9, 5053–5095, 2015Asyntheticice core
approach to estimate ion relocation in an
ice field site
C. P. Vega et al.
Title Page
Abstract Introduction
Conclusions References
Tables Figures
◭ ◮
◭ ◮
Back Close
Full Screen / Esc
Printer-friendly Version
Interactive Discussion
Discussion
P
a
per
|
Discussion
P
a
per
|
Discussion
P
a
per
|
Discussion
P
a
per
|
(i.e. average value of daily temperatures from the three stations), during the period be-tween 1989–2010. The meltwater production was calculated as described by Pohjola et al. (2002), using the melt capacity of snow as function of the PDD at Lomonosov-fonna, considering the degree day factor (DDF) as 3.0 mm water◦C−1day−1 found at Svalbard after calibration against stake measurements (Nuth et al., 2012). In a recent
5
study by Claremar (2013), that employs Polar Weather Research and Forecast (Polar WRF, Skamarock et al., 2008; Wilson et al., 2011) modelled temperatures, a value for DDF of 25 mm◦C−1day−1of water was found at Lomonosovfonna. However, this DDF value has proven to be too high due to the poor modelling of the net mass balance at Lomonosovfonna when using polar WRF temperatures and snow accumulation rates
10
for the last decades (Claremar, 2013). Consequentlty, to calculate the meltwater we employed the DDF value proposed by Nuth et al. (2012) which is more realistic for Lomonosovfonna.
2.4.2 Coupled snow-energy balance model
The coupled model was developed to simulate the surface energy balance and
sub-15
surface conditions, in order to predict melt, refreezing and runoffat Nordenskiöldbreen, Svalbard and it is described by van Pelt et al. (2012, 2014). The meltwater refreezing output of the grid point located at 1200 m a.s.l. was used in this study to account for melting at the Lomonosovfonna ice core site. At this elevation runoff does not occur; which implies that all the available water at the surface (from melt and rain) refreezes
20
within the snow/firn pack.
3 Results and discussion
3.1 Dating of the ice cores
The LF-97 ice core has been dated by different methods (e.g. radioactive horizons, δ18O−H2O cycles counting, volcanic horizons) having a time scale that covers the
TCD
9, 5053–5095, 2015Asyntheticice core
approach to estimate ion relocation in an
ice field site
C. P. Vega et al.
Title Page
Abstract Introduction
Conclusions References
Tables Figures
◭ ◮
◭ ◮
Back Close
Full Screen / Esc
Printer-friendly Version
Interactive Discussion
Discussion
P
a
per
|
Discussion
P
a
per
|
Discussion
P
a
per
|
Discussion
P
a
per
past 800 years (Isaksson et al., 2001; Pohjola et al., 2002). An updated time scale for this ice core has been recently published by Divine et al. (2011).
During the 2009 drilling campaign at Lomonosovfonna, two parallel ice cores were drilled: the LF-09 (36 m deep, this study) and a longer core LF-09deep(149.5 m deep) (Wendl et al., 2015). Tritium (3H) measurements done in the LF-09deep ice core
esti-5
mate the 19633H horizon (Pinglot et al., 1999) at 23.6 m w.e., with a resulting accumu-lation rate of 0.51 m yr−1w.e. between the3H radioactive horizon and the top of the ice core (Wendl et al., 2015). In addition, the high resolution chemical data available for the LF-09 ice core (samples taken each 8 cm) allowed the use of a multilinear regression method (MLR) developed by Moore et al. (2012) to account for volcanic layers in the
10
non-sea salt sulfate concentrations. A detailed description on the usage of the MLR method on the dating of the LF-09 ice core can be found in Vega et al. (2015b). In ad-dition to the MLR method, an automatedδ18O−H2O cycles counting routine was used in the dating. This method counted δ18O−H2O annual cycles that had an amplitude A >0.1 ‰ (δ18O uncertainty in the SMOW scale) and a frequency in the sub-annual
15
cycle (λseas) larger than 1/3 the accumulation rate (Pohjola et al., 2002). Using both methods, the time scale for the LF-09 core was estimated to span between 1957–2009 (Vega et al., 2015b).
The LF-08 and LF-11 ice cores were dated using the automatedδ18O−H2O annual cycles counting routine and by comparing the Cl− record with the respective LF-09 ice
20
core profile. The time scales for the cores were estimated to cover the 1989–2008 and 2004–2011 periods for the LF-08 and LF-11 (Vega et al., 2015a) ice cores, respectively. The time scale of the SP LF-10 snowpit was obtained by assuming a constant snow accumulation rate over the depth-scale, resulting in a time coverage between 2009.4– 2010.4.
TCD
9, 5053–5095, 2015Asyntheticice core
approach to estimate ion relocation in an
ice field site
C. P. Vega et al.
Title Page
Abstract Introduction
Conclusions References
Tables Figures
◭ ◮
◭ ◮
Back Close
Full Screen / Esc
Printer-friendly Version
Interactive Discussion
Discussion
P
a
per
|
Discussion
P
a
per
|
Discussion
P
a
per
|
Discussion
P
a
per
|
3.2 Major ions
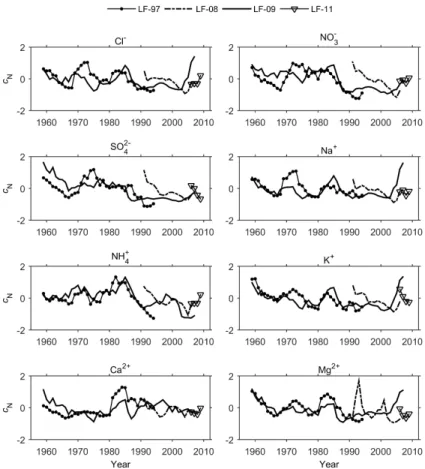
All the ionic concentrations were binned to annual averages to obtain equally spaced time series of one year resolution, which can be compared in between the different ice cores. Having all the chemical species as annual averages, their concentrations (ci) were normalized to the mean value for each specie in each ice core record, during
5
the total overlapping period (1957–2009) to compare the variations of the ions in the different ice cores (Eq. 1).
cN=
ci−cmean
σ , (1)
wherecN is the normalized concentration of a given ion,cmean is the ion mean in the specific ice core or strata, andσis the standard deviation of the series.
10
When comparing the annual average concentrations between the different ice cores, some of the peaks show a lag between the different records which likely is associated to the uncertainty on the dating of the three different ice cores. We applied a 5 year moving average smoothing to the annual chemical data (Fig. 2). The dating error of the LF-08 and LF-09, in respect to the LF-97 ice core, was estimated as ±2 years. We found
15
that similar temporal variations experienced by the different ions were registered in the different Lomonosovfonna ice cores during the overlapping period studied (Fig. 2).
Table 3 shows the PearsonR values between the different species in the LF-97 and LF-09 ice cores and the LF-09 and LF-09 ice cores, smoothed out with 5 year moving averages. The R values between the LF-97 and LF-08 ice cores were not calculated
20
since the overlapping period using 5 year moving average was too short. TheRvalues in Table 3 suggest that the LF-97 and LF-09 ice cores have comparable records for all ions. However, the correlation coefficients measured in the LF-08 and LF-09 ice cores are not significant at the 95 % confidence interval (with the exception of Mg2+, R=−0.53).
TCD
9, 5053–5095, 2015Asyntheticice core
approach to estimate ion relocation in an
ice field site
C. P. Vega et al.
Title Page
Abstract Introduction
Conclusions References
Tables Figures
◭ ◮
◭ ◮
Back Close
Full Screen / Esc
Printer-friendly Version
Interactive Discussion
Discussion
P
a
per
|
Discussion
P
a
per
|
Discussion
P
a
per
|
Discussion
P
a
per
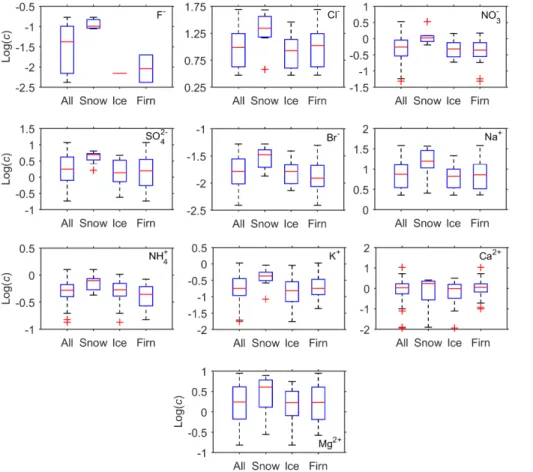
3.3 Ionic distribution in the snowpack
In order to investigate to what degree ions are eluted from the snowpack when melt-water percolates, we first compared the log-transformed concentrations (log(c)) of the different species measured in the LF-09 and LF-11 ice cores at different snowpack fa-cies: i.e. snow, ice, and firn. The chemical record of the LF-09 ice core was considered
5
only during the period 2004–2009 when it overlaps with the LF-11 ice core.
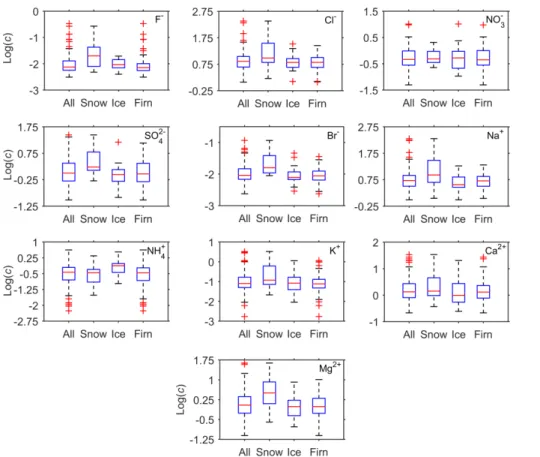
Figure 3 shows that log(c) of ions in the LF-09 ice core is higher in the snow com-pared to ice and firn for all species. Moreover, concentrations show similar means in firn and ice. On the other hand, Fig. 4 shows that ion concentrations in the LF-11 ice core are higher in the snow compared to ice and firn for most of the ions, with the
10
exception of NO−3 and NH+4. NO−3 presents even concentrations in all the strata, while NH+4 shows a higher mean concentration in ice compared to firn and snow.
Previous work by Pohjola et al. (2002) focused on the effect of periodic melting in the chemical record of an ice core drilled at Lomonosovfonna (LF-97) shows that the average ionic concentrations of the different ionic species were higher in the ice facies
15
than in the firn layers. We observed this only for Br− and NH+4 measured in the LF-09 ice core and F− and NH+4 measured in the LF-11 ice core. Since all ions in the LF-09 and LF-11 ice cores within the period 2004–2011 (10 m deep) are mostly distributed between the snow and firn, we infer that ions in this section of the ice cores have not been heavily relocated by meltwater percolation. Since the amount of meltwater
20
production at the summit of Lomonosovfonna is unknown for the studied years, three different approaches were used in order to estimate and relate it to ionic snowpack redistribution (see Sect. 3.5.).
In order to elucidate the evolution of meltwater production over time, the chemical melt index (WNaM), defined as log(Na+)/(Mg2+) (using ionic concentrations in µeq L−1)
25
TCD
9, 5053–5095, 2015Asyntheticice core
approach to estimate ion relocation in an
ice field site
C. P. Vega et al.
Title Page
Abstract Introduction
Conclusions References
Tables Figures
◭ ◮
◭ ◮
Back Close
Full Screen / Esc
Printer-friendly Version
Interactive Discussion
Discussion
P
a
per
|
Discussion
P
a
per
|
Discussion
P
a
per
|
Discussion
P
a
per
|
e.g. Na+/Mg2+and Cl−/K+ (Grinsted et al., 2006). PositiveWNaMgvalues indicate that melting is most probably confined to a particular time period. This is the case of the four Lomonosovfonna ice cores (Fig. 5) which show positive melt indices during the last 60 years. As observed in Fig. 5, melting at the drilling site is far from being constant; a period of particular high melt is evident during mid-1980s to mid-1990s which is
con-5
comitant with a period of relatively high number of PDDs at Lomonosovfonna. Although the above mentioned method is useful to infer melting regimes at Lomonosovfonna at large time scales (i.e. decadal to centennial), it is not suitable to infer melting at sub-, and multi-annual resolutions; therefore, thesynthetic ice core approach described in this study presents a suitable option.
10
3.4 Synthetic ice core
Assuming that snowmelt does not occur during winter, and considering that precipita-tion records of different Svalbard sites show that most of the precipitation is registered during the winter and autumn seasons (Førland et al., 2011), it is expected that the synthetic ice core (LF-syn) captures the unperturbed chemistry of the autumn-winter
15
and early spring seasons between spring 2007–2010. Figure 6 shows the annual pre-cipitation cycle at Longyearbyen airport and Ny-Ålesund stations and the prepre-cipitation amount and snow accumulation from the two stations and the LF-syn core during the period 2007–2011. Both, the meteorological and the ice core records are coherent with each other, depicting higher accumulation rates during the autumn/winter period than
20
spring/summer. Consequently, it is expected that the LF-syn ice core is representa-tive of the snow accumulation regime at Lomonosovfonna during 2007–2010. The flat accumulation observable during the winter 2010 is due to the assumption of a linear time scale when dating each snow layer of the snowpit dug out in 2010 (SP LF-10). In addition, the average annual mass loading of each ion was calculated for the period
25
TCD
9, 5053–5095, 2015Asyntheticice core
approach to estimate ion relocation in an
ice field site
C. P. Vega et al.
Title Page
Abstract Introduction
Conclusions References
Tables Figures
◭ ◮
◭ ◮
Back Close
Full Screen / Esc
Printer-friendly Version
Interactive Discussion
Discussion
P
a
per
|
Discussion
P
a
per
|
Discussion
P
a
per
|
Discussion
P
a
per
between the strata corresponding to different years. This estimate was then compared with the mass loading of the different ions corresponding to individual years in the LF-syn core (i.e. 2007–2010) which are assumed to represent cumulative autumn-winter-early spring snow accumulation unaltered by meltwater percolation or ion relocation. It was found that the 5 year LF-syn record represents between 70–200 % of the 30 year
5
average ion mass loading with NH+4 and Mg2+ located at the bottom and top percent-age boundaries, respectively, and NO−3 and SO24− representing 94 and 111 % of the average, respectively. Having in mind that the mass loading for most of the ions show increasing values since 2005 (not shown), thus, influencing the percentage of aver-age mass loading in the LF-syn core, we consider that this synthetic core is adequate
10
to investigate ion relocation during the period 2007–2011. The F-syn core was then compared with the LF-11 core to evaluate the effects of ion elution/deposition between 2007–2010 (recorded in the LF-11 ice core) compared to the unperturbed LF-syn ice core (Fig. 7). To avoid any bias caused for the snow accumulated after the spring 2010 and 2011, this period was not considered in the normalization of the LF-11 ionic
con-15
centrations. Figure 7 shows that the LF-11 record has noticeable largecNpeaks, e.g. around summer 2009, that can be associated to the increase in ionic concentrations by the relocation of ions by the refreezing of percolation water. Figure 8 shows the dif-ferences betweencN in both ice cores (LF-11−LF-syn) calculated after interpolating the records at 0.01 year time steps to homogenize the data. We considered a
reloca-20
tion peak when the differences in cN are higher than twice the standard deviation of the normalized concentrations of each ion (dashed red line in Fig. 8; the zero values are shown as a dashed black line). Positive differences indicate higher ionic concentra-tions in the LF-11 ice core with respect to the LF-syn ice core, therefore, ice-firn layers enhanced in ions due to relocation by percolation water. Negative differences indicate
25
TCD
9, 5053–5095, 2015Asyntheticice core
approach to estimate ion relocation in an
ice field site
C. P. Vega et al.
Title Page
Abstract Introduction
Conclusions References
Tables Figures
◭ ◮
◭ ◮
Back Close
Full Screen / Esc
Printer-friendly Version
Interactive Discussion
Discussion
P
a
per
|
Discussion
P
a
per
|
Discussion
P
a
per
|
Discussion
P
a
per
|
This can be interpreted as SO24− eluting steadily and further down the snowpack than the other ions during this period (Fig. 8).
We estimate a minimum ionic relocation length as the difference in depth between the maximun/minimun (deposition/elution)cNpeaks, as shown in Fig. 8 and presented in Table 4. The relocation length was calculated for all ions, with the exception of SO24−
5
which does not show an elution peak that is significant within the time window studied. For the ions that show more than one significant deposition/elution peak, the relocation length calculated considering the second maximun/minimuncNpeak is also shown in Table 4.
Considering the deposition/elution cN peaks estimated above, the ionic elution
10
scheme at Lomonosovfonna for the last 5 years results in SO24− being the most mo-bile ion and NO−3 the least mobile one. This elution scheme differs with previous stud-ies done at Lomonosovfonna (Moore and Grinsted, 2009) mainly in locating NO−3 at the end of the elution sequence. However, it should be noticed that we estimated two possible relocation lengths based in the depth difference between deposition/elution
15
peaks (as explained before). Therefore, considering a NO−3 relocation length of 1.16 m, the elution sequence agrees with previous findings by Moore and Grinsted (2009), locating the acidic ions (SO24− and NO−3) as more mobile than the others ions. The elution sequence and ion relocation lengths shown in Table 4, suggest that the less mobile ions are relocated by the meltwater at short lengths, probably trapped in thin
20
and medium-thick ice layers present within the ice column observable in the LF-97, LF-09 and LF-11 cores (Fig. 9), or in refrozen water that soaks the firn column filling the pore space. More mobile ions may percolate further down in the snowpack and get trapped in medium-thick to thick ice layer which start to form at about 3–10 m deep in the ice column as observable in the LF-97 and LF-09 cores (Fig. 9).
25
TCD
9, 5053–5095, 2015Asyntheticice core
approach to estimate ion relocation in an
ice field site
C. P. Vega et al.
Title Page
Abstract Introduction
Conclusions References
Tables Figures
◭ ◮
◭ ◮
Back Close
Full Screen / Esc
Printer-friendly Version
Interactive Discussion
Discussion
P
a
per
|
Discussion
P
a
per
|
Discussion
P
a
per
|
Discussion
P
a
per
3.5 Meltwater production at Lomonosovfonna
The produced meltwater obtained by using the PDD and snow-energy model ap-proaches are shown in Fig. 10 for the period 1979–2012 (calculated using PDD and instrumental temperatures), and 1989–2010 (using the snow-energy model). The pro-duction of meltwater at the summit of Lomonosovfonna has increased at a rate of
5
+0.0011 m yr−1w.e. toward the last decades (corresponding to the linear trend of melt-water production calculated with the PDD and instrumental temperatures approach, Fig. 10). The meltwater production shows a minimum around 1995, which is present when using both approaches (Fig. 10). The average melting between 1989–2010 was calculated as 0.17 m w.e. when using the PDD and instrumental temperature approach.
10
When considering the period between 2007–2010 (Fig. 11), the melting shows stable values with alternated warmer and colder years (2007/09, and 2008/10, respectively), with meltwater average values of 0.19 and 0.27 m w.e. when using the instrumental temperatures, and the coupled snow-energy model, respectively. Alternatively, melt-water production was also calculated by using modelled temperatures obtained with
15
the Polar WRF model at the summit of Lomonosovfonna and a DDF of 3.0 mm wa-ter◦C day−1. An average meltwater production of 0.07 and 0.05 m w.e. were obtained for the periods 1989–2010 and 2007–2010, respectively when using the Polar WRF mod-elled temperatures. The meltwater production obtained by the Polar WRF approach gives values that are significantly lower than the meltwater obtained by using both the
20
PDD and snow-energy model approaches which is a consequence of the less number of PDDs per year estimated at the summit of Lomonosovfonna when using the Polar WRF model (i.e. 18 PDDs per year between 1989–2010) explained by the fact that the Polar WRF model produces lower surface temperatures compared to the lapse-rate based temperatures at this site. Therefore, the meltwater calculated by using Polar
25
WRF modelled temperatures were not considered in this study.
TCD
9, 5053–5095, 2015Asyntheticice core
approach to estimate ion relocation in an
ice field site
C. P. Vega et al.
Title Page
Abstract Introduction
Conclusions References
Tables Figures
◭ ◮
◭ ◮
Back Close
Full Screen / Esc
Printer-friendly Version
Interactive Discussion
Discussion
P
a
per
|
Discussion
P
a
per
|
Discussion
P
a
per
|
Discussion
P
a
per
|
(Table 5) were calculated using the results in Figs. 10 and 11 and the annual accu-mulation rate between 2007–2010 at Lomonosovfonna obtained from the LF-09 and LF-11 cores. The melt percentage (MP) obtained by using the instrumental tempera-tures (48 % for the period 2007–2010) was in the order of previously reported values of 47 % of melt during the warmest years and 28 % during the coldest, during the
pe-5
riod 1976–1995 (Pohjola et al., 2002). The relatively high MP values obtained in this study for the period 2007–2010 can be explained by the increase in temperatures at the site with a consequent steady increase of the number of PDD at the summit of Lomonosovfonna at a rate of 0.4 day yr−1 for the period 1979–2012 in which instru-mental temperatures exist in all the three stations used, Sveagruva, Ny-Ålesund and
10
Longyearbyen airport; the MPs calculated using the PDD approach over the period 1979–2010 show a steady increase of 1 % yr−1in line with the trend in decreasing the annual snow accumulation in−0.01 m yr−1w.e. during the same period (accumulation data from the LF-09 ice core).
However, the calculated MPs using the PDD approach and the snow-energy do not
15
agree with the results obtained by the synthetic core approach which suggest moder-ate melting during the 2007–2010 period which is also supported by the stratigraphy observed in the LF-09 and LF-11 cores (Fig. 9).
Due to the dissimilar results of MP obtained using the PDD and snow-energy model approaches (Table 5), we compared the density profiles of the shallow ice cores used
20
in this study (LF-08, LF-09 and LF-11) with the total layer density values obtained using a simple firn-densification model (Reeh et al., 2005). The ice core density pro-files were binned in annual averages in order to be comparable with the output of the firn-densification model. As described by Reeh et al. (2005), the model requires both annual average temperatures and snow accumulation at the study site as input, which
25
pe-TCD
9, 5053–5095, 2015Asyntheticice core
approach to estimate ion relocation in an
ice field site
C. P. Vega et al.
Title Page
Abstract Introduction
Conclusions References
Tables Figures
◭ ◮
◭ ◮
Back Close
Full Screen / Esc
Printer-friendly Version
Interactive Discussion
Discussion
P
a
per
|
Discussion
P
a
per
|
Discussion
P
a
per
|
Discussion
P
a
per
riod between 2007–2010. The firn-densification model also requires the surface snow density, which was set as 350 kg m−3, and a defined spatial resolution, set as 0.5 m. The firn-densification model considers the percentage of melting as one of the input variables, showing output density values vs. depth. Output densities of 900 kg m−3are expected when the percentage of melt reaches 100 %. Four different melt scenarios
5
where considered: MP equal to (a) 20 %, (b) 30 %, (c) 45 %, and (d) 70 %. The re-sults of the comparison between the real ice core density profiles and the output of the firn-densification model are shown in Fig. 12.
According to Fig. 12, the firn-densification model shows better agreement with the measured density profiles in the top 10 m when the MP was set between 20 and 30 %.
10
This agrees with the physical melt index of the LF-09 ice core (22 %), calculated as the percentage of clear ice present in the ice core (considering the ice core length in m w.e.). However, the agreement between the firn-densification model and the density profiles is poor for depths deeper than 10 m (Fig. 12a and b) considering this range or MP. Figure 12c and d, show the comparison between the firn-densification model and
15
the density profiles using a MP of 45 and 70 %. The agreement between the model and the measurements is better through the whole depth profile when setting the MP to 45 % (Fig. 12c). This agrees with the physical melt index of the LF-97 ice core (50 %), calculated between 1957 and 1997, however, it is not consistent with the physical melt index of the LF-09 ice core (25 %), calculated for the same period.
20
Considering the results shown in Table 5 and the firn-densification model output shown in Fig. 12a–d, it is plausible to think that the MP at Lomonosovfonna is not straight forward to estimate either using a simple PDD or the snow-energy model ap-proach. Moreover, the use of Polar WRF temperatures at Lomonosovfonna as input to obtain the MP at the site is ruled out since it predicts MP values considerably lower
25
TCD
9, 5053–5095, 2015Asyntheticice core
approach to estimate ion relocation in an
ice field site
C. P. Vega et al.
Title Page
Abstract Introduction
Conclusions References
Tables Figures
◭ ◮
◭ ◮
Back Close
Full Screen / Esc
Printer-friendly Version
Interactive Discussion
Discussion
P
a
per
|
Discussion
P
a
per
|
Discussion
P
a
per
|
Discussion
P
a
per
|
index during the ice core time span. Therefore, the firn-densification model does not include the variability in meltwater production at Lomonosovfonna through time which is key to the understanding of ion relocation within the snowpack at long time scales; however, the MP estimated here are suitable to understand the ionic relocation and water percolation during the period 2007–2010.
5
Figure 13 shows a comparison between the LF-11 and the LF-syn ice core depth– time scale. It is clear from Fig. 13 that the depth differences between the ice cores (black and grey lines) can be related to a partial melting of the snowpack and re-freezing of the meltwater taking place between the 2007–2011 period, as evidenced by the ionic relocation. An estimate of the decrease in depth of the LF-syn ice core
10
by the effects of snowpack melting considering a MP=20, 30, 48 and 70 % during 2007–2010 as suggested by the firn-densification model, MPs obtained using the PDD approach (using instrumental temperatures) and the snow-energy model is shown in Fig. 13. It can be observed that a MP=20–30 % results in a LF-syn ice core depth-time scale highly similar to the depth-time scale of the LF-11 ice core during the 2007–2010
15
period, confirming that the MP during that period is coherent with the results of the firn-densification model but not with the PDD results shown in Table 5. This relatively low MP reinforces the fact that during this period, ion relocation took place at moderate depths (0.5–2 m) and that the meltwater percolation depth was most probably in the same order, with refreezing of meltwater within the snowpack pore space or by forming
20
thin ice layers (0.03–0.15 m) (Fig. 9).
4 Conclusions
By comparing different ice cores from Lomonosovfonna and using asyntheticice core approach, we have been able to estimate the elution signal and relocation length of dif-ferent ions measured at the study site, in order to assess the transfer function between
25
TCD
9, 5053–5095, 2015Asyntheticice core
approach to estimate ion relocation in an
ice field site
C. P. Vega et al.
Title Page
Abstract Introduction
Conclusions References
Tables Figures
◭ ◮
◭ ◮
Back Close
Full Screen / Esc
Printer-friendly Version
Interactive Discussion
Discussion
P
a
per
|
Discussion
P
a
per
|
Discussion
P
a
per
|
Discussion
P
a
per
Our results show good agreement between the ionic records of three different ice cores drilled during different years, using normalized concentrations and five year moving averages. Therefore, we reiterate that the different ice core records from Lomonosovfonna all share the same climatic and chemical features, despite the fact that cores have been retrieved in different years, were sampled at different resolutions,
5
and were analyzed at different laboratories. Our conclusion is that summer melting does not degrade the climatic signals.
By using the synthetic ice core approach, we could estimate an elution sequence for the summit of Lomonosovfonna, as SO24−>NO−3 >NH+4 >Mg2+>Cl−, K+>Na+> Ca2+, which agrees with previous reports. This elution sequence points towards the
10
acidic ions as being the most mobile within the Lomonosovfonna snowpack. Consid-ering the differences between the LF-11 and the LF-syn ice cores, we conclude that the relocation length of most the ions during the 2007–2010 period is in the order of 1 m, therefore, the ions are eluted and re-deposited within the annual snow layer, considering present average accumulation rate at Lomonosovfonna (i.e.<1 m of snow
15
per year). According to our results, only SO24− shows percolation lengths that could potentially reach deeper than the previous year of snow accumulation (>2 m), which affects the annual atmospheric signal and prevents any high resolution (seasonal, an-nual) analysis to be possible in Lomonosovfonna ice cores. However, as we have con-cluded before, using 5 year moving averages of the ionic data allows having
compara-20
ble records when different ice cores are used.
By using the PDD and the snow-energy model approaches to estimate the percent-age of melt (MP) at Lomonosovfonna, we have estimated averpercent-age annual MP in the range of 48 to 70 % for the period between 2007–2010, in contrast to the moderate melting suggested by the LF-syn core for the same period. In order to constrain the MP,
25
TCD
9, 5053–5095, 2015Asyntheticice core
approach to estimate ion relocation in an
ice field site
C. P. Vega et al.
Title Page
Abstract Introduction
Conclusions References
Tables Figures
◭ ◮
◭ ◮
Back Close
Full Screen / Esc
Printer-friendly Version
Interactive Discussion
Discussion
P
a
per
|
Discussion
P
a
per
|
Discussion
P
a
per
|
Discussion
P
a
per
|
percentages inferred for the 2007–2010 period compared with the whole period cov-ered by the LF-09 core are most probably a result of a combination of relatively high snow accumulation rates and reduced PDD during the 2007–2010 period despite of the warmer conditions registered during the last decades.
Considering our findings, we conclude that despite of the warmer conditions and
5
higher number of PDD registered at Lomonosovfonna during the last decades, the ionic signal affected by melting is retained within the same year of deposition for all major ions, with the exception of SO24− which can possibly be re-deposited in previous annual layers.
Acknowledgements. The authors want to thank the Lomonosovfonna 1997, 2008 and 2009
10
drilling teams and NPI field logistics for their support, C. Zdanowicz and G. Engström, Up-psala University, J. Moore, Arctic Centre, J. Zábori, Stockholm University, and S. Bejai, SLU for their comments and sharing of analytical lab facilities. This work was supported within the Marie Curie Initial Training Network NSINK ITN-2007.1.1, ENV., 215503 with complementary economic support by Ymer-80, the Arctic Fieldwork Grant by the Svalbard Science Forum,
Up-15
psala Geographical Association, Sweden, and to the EU Regional Development Foundation, project 3.2.0801.12-0044.
References
Beaudon, E.: Glaciochemical evidence of spatial and temporal environmental variability across Svalbard, Arctic Centre Reports 58, Lapland University Press, Rovaniemi, 2012.
20
Bøggild, C. E.: Preferential flow and melt water retention in cold snow packs in West-Greenland, Nord. Hydrol., 31, 287–300, 2000.
Brimblecombe, P., Tranter, M., Abrahams, P. W., Blackwood, I., Davies, T. D., and Vincent, C. E.: Relocation and preferential elution of acidic solute through the snowpack of a small, remote, high-altitude Scottish catchment, Ann. Glaciol., 7, 141–147, 1985.
25
TCD
9, 5053–5095, 2015Asyntheticice core
approach to estimate ion relocation in an
ice field site
C. P. Vega et al.
Title Page
Abstract Introduction
Conclusions References
Tables Figures
◭ ◮
◭ ◮
Back Close
Full Screen / Esc
Printer-friendly Version
Interactive Discussion
Discussion
P
a
per
|
Discussion
P
a
per
|
Discussion
P
a
per
|
Discussion
P
a
per
Claremar, B., Obleitner, F., Reijmer, C., Pohjola, V., Waxegård, A. , Karner, F., and Rutgersson, A.: Applying a mesoscale atmospheric model to Svalbard Glaciers, Adv. Meteorol., 2012, 321649, doi:10.1155/2012/321649, 2012.
Colbeck, S. C.: The layered character of snow covers, Rev. Geophys., 29, 81–96, 1991. Dee, D. P., Uppala, S. M., Simmons, A. J., Berrisford, P., Poli, P., Kobayashi, S., Andrae, U.,
5
Balmaseda, M. A., Balsamo, G., Bauer, P., Bechtold, P., Beljaars, A. C. M., van de Berg, L., Bidlot, J., Bormann, N., Delsol, C., Dragani, R., Fuentes, M., Geer, A. J., Haimberger, L., Healy, S. B., Hersbach, H., Hólm, E. V., Isaksen, L., Kållberg, P., Köhler, M., Matricardi, M., McNally, A. P., Monge-Sanz, B. M., Morcrette, J.-J., Park, B.-K. , Peubey, C., de Ros-nay, P., Tavolato, C., Thépaut, J.-N., and Vitart, F.: The ERA-Interim reanalysis: configuration
10
and performance of the data assimilation system, Q. J. Roy. Meteorol. Soc., 137, 553–597, doi:10.1002/qj.828, 2011.
Divine, D., Isaksson, E., Martma, T., Meijer, H. A. J., Moore, J., Pohjola, V., van de Wal, R. S. W., and Godtliebsen, F.: Thousand years of winter surface air temperature variations in Svalbard and northern Norway reconstructed from ice-core data, Polar Res., 30, 7379,
15
doi:10.3402/polar.v30i0.7379, 2011.
Eichler, A., Schwikowski, M., and Gäggeler, H. W.: Meltwater-induced relocation of chemical species in alpine firn, Tellus B, 53, 192–203, 2001.
Førland, E. J., Benestad, R., Hanssen-Bauer, I., Haugen, J. E., and Skaugen, T. E.: Temper-ature and precipitation development at Svalbard 1900–2100, Adv. Meteorol., 2011, 893790,
20
doi:10.1155/2011/893790, 2011.
Ginot, P., Schotterer, U., Stichler, W., Godoi, M. A., Francou, B., and Schwikowski, M.: In-fluence of the Tungurahua eruption on the ice core records of Chimborazo, Ecuador, The Cryosphere, 4, 561–568, doi:10.5194/tc-4-561-2010, 2010.
Goto-Azuma, K. and Koerner, R. M.: Ice core studies of anthropogenic sulfate and nitrate trends
25
in the Arctic, J. Geophys. Res., 106, 4959–4969, 2001.
Goto-Azuma, K., Nakawo, M., Jiankang, H., Watanabe, O., and Azuma, N.: Melt-induced re-location of ions in glaciers and in a seosanal snowpack, snow and ice covers: interactions with the atmosphere and ecosystems (Proceedings of Yokohama Symposia J2, July 1993), IAHS-AISH P., 223, 287–297, 1994.
30
TCD
9, 5053–5095, 2015Asyntheticice core
approach to estimate ion relocation in an
ice field site
C. P. Vega et al.
Title Page
Abstract Introduction
Conclusions References
Tables Figures
◭ ◮
◭ ◮
Back Close
Full Screen / Esc
Printer-friendly Version
Interactive Discussion
Discussion
P
a
per
|
Discussion
P
a
per
|
Discussion
P
a
per
|
Discussion
P
a
per
|
Hastings, M. G., Steig, E. J., and Sigman, D. M.: Seasonal variations in N and O isotopes of nitrate in snow at Summit, Greenland: implications for the study of nitrate in snow and ice cores, J. Geophys. Res., 109, D20306, doi:10.1029/2004JD004991, 2004.
Hastings, M. G., Sigman, D. M., and Steig, E. J.: Glacial/interglacial changes in the isotopes of nitrate from the Greenland Ice Sheet Project 2 (GISP2) ice core, Global Biogeochem. Cy.,
5
19, GB4024, doi:10.1029/2005GB002502, 2005.
Hastings, M. G., Jarvis, J. C., and Steig, E. J.: Anthropogenic impacts on nitrogen isotopes of ice-core nitrate, Science, 324, 1288, doi:10.1126/science.1170510, 2009.
Honrath, R. E., Peterson, M. C., Guo, S., Dibb, J. E., Shepson, P. B., and Campbell, B.: Evidence of NOx production within or upon Ice particles in the Greenland snowpack, Geophys. Res.
10
Lett., 26, 695–698, 1999.
Iizuka, Y., Igarashi, M., Kamiyama, K., Motoyama, H., and Watanabe, O.: Ratios of Mg+2/Na+in snowpack and ice core at Austfonna ice cap, Svalbard, as an indicator of seasonal melting, J. Glaciol., 48, 452–460, 2002.
Isaksson, E., Pohjola, V., Jauhiainen, T., Moore, J., Pinglot, J. F., Vaikmäe, R., van de
15
Wal, R. S. W., Hagen, J. O., Ivask, J., Karlöf, L., Martma, T., Meijer, H. A. J., Mulvaney, R., Thomassen, M., and van den Broeke, M.: A new ice-core record from Lomonosovfonna, Sval-bard: viewing the 1920–97 data in relation to present climate and environmental conditions, J. Glaciol., 47, 335–345, 2001.
Kekonen, T., Moore, J. C., Mulvaney, R., Isaksson, E., Pohjola, V., and Van De Wal, R. S. W.:
20
A 800 year record of nitrate from the Lomonosovfonna ice core, Svalbard, Ann. Glaciol., 35, 261–265, 2002.
Kekonen, T., Moore, J., Perämäki, P., Mulvaney, R., Isaksson, E., Pohjola, V., and van de Wal, R. S. W.: The 800 year long ion record from the Lomonosovfonna (Svalbard) ice core, J. Geophys. Res., 110, D07304, doi:10.1029/2004JD005223, 2005.
25
Laj, P., Palais, J. M., and Sigurdsson, H.: Changing sources of impurities to the Greenland ice-sheet over the last 250 years. Atmos. Environ., 26, 2627–2640, 1992.
Moore, J. C. and Grinsted, A.: Ion fractionation and percolation in ice cores with seasonal melting, in: Physics of Ice Core Records II, Supplement Issue of Low Temperature Science, 2nd International Workshop on Physics of Ice Core Records, 2–6 February 2007, Sapporo,
30
TCD
9, 5053–5095, 2015Asyntheticice core
approach to estimate ion relocation in an
ice field site
C. P. Vega et al.
Title Page
Abstract Introduction
Conclusions References
Tables Figures
◭ ◮
◭ ◮
Back Close
Full Screen / Esc
Printer-friendly Version
Interactive Discussion
Discussion
P
a
per
|
Discussion
P
a
per
|
Discussion
P
a
per
|
Discussion
P
a
per
Moore, J. C., Grinsted, A., Kekonen, T., and Pohjola, V.: Separation of melting and envi-ronmental signals in an ice core with seasonal melt, Geophys. Res. Lett., 32, L10501, doi:10.1029/2005GL023039, 2005.
Moore, J. C., Beaudon, E., Kang, S., Divine, D., Isaksson, E., Pohjola, V. A., and van de Wal, R. S. W.: Statistical extraction of volcanic sulphate from nonpolar ice cores, J.
Geo-5
phys. Res., 117, D03306; doi:10.1029/2011JD016592, 2012.
Morrison, H., Curry, J. A., and Khvorostyanov, V. I.: A new double-moment microphysics pa-rameterization for application in cloud and climate models, Part I: Description, J. Atmos. Sci., 62, 1665–1677, 2005.
Nakanishi, M. and Niino, H.: An improved Mellor–Yamada level-3 model: its numerical stability
10
and application to a regional prediction of advection fog, Bound-Lay. Meteorol., 119, 397– 407, 2006.
Norwegian Meteorological Institute, available at: http:/eklima.met.no/, last access: 31 July 2015.
Nuth, C., Vikhamar, Schuler, T. V., Kohler, J., Altena, B., and Hagen, J. O.: Estimating the
15
long-term claving flux of Kronebreen, Svalbard, from geodetic elevation changes and mass-balance modelling, J. Glaciol., 58, 119–133, 2012.
Pinglot, J. F., Pourchet, M., Lefauconnier, B., Hagen, J. O., Isaksson, E., Vaikmäe, R., and Kamiyama, K.: Accumulation in Svalbard glaciers deduced from ice cores with nuclear tests and Chernobyl reference layers, Polar Res., 18, 315–321, 1999.
20
Pohjola, V. A., Moore, J. C., Isaksson, E., Jauhiainen, T., van de Wal, R. S. W., Martma, T., Meijer, H. A. J., and Vaikmäe, R.: Effect of periodic melting on geochemical and iso-topic signals in an ice core from Lomonosovfonna, Svalbard, J. Geophys. Res., 107, 4036, doi:10.1029/2000JD000149, 2002.
Reeh, N., Fisher, D. A., Koerner, R. M., and Clausen, H. B.: An empirical firn-densification
25
model comprising ice lenses, Ann. Glaciol., 42, 101–106, 2005.
Rempel, A. W., Wettlaufer, J. S., and Waddington, E. D.: Anomalous diffusion of multiple impu-rity species: predicted implications for the ice core climate records, J. Geophys. Res., 107, 2330, doi:10.1029/2002JB001857, 2002.
Röthlisberger, R., Hutterli, M. A., Wolff, E. W., Mulvaney, R., Fischer, H., Bigler, M.,
Goto-30
TCD
9, 5053–5095, 2015Asyntheticice core
approach to estimate ion relocation in an
ice field site
C. P. Vega et al.
Title Page
Abstract Introduction
Conclusions References
Tables Figures
◭ ◮
◭ ◮
Back Close
Full Screen / Esc
Printer-friendly Version
Interactive Discussion
Discussion
P
a
per
|
Discussion
P
a
per
|
Discussion
P
a
per
|
Discussion
P
a
per
|
Schöndorf, T. and Herrmann, R.: Transport and chemodynamics of organic micropollutants and ions during snowmelt, Nord. Hydrol., 18, 259–278, 1987.
Skamarock, W. C., Klemp, J. B., Dudhia, J., Gill, D. O., Barker, D. M., Duda, M. G., Huang, X.-Y., Wang, W., and Powers, J. G.: A description of the advanced research WRF version 3, NCAR/TN-475+STR, NCAR Technical Notes, Mesoscale and Microscale Meteorology
Divi-5
sion, National Center for Atmospheric Research, Boulder, Colorado, USA, 2008.
van Pelt, W. J. J., Oerlemans, J., Reijmer, C. H., Pohjola, V. A., Pettersson, R., and van An-gelen, J. H.: Simulating melt, runoffand refreezing on Nordenskiöldbreen, Svalbard, using a coupled snow and energy balance model, The Cryosphere, 6, 641–659, doi:10.5194/tc-6-641-2012, 2012.
10
van Pelt, W. J. J., Pettersson, R., Pohjola, V. A., Marchenko, S., Claremar, B., and Oerlemans, J.: Inverse estimation of snow accumulation along a radar transect on Nordenskiöldbreen, Sval-bard, J. Geophys. Res.-Earth, 119, 816–835, doi:10.1002/2013JF003040, 2014.
Vega, C. P., Björkman, M. P., Pohjola, V. A., Isaksson, E., Pettersson, R., Martma, T., Marca, A. D., and Kaiser, J.: Nitrate stable isotopes and major ions in snow and ice
sam-15
ples from four Svalbard sites, Polar Res., 34, 23246, doi:10.3402/polar.v34.23246, 2015a. Vega, C. P., Pohjola, V. A., Samyn, D., Pettersson, R., Isaksson, E., Björkman, M. P., Martma, T.,
Marca, A. D, and Kaiser, J.: First ice core records of nitrate stable isotopes from Lomonosov-fonna, Svalbard, J. Geophys. Res.-Atmos., 120, 313–330, doi:10.1002/2013JD020930, 2015b.
20
Wendl, I. A., Eichler, A., Isaksson, E., Martma, T., and Schwikowski, M.: 800-year ice-core record of nitrogen deposition in Svalbard linked to ocean productivity and biogenic emissions, Atmos. Chem. Phys., 15, 7287–7300, doi:10.5194/acp-15-7287-2015, 2015.
Wilson, A. B., Bromwich, D. H., and Hines, K. M.: Evaluation of Polar WRF forecasts on the Arctic System Reanalysis domain: surface and upper air analysis, J. Geophys. Res., 116,
25
TCD
9, 5053–5095, 2015Asyntheticice core
approach to estimate ion relocation in an
ice field site
C. P. Vega et al.
Title Page
Abstract Introduction
Conclusions References
Tables Figures
◭ ◮
◭ ◮
Back Close
Full Screen / Esc
Printer-friendly Version
Interactive Discussion
Discussion
P
a
per
|
Discussion
P
a
per
|
Discussion
P
a
per
|
Discussion
P
a
per
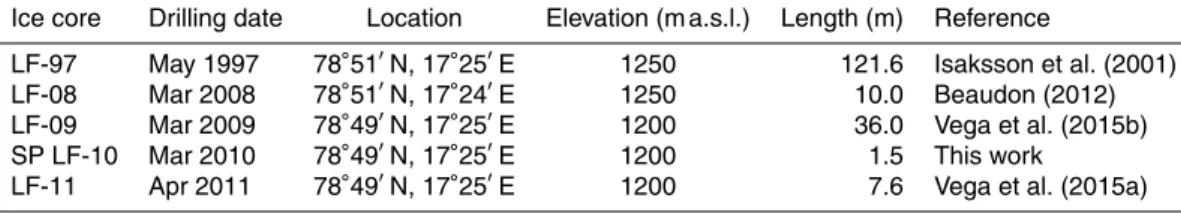
Table 1.Drilling site and ice core description for the three different cores used in this study.
Ice core Drilling date Location Elevation (m a.s.l.) Length (m) Reference
LF-97 May 1997 78◦51′N, 17◦25′E 1250 121.6 Isaksson et al. (2001) LF-08 Mar 2008 78◦51′N, 17◦24′E 1250 10.0 Beaudon (2012) LF-09 Mar 2009 78◦49′N, 17◦25′E 1200 36.0 Vega et al. (2015b) SP LF-10 Mar 2010 78◦49′N, 17◦25′E 1200 1.5 This work
TCD
9, 5053–5095, 2015Asyntheticice core
approach to estimate ion relocation in an
ice field site
C. P. Vega et al.
Title Page
Abstract Introduction
Conclusions References
Tables Figures
◭ ◮
◭ ◮
Back Close
Full Screen / Esc
Printer-friendly Version
Interactive Discussion
Discussion
P
a
per
|
Discussion
P
a
per
|
Discussion
P
a
per
|
Discussion
P
a
per
|
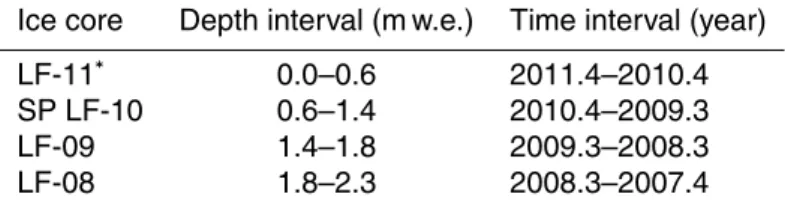
Table 2.Synthetic ice core construction using the different Lomonosovfonna shallow cores (LF-08 and LF-09) and SP LF-10 snowpit.
Ice core Depth interval (m w.e.) Time interval (year)
LF-11∗ 0.0–0.6 2011.4–2010.4
SP LF-10 0.6–1.4 2010.4–2009.3
LF-09 1.4–1.8 2009.3–2008.3
LF-08 1.8–2.3 2008.3–2007.4
∗The top meter of the LF-11 was not used to construct the synthetic ice
TCD
9, 5053–5095, 2015Asyntheticice core
approach to estimate ion relocation in an
ice field site
C. P. Vega et al.
Title Page
Abstract Introduction
Conclusions References
Tables Figures
◭ ◮
◭ ◮
Back Close
Full Screen / Esc
Printer-friendly Version
Interactive Discussion
Discussion
P
a
per
|
Discussion
P
a
per
|
Discussion
P
a
per
|
Discussion
P
a
per
Table 3. Pearson coefficients (R) at a 95 % confidence interval, between the different ions measured in the LF-97 and LF-09 ice cores (normalized concentrations and smoothed out as 5 year running averages). Significant values (p <0.05) are shown in italics. The overlapping period is 1957–1997.
LF-97 and LF-09 ice cores
Ion Cl− NO−3 SO24− Na+ NH+4 K+ Ca2+ Mg2+
R 0.46 0.64 0.56 0.49 0.77 0.66 0.36 0.72
LF-08 and LF-09 ice cores
TCD
9, 5053–5095, 2015Asyntheticice core
approach to estimate ion relocation in an
ice field site
C. P. Vega et al.
Title Page
Abstract Introduction
Conclusions References
Tables Figures
◭ ◮
◭ ◮
Back Close
Full Screen / Esc
Printer-friendly Version
Interactive Discussion
Discussion
P
a
per
|
Discussion
P
a
per
|
Discussion
P
a
per
|
Discussion
P
a
per
|
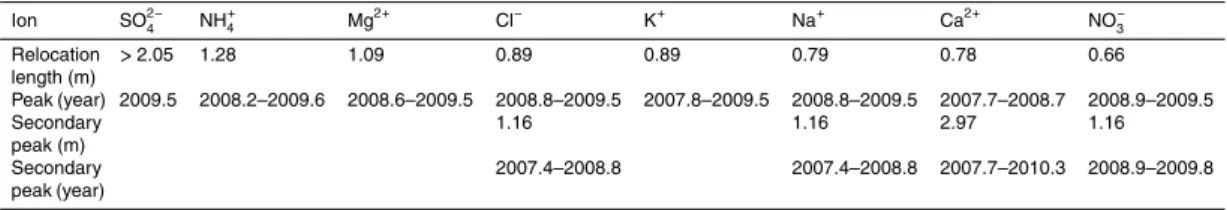
Table 4.Relocation length estimated for each ion measured in the LF-11 ice core. Secondary relocation peaks are also depicted.
Ion SO2−
4 NH+4 Mg
2+ Cl− K+ Na+ Ca2+ NO−
3 Relocation
length (m)
>2.05 1.28 1.09 0.89 0.89 0.79 0.78 0.66
Peak (year) 2009.5 2008.2–2009.6 2008.6–2009.5 2008.8–2009.5 2007.8–2009.5 2008.8–2009.5 2007.7–2008.7 2008.9–2009.5
Secondary peak (m)
1.16 1.16 2.97 1.16
Secondary peak (year)
TCD
9, 5053–5095, 2015Asyntheticice core
approach to estimate ion relocation in an
ice field site
C. P. Vega et al.
Title Page
Abstract Introduction
Conclusions References
Tables Figures
◭ ◮
◭ ◮
Back Close
Full Screen / Esc
Printer-friendly Version
Interactive Discussion
Discussion
P
a
per
|
Discussion
P
a
per
|
Discussion
P
a
per
|
Discussion
P
a
per
Table 5.Percentages of melted annual snow accumulation (MP) calculated with the PDD ap-proach (Pohjola et al., 2002; Nuth et al., 2012) using instrumental temperatures, and the snow-energy model (van Pelt et al., 2012).
MP (%)
Year Instrumental temperatures Snow-energy model
2010 34 52
2009 55 81
2008 34 68
2007 69 78
TCD
9, 5053–5095, 2015Asyntheticice core
approach to estimate ion relocation in an
ice field site
C. P. Vega et al.
Title Page
Abstract Introduction
Conclusions References
Tables Figures
◭ ◮
◭ ◮
Back Close
Full Screen / Esc
Printer-friendly Version
Interactive Discussion
Discussion
P
a
per
|
Discussion
P
a
per
|
Discussion
P
a
per
|
Discussion
P
a
per
|