TCD
8, 2923–2956, 2014Seasonal cycle of solar energy fluxes
through Arctic sea ice
S. Arndt and M. Nicolaus
Title Page
Abstract Introduction
Conclusions References
Tables Figures
◭ ◮
◭ ◮
Back Close
Full Screen / Esc
Printer-friendly Version Interactive Discussion
Discussion
P
a
per
|
Discus
sion
P
a
per
|
Discussion
P
a
per
|
Discussion
P
a
per
|
The Cryosphere Discuss., 8, 2923–2956, 2014 www.the-cryosphere-discuss.net/8/2923/2014/ doi:10.5194/tcd-8-2923-2014
© Author(s) 2014. CC Attribution 3.0 License.
This discussion paper is/has been under review for the journal The Cryosphere (TC). Please refer to the corresponding final paper in TC if available.
Seasonal cycle of solar energy fluxes
through Arctic sea ice
S. Arndt and M. Nicolaus
Alfred-Wegener-Institut Helmholtz-Zentrum für Polar- und Meeresforschung, Bussestraße 24, 27570 Bremerhaven, Germany
Received: 28 April 2014 – Accepted: 19 May 2014 – Published: 5 June 2014
Correspondence to: S. Arndt (stefanie.arndt@awi.de)
TCD
8, 2923–2956, 2014Seasonal cycle of solar energy fluxes
through Arctic sea ice
S. Arndt and M. Nicolaus
Title Page
Abstract Introduction
Conclusions References
Tables Figures
◭ ◮
◭ ◮
Back Close
Full Screen / Esc
Printer-friendly Version Interactive Discussion
Discussion
P
a
per
|
Discus
sion
P
a
per
|
Discussion
P
a
per
|
Discussion
P
a
per
|
Abstract
Arctic sea ice has not only decreased considerably during the last decades, but also changed its physical properties towards a thinner and more seasonal cover. These changes strongly impact the energy budget and might affect the ice-associated ecosys-tem of the Arctic. But until now, it is not possible to quantify shortwave energy fluxes 5
through sea ice sufficiently well over large regions and during different seasons. Here, we present a new parameterization of light transmittance through sea ice for all sea-sons as a function of variable sea ice properties. The annual maximum solar heat flux of 30×105J m−2occurs in June, then also matching the under ice ocean heat flux.
Fur-thermore, our results suggest that 96 % of the total annual solar heat input occurs from 10
May to August, during four months only. Applying the new parameterization on remote sensing and reanalysis data from 1979 to 2011, we find an increase in light trans-mission of 1.5 % a−1 for all regions. Sensitivity studies reveal that the results strongly
depend on the timing of melt onset and the correct classification of ice types. Hence, these parameters are of great importance for quantifying under-ice radiation fluxes and 15
the uncertainty of this parameterization. Assuming a two weeks earlier melt onset, the annual budget increases by 20 %. Continuing the observed transition from Arctic multi-to first year sea ice could increase light transmittance by another 18 %. Furthermore, the increase in light transmission directly contributes to an increase in internal and bottom melt of sea ice, resulting in a positive transmittance-melt feedback process. 20
1 Introduction
The evolution of Arctic sea ice towards a thinner, younger and more seasonal sea ice cover during the last few decades (e.g. Comiso, 2012; Haas et al., 2008; Maslanik et al., 2011, 2007) has a strong impact on the partitioning of solar energy between the atmosphere, the sea ice, and the ocean (e.g. Perovich et al., 2007, 2011; Wang et al., 25
TCD
8, 2923–2956, 2014Seasonal cycle of solar energy fluxes
through Arctic sea ice
S. Arndt and M. Nicolaus
Title Page
Abstract Introduction
Conclusions References
Tables Figures
◭ ◮
◭ ◮
Back Close
Full Screen / Esc
Printer-friendly Version Interactive Discussion
Discussion
P
a
per
|
Discus
sion
P
a
per
|
Discussion
P
a
per
|
Discussion
P
a
per
|
onset, and a longer melt season (Markus et al., 2009, updated) cause an increase in sea ice and snow melt (Perovich and Richter-Menge, 2009) and lead to higher absorp-tion and transmission of solar irradiance (Nicolaus et al., 2012; Stroeve et al., 2014). Beyond the physical consequences of the observed changes, strong impacts on bio-logical and geochemical processes are expected, like changes in habitat conditions for 5
ice-associated organisms or changes in primary productivity (Arrigo et al., 2012; Deal et al., 2011; Popova et al., 2012).
An increasing number of studies on the interaction of sunlight and sea ice has been performed over the last years. From those studies it was possible to improve our under-standing of the effects of snow covers (Perovich et al., 2007), melt ponds (Rösel and 10
Kaleschke, 2012), biological interaction (Arrigo et al., 2012; Mundy et al., 2005, 2007), spatial variability (Perovich et al., 2011), and seasonal changes (Nicolaus et al., 2010a; Perovich and Polashenski, 2012; Perovich et al., 2002). But it was not yet possible to quantify large-scale, multi-seasonal, and inter-annual changes, because all these stud-ies were limited to different regions and/or times of the year. One possible approach 15
to obtain such generalized studies on the in- and under-ice energy budgets in sea-ice covered oceans would be to use a radiative transfer model in combination with surface energy budgets, as obtained by Perovich et al. (2011). However, such a model would require adequate knowledge about the distribution of snow and sea ice (as forcing data) to derive the optical properties of sea ice and snow as function of space and time. This 20
kind of information is not available yet, in particular not over decades. An alternative approach is to use existing remote sensing and re-analyses data together with a pa-rameterization of light transmittance through sea ice. This method was developed by Nicolaus et al. (2012) and (2013) to calculate Arctic-wide radiation fluxes through sea ice for August 2011, the month when comprehensive transmittance measurements are 25
TCD
8, 2923–2956, 2014Seasonal cycle of solar energy fluxes
through Arctic sea ice
S. Arndt and M. Nicolaus
Title Page
Abstract Introduction
Conclusions References
Tables Figures
◭ ◮
◭ ◮
Back Close
Full Screen / Esc
Printer-friendly Version Interactive Discussion
Discussion
P
a
per
|
Discus
sion
P
a
per
|
Discussion
P
a
per
|
Discussion
P
a
per
|
Here we present all seasons and multi-year radiation transfer through Arctic sea ice based on the work by Nicolaus et al. (2012) and (2013). We extend and general-ize their up-scaling method by a new parameterization of light transmittance through various types of sea ice over the annual cycle. We also include the temporal and spa-tial variability of melt ponds by the application of melt-pond concentrations by Rösel 5
et al. (2012). The timing of different seasons is derived from melt and freeze onsets from Markus et al. (2009, updated). In order to judge the reliability of the method and to obtain a measure of uncertainty, the calculated fluxes are compared to in-situ ob-servations during the Tara drift (Nicolaus et al., 2010a) and sensitivity studies are per-formed. Finally, it was possible to derive trends for the years from 1979 to 2011 for 10
radiation transfer through Arctic sea ice.
2 Methods
Solar short-wave radiation fluxes (250 to 2500 nm, here also referred to as “light”) through sea ice are calculated for the entire Arctic (north of 65◦N) daily from 1
Jan-uary 1979 to 31 December 2011. Starting from the method and parameterization by 15
Nicolaus et al. (2012) and (2013) the parameterization of light transmittance through sea ice has been extended for all seasons. Transmittance is calculated as a function of sea ice type, surface (snow) melt/freeze state, and melt pond concentration. The new parameterization was merged with satellite observations of daily sea ice concen-tration and surface solar irradiance to calculate fluxes. All data sets are interpolated 20
to a 10 km polar stereographic grid. Although daily fluxes are calculated and available, monthly means are shown and used to discuss the findings of this study, because we aim for seasonal changes and long-term trends.
2.1 Input data sets
TCD
8, 2923–2956, 2014Seasonal cycle of solar energy fluxes
through Arctic sea ice
S. Arndt and M. Nicolaus
Title Page
Abstract Introduction
Conclusions References
Tables Figures
◭ ◮
◭ ◮
Back Close
Full Screen / Esc
Printer-friendly Version Interactive Discussion
Discussion
P
a
per
|
Discus
sion
P
a
per
|
Discussion
P
a
per
|
Discussion
P
a
per
|
1. Sea ice concentration was obtained from the Special Sensor Microwave Imager (SSMI/S) provided through the Ocean and Sea Ice Satellite Application Facilities (OSI SAF, product ID: OSI-401, Andersen et al., 2007). For this study, the com-bination of reprocessed data (1979 to 2007) and operational data (2008 to 2011) was used. Both data sets have systematical differences due to the processing with 5
a different set of tie point statistics for the ice concentration algorithm (Lavergne et al., 2010). However, within the documented uncertainties both data sets build the best available and consistent time series of sea ice concentration.
2. For sea ice age, we used the updated data product by Maslanik et al. (2007) and (2011). It is based on satellite data and a Lagrangian tracking since 1979. 10
Although this data product distinguishes the age of the ice from 1 to 10 years, here we only distinguish FYI and MYI (2 years and older), because all MYI is assumed to have similar optical properties. All data points with a sea ice concentration>0 but without sea ice age were treated as FYI. Vice versa, all data points with sea ice concentration<15 % but with an age tag were treated as open water. Such 15
modifications were necessary to obtain consistent data products from the different sources, indicating partially varying sea ice extents.
3. The downward surface solar radiation was obtained four times per day from the European Centre for Medium-Range Weather Forecast (ECMWF) Era Interim re-analyses (Dee et al., 2011). The data (four values per day) were averaged to daily 20
means and are available since 1979.
4. Sea ice surface characteristics were categorized by melt and freeze onset dates from passive microwave data (1979 to 2012) (Markus et al., 2009, updated). The data set distinguishes between the first occurrence of a melt event (early melt onset, EMO), the following continuous melt (melt onset, MO), the first occurring of 25
TCD
8, 2923–2956, 2014Seasonal cycle of solar energy fluxes
through Arctic sea ice
S. Arndt and M. Nicolaus
Title Page
Abstract Introduction
Conclusions References
Tables Figures
◭ ◮
◭ ◮
Back Close
Full Screen / Esc
Printer-friendly Version Interactive Discussion
Discussion
P
a
per
|
Discus
sion
P
a
per
|
Discussion
P
a
per
|
Discussion
P
a
per
|
5. Melt pond fraction was used from Rösel et al. (2012). But since this data set is only available since 2000, melt pond fractions from 1979 to 1999 were set to constant summer values of 26 % on FYI and 29 % on MYI as observed in August 2011 (Nicolaus et al., 2012). For consistencies with the surface characteristics, all melt pond fractions before EMO are set to zero.
5
2.2 The up-scaling model
Solar heat input through sea ice into the ocean (ET (t,x,y)) is calculated as the prod-uct of the downward solar radiation (Ed), the sea ice concentration (Ci), and the total transmittance of pond covered sea ice (τi) for each grid cell for each day from 1 Jan-uary 1979 to 31 December 1999:
10
ET(t,x,y)=Ed(t,x,y)×Ci(t,x,y)×τi (1)
with timetand position (x,y).
Since 1 January 2000, when satellite derived melt-pond concentrations are available, the solar heat input through sea ice into the ocean (ET) is calculated as the sum of 15
fluxes through bare ice (EB) and melt ponds (EP):
ET(t,x,y)=EB(t,x,y)+EP(t,x,y)
ET(t,x,y)=Ed(t,x,y)×Ci(t,x,y)×[1−Cp(t,x,y)]×τb+Ed(t,x,y)
×Ci(t,x,y)×Cp(t,x,y)×τp (2)
20
with the transmitted solar radiation at the bottom of the iceET, downward solar radiation
Ed, sea ice concentrationCi, melt pond fractionCp, transmittance of bare sea ice τb, transmittance of melt pondsτp, timetand grid cell (x,y).
To obtain the total solar heat input per unit area for a certain time period (QT (x,y)), the heat flux is calculated for each grid cell and then integrated over the given time (∆t) 25
TCD
8, 2923–2956, 2014Seasonal cycle of solar energy fluxes
through Arctic sea ice
S. Arndt and M. Nicolaus
Title Page
Abstract Introduction
Conclusions References
Tables Figures
◭ ◮
◭ ◮
Back Close
Full Screen / Esc
Printer-friendly Version Interactive Discussion
Discussion
P
a
per
|
Discus
sion
P
a
per
|
Discussion
P
a
per
|
Discussion
P
a
per
|
Spatial integration over the entire Arctic Ocean (north of 65◦N), reveals the Arctic-wide
total solar heat inputQT.
2.3 Seasonality of surface properties and transmittance of Arctic sea ice
To calculate solar heat fluxes under Arctic sea ice for an entire year, the main challenge is to parameterize the seasonal evolution of τb (t,x,y). This is mainly achieved by 5
merging the sea-ice age information (Maslanik et al., 2007, 2011) with the melt/freeze status (Markus et al., 2009, updated) into six surface types.
2.3.1 Definition of sea ice types
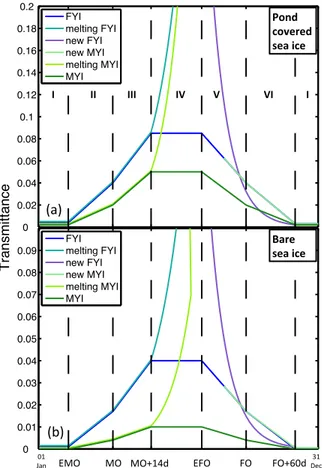
Figure 1 shows the annual cycle of these six sea ice classes together with surface properties of Arctic sea ice. Those classes are introduced to avoid abrupt changes 10
in the optical properties during the transition from spring to summer as well as from summer to fall. After EMO,melting FYI andmelting MYI are introduced for sea ice not surviving summer melt. Therefore, it is necessary to calculate for each cell whether it is becoming ice free (sea ice concentration less than 15 %) or not. If so, the last day of melting is stored for later calculations. According to Maslanik et al. (2007) and 15
(2011),FYI surviving the summer melt turns intonew MYI after week 36 of the year, and furthermore intoMYI at the end of the year. As soon as sea ice concentration is getting higher than 15 %new FYIis formed.
In the following, the composition of bare sea ice and melt ponds is called pond cov-ered sea ice.
20
2.3.2 Transmittance of pond covered sea ice
TCD
8, 2923–2956, 2014Seasonal cycle of solar energy fluxes
through Arctic sea ice
S. Arndt and M. Nicolaus
Title Page
Abstract Introduction
Conclusions References
Tables Figures
◭ ◮
◭ ◮
Back Close
Full Screen / Esc
Printer-friendly Version Interactive Discussion
Discussion
P
a
per
|
Discus
sion
P
a
per
|
Discussion
P
a
per
|
Discussion
P
a
per
|
mittance considers the transmission through both, sea ice and snow and is mostly based on measurements from Heat Budget of the Arctic Ocean experiment (SHEBA) from 1997 to 1998 (Perovich, 2005) and the drift of Tara in 2007 (Nicolaus et al., 2010a). In addition, analyses from previous observations by Perovich (1996), Perovich et al. (1998), and Nicolaus et al. (2010b) are used. Figure 2a shows the seasonal total 5
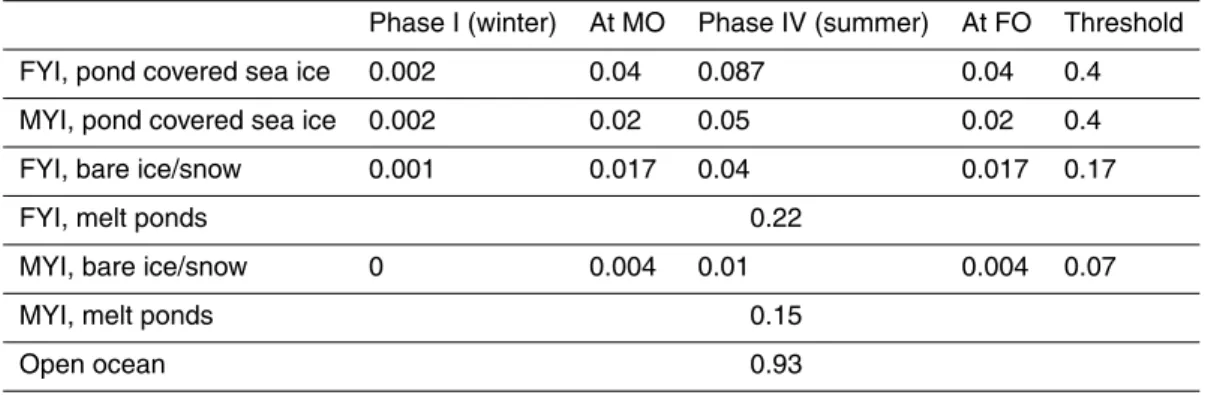
transmittance of pond covered sea ice (τi) for constant pond concentrations of 26 and 29 % for FYI and MYI, as it was used from 1979 to 2000. This composition of a given mixture of ponds and bare ice was used to develop the seasonal cycle of transmit-tance, as described in the next paragraphs. All transmittances of the different phases are compiled in Table 2.
10
Phase I: winter (from FO+60 days to EMO)
Winter conditions are characterized by snow covered sea ice without melt ponds. The snow cover is assumed to be cold, dry and optically thick. It determines the optical properties. Thus, radiative fluxes through sea ice are small. The best available trans-mittance observations for such conditions are those measured during the first days of 15
the Tara drift, although it was early April already. Hence transmittance was accordingly set to 0.002 (Nicolaus et al., 2010a).
Phase II: early melt (from EMO to MO)
EMO denotes the first significant change in optical properties. Snow depth decreases whereas temperatures of the surface and sea ice increase. Consequently, snow is no 20
longer optically thick and is getting wet and first melt ponds might occur. Here we as-sume a linear increase ofτiuntil MO. However, at MO, the surface albedo of FYI is only about half that of MYI (Perovich and Polashenski, 2012). Since Nicolaus et al. (2010a) calculated a transmittance of 0.02 for MYI for the day of MO, the transmittance of FYI is assumed as 0.04 following the albedo evolution.
25
Melting FYI and melting MYI
TCD
8, 2923–2956, 2014Seasonal cycle of solar energy fluxes
through Arctic sea ice
S. Arndt and M. Nicolaus
Title Page
Abstract Introduction
Conclusions References
Tables Figures
◭ ◮
◭ ◮
Back Close
Full Screen / Esc
Printer-friendly Version Interactive Discussion
Discussion
P
a
per
|
Discus
sion
P
a
per
|
Discussion
P
a
per
|
Discussion
P
a
per
|
described as roughly exponential (Perovich, 1996). Since melting has an approximately inverse effect on transmittance compared to albedo, we use a transmittance of 0.4 for the last existing sea ice (<10 cm) and fit an exponential increase between EMO and the last day of melting for the according pixel.
Phase III: continuous melt (from MO to MO+14 days) 5
After MO, snow is assumed to melt completely within 14 days (Nicolaus et al., 2006) and pond cover fraction increases rapidly until the maximum pond cover is reached at the end of this phase. The transmittance continues increasing linearly until begin of summer (MO+14 days) (Nicolaus et al., 2006).
Phase IV: summer (from MO+14 days to EFO) 10
During this phase the sea ice surface is characterized by strong sea ice melt and culminates in the Arctic sea ice extent minimum. The surface consists of a mixture of bare ice and melt ponds with comparably small changes. Hence,τiis assumed to be constant for sea ice that survives summer melt. Based on observed transmittances of solar radiation through FYI and MYI during TransArc 2011 (Nicolaus et al., 2012), 15
we use summer transmittances of 0.04 of bare FYI, 0.01 of bare MYI, 0.087 of pond covered FYI, and 0.05 of pond covered MYI. Those numbers are then weighted with melt pond fractions (Rösel and Kaleschke, 2012).
Phase V: fall freeze-up (from EFO to FO)
Air and surface temperatures drop below 0◦C resulting in first surface freezing.
Sub-20
sequently, snow accumulation may start and former melt ponds refreeze but may still be recognized through the new snow cover. Thus, the transmittance is decreasing rapidly. In analogy to Phase III the transmittance of FYI decreases to 0.04 and for MYI to 0.02 until FO. Additionally, sea ice that survived the summer melt is promoted to one-year-older ice in week 36/37 according to Maslanik et al. (2007) and new ice forms. The 25
TCD
8, 2923–2956, 2014Seasonal cycle of solar energy fluxes
through Arctic sea ice
S. Arndt and M. Nicolaus
Title Page
Abstract Introduction
Conclusions References
Tables Figures
◭ ◮
◭ ◮
Back Close
Full Screen / Esc
Printer-friendly Version Interactive Discussion
Discussion
P
a
per
|
Discus
sion
P
a
per
|
Discussion
P
a
per
|
Discussion
P
a
per
|
Phase VI: continuous freeze (from FO to FO+60 days)
Continuous freezing and an increasing snow accumulation towards an optically thick snow layer and the gradual disappearance of melt ponds characterize this phase. Be-yond new sea ice formation, the existing sea ice is getting thicker and older and de-formation is increasing. The transmittance is decreasing back to 0.02 until winter. It is 5
assumed that at the end of the freezing phase (FO+60 days) the surface properties of all newly formed FYI can be considered as equivalent. Afterwards, the accumulated optically thick snow layer dominates the optical properties of FYI and MYI again (Phase I).
2.3.3 Transmittance of bare ice and ponds
10
After 2000, when melt pond products are available from Rösel and Kaleschke (2012), the transmittances of bare ice (τb) and ponds (τp) are treated separately (Fig. 2b). The modal transmittance of melt ponds is constant over the entire melt season. It is set to 0.22 for FYI and 0.15 for MYI, as measured during TransArc 2011 (Nicolaus et al., 2012). The seasonal evolution of transmittance of bare ice (τb) follows the transmit-15
tance for pond covered sea ice (τi):
τb(x,y)=τi(x,y)×
τb(summer,x,y)
τi(summer,x,y) (4)
The values of τb (summer, x,y) and τi (summer, x,y) are the constant values dur-ing summer as given in Table 2. The scaldur-ing factor is constant for MYI (0.2) and FYI 20
(0.46). Finally, those transmittances are scaled with the pond concentration, as given in Eq. (2).
2.4 Deriving trends
TCD
8, 2923–2956, 2014Seasonal cycle of solar energy fluxes
through Arctic sea ice
S. Arndt and M. Nicolaus
Title Page
Abstract Introduction
Conclusions References
Tables Figures
◭ ◮
◭ ◮
Back Close
Full Screen / Esc
Printer-friendly Version Interactive Discussion
Discussion
P
a
per
|
Discus
sion
P
a
per
|
Discussion
P
a
per
|
Discussion
P
a
per
|
are calculated by a linear least-squares fit of the total mean (monthly or annual) heat flux for each grid cell (QT (x,y)). In order to exclude artifacts of the general changes in sea ice concentration, all trends have been corrected with the trend in sea ice concen-tration. Trends were only calculated for the area of the mean (annual or monthly) sea ice covered area in 2011 (sea ice concentration>15 %). All regions that were not ice 5
covered at any time in 2011 are excluded from the analysis and discussion.
3 Results
3.1 Seasonality of solar radiation under Arctic sea ice
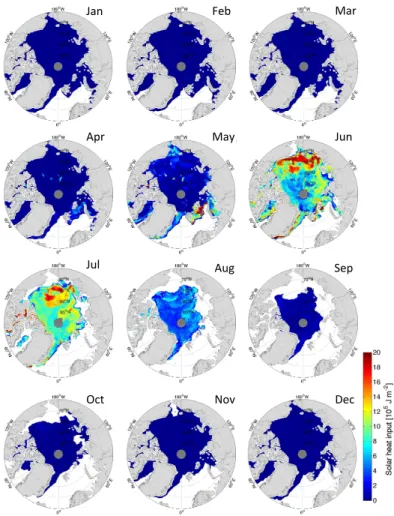
Based on the availability of all input data sets and the seasonality of transmittances, the solar heat input through sea ice into the ocean is analyzed from 1979 to 2011. 10
Figure 3 shows the monthly mean heat input (QT (x,y), Eq. 3) under Arctic sea ice (ice covered areas only) from January to December 2011. The example of 2011 was selected to ease comparisons with the results for August 2011 by Nicolaus et al. (2012) and Nicolaus et al. (2013). From October to March the monthly mean solar radiation under sea ice was smaller than 0.2×10⁵J m−2with an Arctic-wide total under-ice heat
15
flux (QT) of up to 0.4×10¹⁹J. Since this represents less than 1 % of the annual
Arctic-wide heat flux of 53.3×10¹⁹J, those months are neglected for further analyses and
discussion. In April the mean heat flux increased to 0.4×10⁵J m−2 with a maximum
of 7 to 8×10⁵Jm−2 in the marginal ice zone East of Spitsbergen. The transmittance
triples from 0.005 in April to 0.015 in May, and together with increasing surface fluxes, 20
the QT (x,y) increased from 1.×1019J to 5.5×10¹⁹J during this time. The Barents
Sea showed averaged transmitted heat fluxes up to 25×105J m−2 with a mean of
2.2×10⁵Jm−2in May. From May to June, the most pronounced increase was found for
QT(x,y) (to 9.3×10⁵J m−2) and the transmittance (0.054). The maximumQT(x,y) was about 30×105J m−2. June was the month of the highestQT (20.9×10
19
J) associated 25
TCD
8, 2923–2956, 2014Seasonal cycle of solar energy fluxes
through Arctic sea ice
S. Arndt and M. Nicolaus
Title Page
Abstract Introduction
Conclusions References
Tables Figures
◭ ◮
◭ ◮
Back Close
Full Screen / Esc
Printer-friendly Version Interactive Discussion
Discussion
P
a
per
|
Discus
sion
P
a
per
|
Discussion
P
a
per
|
Discussion
P
a
per
|
increase was linked with the beginning of the melt phase (mean MO on 30 May 2011) and the associated strong snow melt. During this time, the difference between thin melting sea ice on the sea ice edge and the persistent sea ice cover became most ob-vious, e.g. in the Chuckchi and Beaufort Seas. In July,QT (x,y) reached its maximum of 9.8×10⁵Jm−2 resulting from a maximum mean transmittance of 0.089. The
maxi-5
mumQT(x,y) reached still about 28×105J m−2with aQTof 18.4×10 19
J. The different impact of MYI and FYI, becomes most obvious in July. Also continuation of sea ice melt along the ice edge becomes more important for the under-ice heat fluxes. The August decrease of QT (x,y) by more than 50 % to 4.4×10⁵J m−2 along with only a slight
reduction of transmittance to 0.084 is mainly caused by the strong decrease in solar 10
surface irradiance (679×1019J). These surface fluxes are only half of those during the
previous months. MaximumQT (x,y) reached up to 19×105J m−2. In September the
QT (x,y) decreased further to 0.6×10⁵J m−2 related to a low transmittance of 0.039
andQTwas 0.7×10¹⁹J.
3.2 Light transmission from 1979 to 2011
15
The new data set ofQT (x,y) allows quantification of annual budgets, regional diff er-ences, and decadal trends. Figure 4a illustrates the strong regional variability of the total solar heat input through sea ice into the ocean (QT (x,y)) ranging from 20 to 100 MJ m−2 for the given period. The mean total solar heat input per grid cell in the
area of the mean sea ice extent was 46 MJ m−2.The maximumQ
T (x,y) occurs at the 20
edge of the marginal ice zone in the Canadian Arctic Archipelago (up to 110 MJ m−2)
and the East Siberian Sea and Chukchi Sea (up to 80 MJ m−2). In contrast, excluding
ice edge effects, the minimum QT (x,y) was found in the Central Arctic, a MYI domi-nated region of low transmittance.
The mean trend of QT (x,y) was 1.5 % a−1 (excluding sea ice edge e
ffects) with 25
a maximum of+4 % a−1in the East Siberian Sea and southern part of the North
TCD
8, 2923–2956, 2014Seasonal cycle of solar energy fluxes
through Arctic sea ice
S. Arndt and M. Nicolaus
Title Page
Abstract Introduction
Conclusions References
Tables Figures
◭ ◮
◭ ◮
Back Close
Full Screen / Esc
Printer-friendly Version Interactive Discussion
Discussion
P
a
per
|
Discus
sion
P
a
per
|
Discussion
P
a
per
|
Discussion
P
a
per
|
of the melt season in these regions. Over the entire Arctic, the mean MO was 4 days earlier, shifting from day 145 (24 May) to day 141 (20 May), according a linear regres-sion from 1979 as in 2011. The strongest trend of 4.8×10¹⁸J a−1was found for June
followed by May and July with 1.8×10¹⁸J a−1. August shows a comparably weak
neg-ative trend of−0.2×10¹⁸J a−1, due to a lower solar surface irradiance. Assuming an
5
identical sea ice extent in 1979 and 2011, the increase in the annual mean solar heat flux through sea ice (QT) amounts to 22.5×10¹⁹J in the Arctic over the entire period.
This means an averaged increase by 33 %. Over all, 94 % of the total annual solar heat input through Arctic sea ice was observed during the four key months: May to August. Furthermore, heat flux time series (annual, June, July) show an increasing variability 10
after 1999, which is likely due to a larger variability of the summer sea ice cover.
4 Discussion
4.1 Seasonality and trends of transmitted fluxes
The total annual solar radiation under Arctic sea ice amounted to 53.3×10¹⁹J in 2011.
Based on this, May to August are the most important months for the basal energy bud-15
get of Arctic sea ice. During this time, 96 % (51.2×10¹⁹J) of the total annual solar
heat input is transmitted through the sea ice. Including April and September in addi-tion, 99 % (52.9×10¹⁹J) of the total annual flux is transmitted, within only one third
of the year. Generalizing the monthly fluxes, the annual cycle may be summarized in three phases: (1) the heat input through snow and sea ice into the ocean is negligi-20
ble between October and March, (2) solar surface radiation dominates the under-ice light conditions from April to June, because transmittance increases only slowly, while surface irradiance determines most of the observed changes and variability, (3) dur-ing summer (July to September), energy fluxes depend mainly on the sea ice type, showing large differences in transmittance between FYI and MYI.
TCD
8, 2923–2956, 2014Seasonal cycle of solar energy fluxes
through Arctic sea ice
S. Arndt and M. Nicolaus
Title Page
Abstract Introduction
Conclusions References
Tables Figures
◭ ◮
◭ ◮
Back Close
Full Screen / Esc
Printer-friendly Version Interactive Discussion
Discussion
P
a
per
|
Discus
sion
P
a
per
|
Discussion
P
a
per
|
Discussion
P
a
per
|
Comparing our results to the development of the solar heat input into the ice pre-sented by Perovich et al. (2011, Fig. 2), a weaker trend in the contribution of solar heat input to the ocean (up to 1.5 % a−1) compared to the one of solar heat input through sea
ice (up to 4 % a−1) is evident. This di
fference might be an indication of an increasing bottom and internal melt during the last decades and thus, affecting the sea ice mass 5
balance. An increasing light absorption of Arctic sea ice due to more seasonal and less multi year ice was also found by Nicolaus et al. (2012).
The trend towards more light transmission through sea ice, does not only impact the light conditions right at the bottom of the sea ice, but also affects the horizontal and vertical light field in the ice covered ocean. More light at the bottom of sea ice will 10
deepen the euphotic zone, as more light penetrates deeper into the ocean (Frey et al., 2011; Katlein et al., 2014). It contributes to an increase in mixed layer temperature, and provides more energy for primary production and biogeochemical processes in and be-neath the sea ice. However, it has to be noted that an increase in light availability does not necessarily increase biological activity, but might also be harmful (Leu et al., 2010). 15
Consequently, sea ice bottom and internal melt are likely to become more important for sea ice mass balance (Nicolaus et al., 2012), which again might result in an additional increase in transmittance. That feedback process can be trigger a transmittance-melt feedback.
Our calculated trends are based on constant pond fractions before 2000. Speculation 20
of even less ponds, might even increase the trends. The increasing melt pond fraction on Arctic sea ice between 2000 and 2011 has been also shown in Rösel and Kaleschke (2012).
All findings are based on results that were corrected for the trend in sea ice con-centration. However, to point towards the future importance of such heat fluxes, it is 25
important to consider that those sea ice concentration trends differ significantly for dif-ferent months. While the trend is−0.1 % a−1 for September, it is only−0.06 % a−1 for
TCD
8, 2923–2956, 2014Seasonal cycle of solar energy fluxes
through Arctic sea ice
S. Arndt and M. Nicolaus
Title Page
Abstract Introduction
Conclusions References
Tables Figures
◭ ◮
◭ ◮
Back Close
Full Screen / Esc
Printer-friendly Version Interactive Discussion
Discussion
P
a
per
|
Discus
sion
P
a
per
|
Discussion
P
a
per
|
Discussion
P
a
per
|
for biological primary production is expected to be largest, the trend in sea ice con-centration is even positive with+0.04 % a−1. Hence, the importance for energy fluxes
through sea ice, and their future developments, remains highly relevant also for the coming years and in a more and more seasonal Arctic sea ice cover.
4.2 Comparisons with in-situ measurements
5
A validation for the calculated trends and spatial variability is almost impossible as insufficient field data with adequate spatial and temporal coverage are available. How-ever, some comparisons with time series of light transmission from different field stud-ies may be performed to identify major uncertaintstud-ies.
Here we compare, surface and transmitted solar irradiance of the presented method 10
with in-situ measurements during the Transpolar Drift of Tara from 29 April to 28 Au-gust 2007 (Nicolaus et al., 2010a). Nearest-neighbor grid points within 0.5◦of the daily
Tara position were extracted from the presented data set and averaged. Figure 6a (red and green lines) shows a comparison of the time series of transmitted solar irradi-ance from both data sets. Until 8 June, the transmitted solar irradiirradi-ance under sea ice 15
varies only little around 0.5 W m−2 for both, the calculated and the measured time
se-ries. Afterwards until end of June, the measured transmitted fluxes increased steadily towards 10 W m−2, whereas calculated fluxes were highly variable with most values
be-low 4 W m−2. Hence, the total solar heat input through the sea ice to the ocean from 1
May to 16 July 2007 was 21.4 MJ m−2 for the observed Tara data, whereas the
calcu-20
lated data resulted in a 17 % lower total heat flux of 17.7 MJ m−2. During summer (16
July to 14 August), under-ice fluxes cannot be compared reasonably since the sensor at Tara was strongly influenced by biological processes, causing an increased absorp-tion and reduced transmitted fluxes. After 14 August, the measured transmitted heat flux increased rapidly to about 6 W m−2, comparable to the calculated one. Finally, the
25
TCD
8, 2923–2956, 2014Seasonal cycle of solar energy fluxes
through Arctic sea ice
S. Arndt and M. Nicolaus
Title Page
Abstract Introduction
Conclusions References
Tables Figures
◭ ◮
◭ ◮
Back Close
Full Screen / Esc
Printer-friendly Version Interactive Discussion
Discussion
P
a
per
|
Discus
sion
P
a
per
|
Discussion
P
a
per
|
Discussion
P
a
per
|
Main reason for these differences is the timing of the phases describing the surface characteristics. While both data sets have a coincident EMO on 9 June, large diff er-ences are evident for the later phase transitions: the observed MO at Tara was on 21 June whereas the calculated MO for the center position was 17 days later on 8 July. Taking also the other 8 neighbors in account, mean MO was on 13 June. This shows 5
that there is a difference of 25 days in MO on the 10 km grid. As presented above, the transmitted heat flux strongly depends on the timing of the different melt phases by Markus et al. (2009). EFO was observed on 15 August during Tara, whereas the satellite data maintains summer melt conditions until 14 September. However, the total solar heat input through sea ice was similar for both data sets. Conclusively, the solar 10
radiation flux under Arctic sea ice strongly depends on the timing of EMO and MO, while the timing of EFO and FO seems to be of less importance. The timing of melt onset has also a large influence on the total amount of light absorption, as shown in Stroeve et al. (2014). Consider the ongoing lengthening of the melt season by up to two weeks per decade (by a later EMO), their calculations suggest an albedo increase 15
of 9 % per decade.
In a second validation step, the heat fluxes were re-calculated using the onset dates as observed during Tara instead of those by Markus et al. (2009) (Fig. 6, black lines). This eliminated the impact of the onset dates on the results. Nevertheless, the cal-culated total solar heat input through sea ice was still differing by 18 % (25.4 MJ m−2)
20
from the Tara fluxes until 16 July (Fig. 6a) due to an unexpected peak inQT (x,y) in July. In addition, the calculated time series showed still a large day-to-day variability, including much higher transmittances than observed at Tara. The main reason for this is the alternation of sea ice types (FYI and MYI), whereas the Tara floe consisted of MYI only. Consequently, the strong differences in optical properties of FYI and MYI, as 25
TCD
8, 2923–2956, 2014Seasonal cycle of solar energy fluxes
through Arctic sea ice
S. Arndt and M. Nicolaus
Title Page
Abstract Introduction
Conclusions References
Tables Figures
◭ ◮
◭ ◮
Back Close
Full Screen / Esc
Printer-friendly Version Interactive Discussion
Discussion
P
a
per
|
Discus
sion
P
a
per
|
Discussion
P
a
per
|
Discussion
P
a
per
|
Hudson et al. (2013) measured heat fluxes and calculated transmittances of Arctic FYI in July/August 2012. However, a direct comparison of energy fluxes, as for the Tara measurements, is not possible, because the melt-pond concentration data set ends in December 2011. August transmittance in our study (0.087) is based on the observations by Nicolaus et al. (2012), which is only half of the 0.16 found by Hudson 5
et al. (2013). Hence, it may be assumed that heat fluxes through sea ice would be larger based on those measurements. Differences between both studies mainly result from differences in sea ice thickness during the respective campaigns as well as the different methods of quantifying transmittance (mean value vs. modal value) (Hudson et al., 2013). Including measured ocean heat fluxes during summer (Hudson et al., 10
2013), we conclude that the heat flux through the sea ice is of similar magnitude and importance.
Measurements from Ice-Tethered Profilers (ITPs) (Krishfield et al., 2008) could be used as an alternative approach to estimate uncertainties of the new parameterization. They allow quantifying the heat content of the uppermost ocean and its changes. How-15
ever, such comparison would require a significant extension of the presented study, integrating larger depths and including all radiation fluxes through open waters.
4.3 Sensitivity studies
Main reasons for the large discrepancies between the observed and calculated trans-mittance and transmitted light were the dating of melt onset and the spatial variability 20
of the ice types. Thus, several sensitivity studies have been performed. Three studies focused on the influence of timing and length of the melt season on the solar heat input to the upper ocean: (1) EMO and MO 7 days earlier (moving the Arctic-wide means to 8 May and 23 May), (2) EMO and MO 14 days earlier (means: 1 May and 16 May), and (3) EFO and FO 14 days later (means: 21 October and 2 November) in 2011.
25
TCD
8, 2923–2956, 2014Seasonal cycle of solar energy fluxes
through Arctic sea ice
S. Arndt and M. Nicolaus
Title Page
Abstract Introduction
Conclusions References
Tables Figures
◭ ◮
◭ ◮
Back Close
Full Screen / Esc
Printer-friendly Version Interactive Discussion
Discussion
P
a
per
|
Discus
sion
P
a
per
|
Discussion
P
a
per
|
Discussion
P
a
per
|
the entire year 2011. The strongest increase of 33 % compared to the reference melt onset dates was found for May, while the strongest absolute increase of 3.1×10¹⁹J
was found in June. Shifting the melt season another 7 days backwards,QT increases in total by 24 % to about 66.3×10¹⁹J for the year. This increase is more than
dou-ble compared to the 7-day-shift (Tadou-ble 3). The pronounced increase is most evident in 5
May, when 90 % more light transmission was found than in the reference system. The strongest absolute increase of 6.2×10¹⁹J (transmittance from 0.054 to 0.067) was
de-rived for June. The spatial distribution of the impact of the 14 days earlier EMO and MO showed the largest increase of solar heat input to the upper ocean in the marginal ice zone, adding up to more than 100 % (Fig. 7a).
10
Experiment 3, extending the melt season by 14 days later EFO and FO, results in a 1 % increase ofQTfrom 53.3×10¹⁹J to 53.9×10¹⁹J (Fig. 7b). Since the surface solar
radiation is much less than between April and June, the change in the end of the melt season affects only parts of August and September (increase of 9 % from 7.02×10¹⁹J
to 7.65×10¹⁹J).
15
In a fourth sensitivity study, the influence of the ice type was quantified. The reference ice cover of 2011 consists e.g. of 56 % FYI and 44 % MYI in August. Assuming that all sea ice in 2011 was MYI, the mean transmitted flux decreased by 34 % to 35.5×10¹⁹
J. In contrast, assuming that only FYI was present increased that value by 18 % to 62.7×10¹⁹J. Hence, the transition from a MYI to FYI dominated Arctic sea ice regime
20
results in a further increase of solar heat flux under Arctic sea ice.
Beyond those experiments, also other parameters influence the amount and sea-sonality of solar heat input through the ice to the ocean, in particular surface solar radiation and the melt pond fraction. Increasing the latter by 10 %, the annual heat flux increases by 5 % for the solar heat input to the upper ocean. The effect approximately 25
TCD
8, 2923–2956, 2014Seasonal cycle of solar energy fluxes
through Arctic sea ice
S. Arndt and M. Nicolaus
Title Page
Abstract Introduction
Conclusions References
Tables Figures
◭ ◮
◭ ◮
Back Close
Full Screen / Esc
Printer-friendly Version Interactive Discussion
Discussion
P
a
per
|
Discus
sion
P
a
per
|
Discussion
P
a
per
|
Discussion
P
a
per
|
ice (Eq. 2). The effect of sea ice concentration is not discussed, since all results related to the ice covered parts of the ocean only.
5 Summary and conclusions
The new parameterization for light transmission through Arctic sea ice in combination with time series derived from satellite observations and re-analyses allows to quantify 5
solar short-wave radiation fluxes through Arctic sea ice for the entire annual cycle over more than 30 years (1979 to 2011). Therefore, highest fluxes were calculated for June. The presented studies suggest that 96 % of the total annual solar heat input through sea ice occur in only 4 months (May to August). Regarding the time period from 1979 to 2011, an increase in light transmission of 1.5 % a−1with regional maxima of 4.0 % is
10
found.
The results of our sensitivity studies show that energy fluxes strongly depend on the timing of melt onset and sea ice types (first and multi year ice). Those parameters are the most critical ones for the shown calculations and describe the most critical uncertainties. The calculated trends are affected most of these uncertainties.
15
All these results consider the fluxes through ice-covered ocean only, which highlights that changes in sea ice properties have a large impact on the energy budget and should not be neglected compared to the obvious effect of sea ice retreat. However, the ongoing retreat of sea ice will cause additional increases in radiation fluxes into the Arctic Ocean. The access heat will also contribute to an increase of heat stored in 20
the ocean mixed layer and will impact the melt season duration and timing, particularly autumn refreezing.
The additional energy input into the sea ice and the upper ocean will also impact inner sea ice structures as well as internal and basal melting. Comparison with surface radiation trends by Perovich et al. (2011) suggests that the stronger trend in transmis-25
TCD
8, 2923–2956, 2014Seasonal cycle of solar energy fluxes
through Arctic sea ice
S. Arndt and M. Nicolaus
Title Page
Abstract Introduction
Conclusions References
Tables Figures
◭ ◮
◭ ◮
Back Close
Full Screen / Esc
Printer-friendly Version Interactive Discussion
Discussion
P
a
per
|
Discus
sion
P
a
per
|
Discussion
P
a
per
|
Discussion
P
a
per
|
More investigations of bio-geo-physical connections will be needed to better quantify the effects of the changing physical environment on the ecosystem and element cycles, and vice versa. Additional work will also be needed to improve Arctic-wide snow depth and sea ice thickness data products. Those products should on a good description of surface properties during the spring-summer-transition, when the largest uncertainties 5
were found. Such time series might become available from new data products merging observations from different satellites and sensor types (e.g. SMOS, CryoSat-2, AMSR-E), and potentially also numerical models. The non-existence of such reliable long-term and Arctic-wide data sets was the main reason to develop the presented method, based on available parameters. Otherwise, the application of a radiation transfer model with 10
adequate input (forcing) data would have been an obvious alternative.
Acknowledgements. We are most grateful to Jim Maslanik (University of Colorado Boulder),
Thorsten Markus and Jeffrey Miller (both NASA Goddard Space Flight Center), Thomas
Lavergne (OSISAF, Met Norway), and Anja Rösel and Lars Kaleschke (both University of Ham-burg) for data provision and support through manifold discussions on their data products and
15
processing details. We thank Christian Katlein (Alfred-Wegener-Institut Helmholtz-Zentrum für Polar- und Meeresforschung) and Martin Claussen (Max Planck Institute for Meteorology) for constructive comments on the manuscript. The study was funded through the Remote Sensing Alliance of the Helmholtz Association and the Alfred-Wegener-Institut Helmholtz-Zentrum für Polar- und Meeresforschung.
20
References
Andersen, S., Breivik, L. A., Eastwood, S., Godøy, Ø., Lind, M., Porcires, M., and Schyberg, H.: OSI SAF Sea Ice Product Manual, v3. 5, EUMETSAT OSI SAF, Ocean and Sea Ice Sattelite Application Facility, Tech. Rep. SAF/OSI/met. no/TEC/MA/125, Copenhagen, 2007.
Arrigo, K. R., Perovich, D. K., Pickart, R. S., Brown, Z. W., van Dijken, G. L., Lowry, K. E.,
25
TCD
8, 2923–2956, 2014Seasonal cycle of solar energy fluxes
through Arctic sea ice
S. Arndt and M. Nicolaus
Title Page
Abstract Introduction
Conclusions References
Tables Figures
◭ ◮
◭ ◮
Back Close
Full Screen / Esc
Printer-friendly Version Interactive Discussion
Discussion
P
a
per
|
Discus
sion
P
a
per
|
Discussion
P
a
per
|
Discussion
P
a
per
|
Polashenski, C. M., Reynolds, R. A., Schieber, B., Sosik, H. M., Stephens, M., and Swift, J. H.: Massive phytoplankton blooms under Arctic sea ice, Science, 336, 1408–1408, doi:10.1126/Science.1215065, 2012.
Comiso, J. C.: Large decadal decline of the Arctic multiyear ice cover, J. Climate, 25, 1176– 1193, 2012.
5
Deal, C., Jin, M. B., Elliott, S., Hunke, E., Maltrud, M., and Jeffery, N.: Large-scale modeling of primary production and ice algal biomass within arctic sea ice in 1992, J. Geophys. Res.-Oceans, 116, C07004, doi:10.1029/2010jc006409, 2011.
Dee, D. P., Uppala, S. M., Simmons, A. J., Berrisford, P., Poli, P., Kobayashi, S., Andrae, U., Balmaseda, M. A., Balsamo, G., and Bauer, P.: The ERA – interim reanalysis: configuration
10
and performance of the data assimilation system, Q. J. Roy. Meteor. Soc., 137, 553–597, 2011.
Frey, K. E., Perovich, D. K., and Light, B.: The spatial distribution of solar radiation under a melting Arctic sea ice cover, Geophys. Res. Lett., 38, L22501, doi:10.1029/2011GL049421, 2011.
15
Haas, C., Pfaffling, A., Hendricks, S., Rabenstein, L., Etienne, J. L., and Rigor, I.: Reduced ice thickness in Arctic Transpolar Drift favors rapid ice retreat, Geophys. Res. Lett., 35, L17501, doi:10.1029/2008gl034457, 2008.
Hudson, S. R., Granskog, M. A., Sundfjord, A., Randelhoff, A., Renner, A. H. H., and Di-vine, D. V.: Energy budget of first-year Arctic sea ice in advanced stages of melt, Geophys.
20
Res. Lett., 40, 2679–2683, doi:10.1002/grl.50517, 2013.
Katlein, C., Nicolaus, M., and Petrich, C.: The anisotropic scattering coefficient of sea ice, J. Geophys. Res. Oceans, 119, 842–855, doi:10.1002/2013JC009502, 2014.
Krishfield, R., Toole, J., Proshutinsky, A., and Timmermans, M. L.: Automated ice-tethered pro-filers for seawater observations under pack ice in all seasons, J. Atmos. Ocean. Tech., 25,
25
2091–2105, doi:10.1175/2008jtecho587.1, 2008.
Kwok, R.: Annual cycles of multiyear sea ice coverage of the Arctic Ocean: 1999–2003, J. Geophys. Res., 109, C11004, doi:10.1029/2003JC002238, 2004.
Lavergne, T., Killie, M. A., Eastwood, S., and Breivik, L.-A.: Extending the CryoClim Arctic Sea Ice Extent Time Series with Operational OSI SAF Products from 2008 Onwards, Norwegian
30
TCD
8, 2923–2956, 2014Seasonal cycle of solar energy fluxes
through Arctic sea ice
S. Arndt and M. Nicolaus
Title Page
Abstract Introduction
Conclusions References
Tables Figures
◭ ◮
◭ ◮
Back Close
Full Screen / Esc
Printer-friendly Version Interactive Discussion
Discussion
P
a
per
|
Discus
sion
P
a
per
|
Discussion
P
a
per
|
Discussion
P
a
per
|
Leu, E., Wiktor, J., Soreide, J. E., Berge, J., and Falk-Petersen, S.: Increased irradiance reduces food quality of sea ice algae, Mar. Ecol. Prog. Ser., 411, 49–60, doi:10.3354/meps08647 2010.
Markus, T., Stroeve, J. C., and Miller, J. A.: Recent changes in Arctic sea ice melt onset, freezeup, and melt season length, J. Geophys. Res., 114, C12024,
5
doi:10.1029/2009JC005436, 2009.
Maslanik, J. A., Fowler, C., Stroeve, J., Drobot, S., Zwally, J., Yi, D., and Emery, W.: A younger, thinner Arctic ice cover: increased potential for rapid, extensive sea-ice loss, Geophys. Res. Lett., 34, L24501, doi:10.1029/2007gl032043, 2007.
Maslanik, J. A., Stroeve, J., Fowler, C., and Emery, W.: Distribution and trends in Arctic sea
10
ice age through spring 2011, Geophys. Res. Lett., 38, L13502, doi:10.1029/2011gl047735, 2011.
Mundy, C. J., Barber, D. G., and Michel, C.: Variability of snow and ice thermal, physical and optical properties pertinent to sea ice algae biomass during spring, J. Marine Syst., 58, 107– 120, doi:10.1016/J.Jmarsys.2005.07.003, 2005.
15
Mundy, C. J., Ehn, J. K., Barber, D. G., and Michel, C.: Influence of snow cover and algae on the spectral dependence of transmitted irradiance through Arctic landfast first-year sea ice, J. Geophys. Res.-Oceans, 112, C03007, doi:10.1029/2006jc003683, 2007.
Nicolaus, M. and Katlein, C.: Mapping radiation transfer through sea ice using a remotely oper-ated vehicle (ROV), The Cryosphere, 7, 763–777, doi:10.5194/tc-7-763-2013, 2013.
20
Nicolaus, M., Haas, C., Bareiss, J., and Willmes, S.: A model study of differences of snow thinning on Arctic and Antarctic first-year sea ice during spring and summer, Ann. Glaciol., 44, 147–153, 2006.
Nicolaus, M., Gerland, S., Hudson, S. R., Hanson, S., Haapala, J., and Perovich, D. K.: Sea-sonality of spectral albedo and transmittance as observed in the Arctic Transpolar Drift in
25
2007, J. Geophys. Res.-Oceans, 115, C11011, doi:10.1029/2009jc006074, 2010a.
Nicolaus, M., Hudson, S. R., Gerland, S., and Munderloh, K.: A modern concept for au-tonomous and continuous measurements of spectral albedo and transmittance of sea ice, Cold Reg. Sci. Technol., 62, 14–28, 2010b.
Nicolaus, M., Katlein, C., Maslanik, J., and Hendricks, S.: Changes in Arctic sea ice
re-30
TCD
8, 2923–2956, 2014Seasonal cycle of solar energy fluxes
through Arctic sea ice
S. Arndt and M. Nicolaus
Title Page
Abstract Introduction
Conclusions References
Tables Figures
◭ ◮
◭ ◮
Back Close
Full Screen / Esc
Printer-friendly Version Interactive Discussion
Discussion
P
a
per
|
Discus
sion
P
a
per
|
Discussion
P
a
per
|
Discussion
P
a
per
|
Nicolaus, M., Arndt, S., Katlein, C., Maslanik, J., and Hendricks, S.: Correction to “Changes in Arctic sea ice result in increasing light transmittance and absorption”, Geophys. Res. Lett., 40, 2699–2700„ doi:10.1002/grl.50523, 2013.
Perovich, D. K.: The Optical Properties of Sea Ice, DTIC Document, 96-1, 25 pp., Hanover, N. H., May 1996.
5
Perovich, D. K.: On the aggregate-scale partitioning of solar radiation in Arctic sea ice during the Surface Heat Budget of the Arctic Ocean (SHEBA) field experiment, J. Geophys. Res.-Oceans, 110, C03002, doi:10.1029/2004jc002512, 2005.
Perovich, D. K. and Polashenski, C.: Albedo evolution of seasonal Arctic sea ice, Geophys. Res. Lett., 39, L08501, doi:10.1029/2012GL051432, 2012.
10
Perovich, D. K. and Richter-Menge, J. A.: Loss of Sea Ice in the Arctic*, Annual Review of Marine Science, 1, 417–441, 2009.
Perovich, D. K., Roesler, C. S., and Pegau, W. S.: Variability in Arctic sea ice optical properties, J. Geophys. Res.-Oceans, 103, 1193–1208, doi:10.1029/97jc01614, 1998.
Perovich, D. K., Grenfell, T. C., Light, B., and Hobbs, P. V.: Seasonal evolution of the albedo of
15
multiyear Arctic sea ice, J. Geophys. Res.-Oceans, 107, 8044, doi:10.1029/2000jc000438, 2002.
Perovich, D. K., Nghiem, S. V., Markus, T., and Schweiger, A.: Seasonal evolution and inter-annual variability of the local solar energy absorbed by the Arctic sea ice–ocean system, J. Geophys. Res.-Oceans, 112, C03005, doi:10.1029/2006jc003558, 2007.
20
Perovich, D. K., Jones, K. F., Light, B., Eicken, H., Markus, T., Stroeve, J., and Lindsay, R.: Solar partitioning in a changing Arctic sea-ice cover, Ann. Glaciol., 52, 192–196, 2011.
Popova, E. E., Yool, A., Coward, A. C., Dupont, F., Deal, C., Elliott, S., Hunke, E., Jin, M. B., Steele, M., and Zhang, J. L.: What controls primary production in the Arctic Ocean?, Results from an intercomparison of five general circulation models with biogeochemistry, J. Geophys.
25
Res.-Oceans, 117, C00d12, doi:10.1029/2011jc007112, 2012.
Rösel, A. and Kaleschke, L.: Exceptional melt pond occurrence in the years 2007 and 2011 on the Arctic sea ice revealed from MODIS satellite data, J. Geophys. Res.-Oceans, 117, C05018, doi:10.1029/2011jc007869, 2012.
Rösel, A., Kaleschke, L., and Birnbaum, G.: Melt ponds on Arctic sea ice determined from
30
TCD
8, 2923–2956, 2014Seasonal cycle of solar energy fluxes
through Arctic sea ice
S. Arndt and M. Nicolaus
Title Page
Abstract Introduction
Conclusions References
Tables Figures
◭ ◮
◭ ◮
Back Close
Full Screen / Esc
Printer-friendly Version Interactive Discussion
Discussion
P
a
per
|
Discus
sion
P
a
per
|
Discussion
P
a
per
|
Discussion
P
a
per
|
Stroeve, J. C., Markus, T., Boisvert, L., Miller, J., and Barrett, A.: Changes in Arctic melt season and implications for sea ice loss, Geophys. Res. Lett., 41, 1216–1225, doi:10.1002/2013gl058951, 2014.
Wang, C., Granskog, M. A., Gerland, S., Hudson, S. R., Perovich, D. K., Nicolaus, M., Ivan Karlsen, T., Fossan, K., and Bratrein, M.: Autonomous observations of solar energy
parti-5
TCD
8, 2923–2956, 2014Seasonal cycle of solar energy fluxes
through Arctic sea ice
S. Arndt and M. Nicolaus
Title Page
Abstract Introduction
Conclusions References
Tables Figures
◭ ◮
◭ ◮
Back Close
Full Screen / Esc
Printer-friendly Version Interactive Discussion
Discussion
P
a
per
|
Discus
sion
P
a
per
|
Discussion
P
a
per
|
Discussion
P
a
per
|
Table 1.Data sources of the different parameters used in this study.
Parameter Time period Source
Sea ice concentration 1979–2007 OSI SAF, reprocessed data
2008–2011 OSI SAF, operated data (Andersen et al., 2007)
Sea ice age 1979–2011 Maslanik et al. (2007, 2011)
Downward surface solar radiation 1979–2011 ECMWF (Dee et al., 2011)
Melt and freeze onset 1979–2005 SSMR
2006–2010 AMSR-E
2011 SSM/IS (Markus et al., 2011)
TCD
8, 2923–2956, 2014Seasonal cycle of solar energy fluxes
through Arctic sea ice
S. Arndt and M. Nicolaus
Title Page
Abstract Introduction
Conclusions References
Tables Figures
◭ ◮
◭ ◮
Back Close
Full Screen / Esc
Printer-friendly Version Interactive Discussion
Discussion
P
a
per
|
Discus
sion
P
a
per
|
Discussion
P
a
per
|
Discussion
P
a
per
|
Table 2.Transmittances of different sea ice and surface types. Abbreviations: FYI: first year ice, MYI: multi year ice, Phase I: winter, MO: melt onset, Phase IV: summer, FO: freeze onset, Threshold: transition from open ocean to sea ice and vice versa.
Phase I (winter) At MO Phase IV (summer) At FO Threshold
FYI, pond covered sea ice 0.002 0.04 0.087 0.04 0.4
MYI, pond covered sea ice 0.002 0.02 0.05 0.02 0.4
FYI, bare ice/snow 0.001 0.017 0.04 0.017 0.17
FYI, melt ponds 0.22
MYI, bare ice/snow 0 0.004 0.01 0.004 0.07
MYI, melt ponds 0.15
TCD
8, 2923–2956, 2014Seasonal cycle of solar energy fluxes
through Arctic sea ice
S. Arndt and M. Nicolaus
Title Page
Abstract Introduction
Conclusions References
Tables Figures
◭ ◮
◭ ◮
Back Close
Full Screen / Esc
Printer-friendly Version Interactive Discussion
Discussion
P
a
per
|
Discus
sion
P
a
per
|
Discussion
P
a
per
|
Discussion
P
a
per
|
Table 3.Annual Arctic-wide solar heat input (and relative changes) under sea ice (QT) in 2007 for the reference method and sensitivity studies: changes in melt season duration by (1) 7 day earlier early melt onset (EMO) and melt onset (MO), (2) 14 days earlier EMO and MO, and (3) 14 days later early freeze onset (EFO) and freeze onset (FO). All numbers in 1019J.
Reference system EMO and MO – 7 days EMO and MO – 14 days EFO and FO+14 days Apr 1.00 1.19 (+19 %) 1.45 (+45 %) 1.00 (0 %)
TCD
8, 2923–2956, 2014Seasonal cycle of solar energy fluxes
through Arctic sea ice
S. Arndt and M. Nicolaus
Title Page
Abstract Introduction
Conclusions References
Tables Figures
◭ ◮
◭ ◮
Back Close
Full Screen / Esc
Printer-friendly Version Interactive Discussion
Discussion
P
a
per
|
Discus
sion
P
a
per
|
Discussion
P
a
per
|
Discussion
P
a
per
|
(a)
(b)
Figure 4. Annual total solar heat input (QT (x,y)) through Arctic sea ice. (a) Average and
TCD
8, 2923–2956, 2014Seasonal cycle of solar energy fluxes
through Arctic sea ice
S. Arndt and M. Nicolaus
Title Page
Abstract Introduction
Conclusions References
Tables Figures
◭ ◮
◭ ◮
Back Close
Full Screen / Esc
Printer-friendly Version Interactive Discussion
Discussion
P
a
per
|
Discus
sion
P
a
per
|
Discussion
P
a
per
|
Discussion
P
a
per
|
(a)
60 65 70 75 80 85 90
Solar heat flux [10
19
J]
(b)
19790 1983 1987 1991 1995 1999 2003 2007 2011
10 20 30 40
Solar heat flux [10
J]
May June July August
60 65 70 75 80 85 90
Solar heat flux [10
J]
Total annual
TCD
8, 2923–2956, 2014Seasonal cycle of solar energy fluxes
through Arctic sea ice
S. Arndt and M. Nicolaus
Title Page
Abstract Introduction
Conclusions References
Tables Figures
◭ ◮
◭ ◮
Back Close
Full Screen / Esc
Printer-friendly Version Interactive Discussion
Discussion
P
a
per
|
Discus
sion
P
a
per
|
Discussion
P
a
per
|
Discussion
P
a
per
|
01−0May 15−May 01−Jun 15−Jun 01−Jul 15−Jul 01−Aug 15−Aug 01−Sep 15−Sep 5
10 15 20 25
Solar heat input [Wm
−
2]
(a)
01−0May 15−May 01−Jun 15−Jun 01−Jul 15−Jul 01−Aug 15−Aug 01−Sep 15−Sep
0.05 0.1 0.15 0.2
Transmittance
Parameterization (Markus et al., 2009; melt onset)
In−situ measurements during Tara
Parameterization with observed melt onset (Tara)
(b)
TCD
8, 2923–2956, 2014Seasonal cycle of solar energy fluxes
through Arctic sea ice
S. Arndt and M. Nicolaus
Title Page
Abstract Introduction
Conclusions References
Tables Figures
◭ ◮
◭ ◮
Back Close
Full Screen / Esc
Printer-friendly Version Interactive Discussion
Discussion
P
a
per
|
Discus
sion
P
a
per
|
Discussion
P
a
per
|
Discussion
P
a
per
|