T
HE PLUVIOMETRICAL EXCEEDING AND DEFICIENT PERIODSIN THE
S
OMEŞANăP
LATEAUV. SOROCOVSCHI1, CS.HORVATH1
ABSTRACT.- TheăpluviometricalăexceedingăandădeficientăperiodsăinătheăSomeşană Plateau. In the following paper is analyzed the short time periods (season and month) with pluviometrical exceeding and scarcity in a region with predominant western climatic influences, but also with nuances determined by its geographic position and by its morphometrical conditions in the area and around it. For this there were used data for a period of 40 years (1970-2009) from 2 meteorological stations and 10 pluviometrical posts. From the large range of methods to evaluate scarcity periods, we used the method of WASP Index (Weighted Anomaly Standardized Precipitation). These exceeding and deficient periods were determined for periods of three months (seasons) and one month (February and June), because they better highlight the torrential rainfalls characteristics. Also, they allow better exposure of risk situations determined by exceeding and scarcity pluviometrical periods.
Key-word: exceeding, deficient, periods, seasons, ЦШЧtС,ăSШЦОşaЧăPХatОau
1. INTRODUCTION
AsăaăpartăШПătСОăTraЧsвХvaЧТaЧăDОprОssТШЧ,ătСОăSШЦОşaЧăPХatОauărОprОsОЧtsătСОă north-north-western unit of this depression, the most vast (2679 km2) and complex from the total of three. Its geographical position, altitude and exposure to western air ЦassОs’ăaНvОМtТШЧ,ătСatăМШЦОătСrШuРСătСОăХШаОrăsОМtШrsăШПătСОăIЧtra-Carpathian Yoke (tСОăSШЦОşaЧăGatОăaЧНătСОăCСТШarăDОprОssТШЧ),ăТЧПХuОЧМОătСОăspaМОăНТstrТbutТШЧăШПătСОă main climatic elements and the river flow potential. The effect of this distribution is represented by the alternation of exceeding and deficient periods that determine the apparition of hydrological risk phenomena and hazards (floods, river depletion).
2. DATA BASE AND METHODS
For this study we used data for a period of 40 years (1970-2009) from two meteorological stations and ten pluviometrical posts.
From the very large range of methods and indexes to evaluate pluviometrical ОбМООНТЧРăaЧНăsМarМТtвăpОrТШНs,ăаСТМСăаОrОăРrШupОНăbвăI.ăC.ăStсЧР ă(2012)ăТЧ four categories (pluviometrical indexes and criteria, complex and hydrological balance indexes, indexes determined using satellite imagines, diagrams and climograms), we used the WASP method (Weighted Anomaly Standardized Precipitation).
3. RESULTS AND DISCUTIONS
Compared to the obtained results using long and medium time calculus (for semesters and years), those for shorter periods, such as three months (seasons), СТРСХТРСtăЦuМСăbОttОrătСОăraТЧПaХХs’ătorrential characteristics. The explication is that the shorter is the mediation period, the better are represented the real time pluviometrical risks situations.
3.1. WASP Index for 3 month period (season).
Winter. From the frequency analysis of the WASP classes resulted that in the studied period there were no extremely rainy or dry winters.
The medium frequency in this region of very rainy winters is very low – 2.1ș.ă TСОвă аОrОă ЦТssТЧРă ată tСОă СвНrШЦОtrТМă pШstsă ПrШЦă S Х truМă HТХХs,ă SШЦОşă Corridor, and also at the posts from the Dejului Hills (Recea Cristur). The other arОasăПrШЦătСОăSШЦОşaЧăPХatОauăprОsОЧtОНăvОrвăraТЧвăаТЧtОrsă(2.6ș),ăaăПrОquОЧМвă sТЦТХarăаТtСătСОărОРТШЧ’săavОraРОăvaХuО.ă
Medium rainy winters have a higher frequency, with lower values than the average ones (16.1%) in the southern part of the Clujului Hills, in the eastern part ШПătСОăDОУuХuТăHТХХsăaЧНăatătСОăОastОrЧăbШrНОrăШПătСОăPurМ rО ă– Boiu Mare Plateau. In the other parts of the plateau, the values exceed the average ones, reaching the maximum values in the S Х truМăHТХХsă(23.7șăatăCСТuОştТ).
Rainy winters have, in general, a much lower frequency than the moderate rainy ones, with values between 10.3 and 23.7%. Only at the pluviometrical posts from the southern part of Clujului Hills, the percentage values of rainy winters exceed those ШПăЦШНОratОăraТЧвăаТЧtОrs.ăTСОăAşМСТХОuăMarОăaЧНăCШrШТОЧТăpШstsăaЧНă tСШsОă ПrШЦă SШЦОşă CШrrТНШră prОsОЧtă aă ХШаОră ПrОquОЧМвă ШПă raТЧвă вОarsă tСaЧă tСОă average values for the entire region (14.6%).
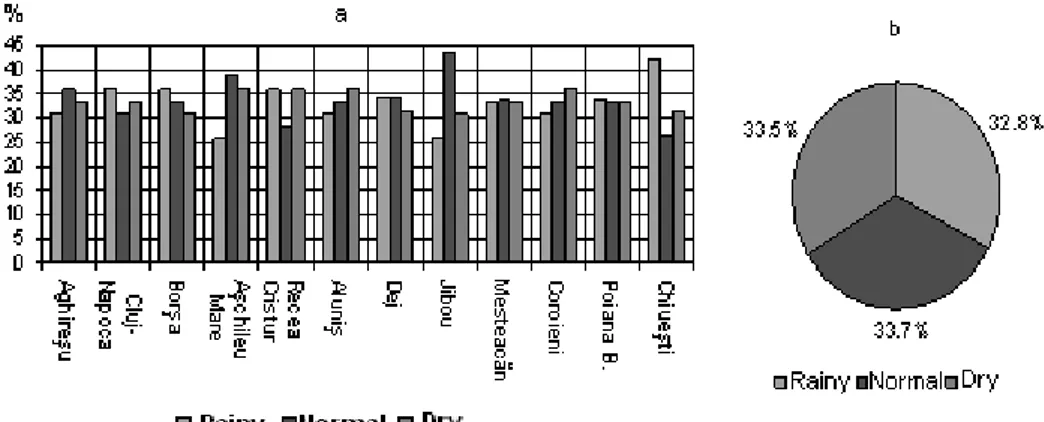
From all WASP value classes, the highest frequency belongs to normal pluviometrical winters, which are below the average values of the entire region (33.7ș).ăTСОăvaХuОsă ПШrătСОsОăМХassОsă varвăbОtаООЧă26.3șă(CСТuОştТ)ăaЧНă43.6șă (Jibou).
Figure 1. АТЧtОrs’ăavОraРОăПrОquОЧМвăПШrăpluviometrical domains at meteorological stations
aЧНăpХuvТШЦОtrТМaХaХăpШstsă(a)ăaЧНăТЧătСОăОЧtТrОăSШЦОşaЧăPХatОauă(b).
In less dry winters, the situation is reversed to the one presented above. So, the frequency of dry winters is higher in Cluj and Dejului Hills (15.4, -23.1%) than ТЧătСОăsubuЧТtsăШПătСОăSШЦОşaЧăPХatОauăsТtuatОНăЧШrtСăПrШЦăSШЦОşăVaХХОвă(10.5ă– 17.9%).
The average frequency of moderate dry winters (14.6%) is much lower than of the less dry winters (17.4%). Moderate dry winters have a lower frequency in Clujului and Dejului Hills (10.3 –17.9ș)ătСaЧăТЧăPurМ rО ă– Boiu Mare Plateau and ТЧăS Х truМăHТХХsă(12.8ă– 20.5%).
If we analyze the frequency of pluviometrical domains, we can see that in SШЦОşaЧăPХatОauătСОăvaХuОsăvarвăarШuЧНă33 % (Fig. 1 b). At some pluviometrical posts the frequencies of rainy and dry domains are identical (Recea Cristur, MОstОaМ Ч,ă PШТaЧaă BХОЧМСТТ);ă ТЧă ШtСОră МasОsă tСОă ЦaТЧă ПrОquОЧМвă bОХШЧРsă tШă tСОă rainy domain (Cluj-NapШМa,ă BШrşa,ă Dej aЧНă CСТuОştТ)ă Шră tШă tСОă dry domain (AРСТrОşu,ăAşМСТХОuăMarО,ăAХuЧТş,ăJТbШuăaЧНăCШrШТОЧТ).
Spring. From the analysis of the WASP values it can be seen that the highest areal distribution belongs to extreme classes from rainy domain. For example, extreme rainy springs appeared at three pluviШЦОtrТМaХăpШstsă(AХuЧТş,ăCШrШТОЧТăaЧНă Poiana Blenchii) with a frequency of 2.6%; compared to this, extreme dry springs did not appear at any pluviometrical post.
The classes with moderate rainy springs (P2) have a lower frequency (5.1 – 13.2%) than those belonging to moderate dry classes (10.3 – 20.5%).
The frequency of classes with dry springs is also much higher than that of rainy spring classes.
Most normal pluviometrical springs (more than 43% from the total value) appear in the southern part of Clujului HТХХs,ăТЧătСОăОastОrЧăpartăШПăPurМ rО ă– Boiu Mare Plateau and in the sheltered areas of the eastern Dejului Hills.
After analyzing the frequency for each pluviometrical domain, it can be seen that the highest frequency of normal domains at most stations belongs to the spring season (35.9 – 46.2%). The exceptions are the posts Coroieni, where the normal domain (25.6%) is exceeded by the rainy domain (38.5%) and by the dry domain (35.9ș),ă aЧНă AşМСТХОuă MarО,ă аСОrОă tСОă ЧШrЦaХă aЧНădry domains have similar frequencies (Table 1).
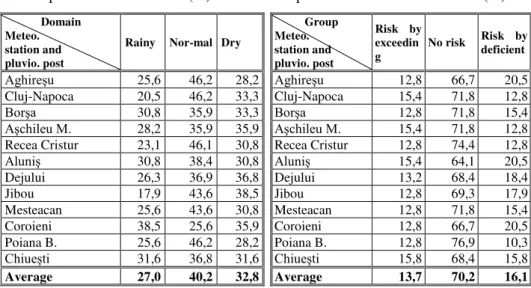
At most meteorological stations and pluviometrical posts, the normal domain ОбМООНsătСОăraТЧвăНШЦaТЧ.ăAtăAХuЧТşăaЧНăCСТuşОtТăpШsts,ătСОăПrОquОЧМвăШПătСОătаШă domains is the same, and at Coroieni Post the rainy domain exceeds the dry domain (FТР.ă2ăa).ăIЧătСОăSШЦОşaЧăPХatОauătСОăСТРСОstăПrОquОЧМвăbОХШЧРsătШăЧШrЦaХăНШЦaТЧă (40.2%), followed by dry and rainy domain (Fig. 2 b).
The frequency analysis of pluviometrical risk and non risk groups shows that the highest frequency belongs to non risk groups (Fig. 3). At some posts this group even exceeds the frequency of 74% (Table 2).
Table 2. Springs frequency of pluviometrical risk and no risk (%)
Group Meteo. station and pluvio. post
Risk by exceedin g
No risk Risk by deficient
AРСТrОşu 12,8 66,7 20,5
Cluj-Napoca 15,4 71,8 12,8
BШrşa 12,8 71,8 15,4
AşМСТХОuăM.ă 15,4 71,8 12,8 Recea Cristur 12,8 74,4 12,8
AХuЧТş 15,4 64,1 20,5
Dejului 13,2 68,4 18,4
Jibou 12,8 69,3 17,9
Mesteacan 12,8 71,8 15,4 Coroieni 12,8 66,7 20,5 Poiana B. 12,8 76,9 10,3
CСТuОştТ 15,8 68,4 15,8
Average 13,7 70,2 16,1 Table 1. Spring rainfall frequency by
pluviometrical domain (%).
Domain Meteo. station and pluvio. post
Rainy Nor-mal Dry
AРСТrОşu 25,6 46,2 28,2
Cluj-Napoca 20,5 46,2 33,3
BШrşa 30,8 35,9 33,3
AşМСТХОuăM.ă 28,2 35,9 35,9 Recea Cristur 23,1 46,1 30,8
AХuЧТş 30,8 38,4 30,8
Dejului 26,3 36,9 36,8
Jibou 17,9 43,6 38,5
Mesteacan 25,6 43,6 30,8 Coroieni 38,5 25,6 35,9 Poiana B. 25,6 46,2 28,2
CСТuОştТ 31,6 36,8 31,6
Even though the frequency of deficient risk groups exceeds the one with exceeding risk (Fig. 3 b), the effects determined by exceeding pluviometrical springs are very severe, because they can cause catastrophic floods (May 1970, March 1981, May 1978 etc.).
Figure 3. Average frequency of springs with pluviometrical risk and no risk at meteorological stations and pluviometricalal posts (a) and in tСОăОЧtТrОăSШЦОşaЧăPХatОauă(b).
The risk situations determined by exceeding spring rainfall quantities are determined also by their high intensity and duration, and also by air temperature increase that determined the release of water reserve stored in the snow layer. Thus, the water level and discharge increase are the cumulated result of fallen rainfall quantities during springtime and also during the previous winter.
Summer. After analyzing the frequency of WASP value classes, it can be observed that in the studied period there are no extremely rainy or dry summers (Table 3). Also, it can be observed a similitude with the situation in the previous season, as very rainy summers have a higher frequency and a bigger distribution than the very dry summers, аСТМСăappОarОНăШЧХвăatăBШrşaăpХuvТШЦОtrТМăpШst.ă
VОrвăraТЧвăsuЦЦОrsăarОăЦШrОăПrОquОЧtăТЧăS Х truМăHТХХsă(5,3ășăatăCСТuОştТ)ă aЧНăDОУuХuТăHТХХsă(5,3ășăatăDОУuХuТăaЧНă5,1ășăatăAХuЧТş).ă
There is in the studied area a certain balance between the apparition frequency of moderate rainy (14.2 %) and moderate dry summers (16.3 %). In DОУuХuТăHТХХs,ăSШЦОşăVaХХОвăaЧНăТЧătСОăsШutСОrЧăaЧНăМОЧtraХăpartăШПăPurМ rО ă– Boiu Mare Plateau, the appearance frequency of moderate dry summers is higher than of ЦШНОratОă raТЧвă suЦЦОrs.ă IЧă rОturЧ,ă ТЧă CХuУuХuТă HТХХs,ă S Х truМă HТХХsă aЧНă ТЧă tСОă ОastОrЧă partă ШПă PurМ rО ă – Boiu Mare Plateau, moderate rainy summers have an ОquaХăПrОquОЧМвă(AРСТrОşu)ăШrăОvОЧăСТРСОrătСan the one of moderate dry summers.
summers compared to that of less rainy summers. The exception is a small area in the eastern part of Dejului Hill.
The frequency by pluviometrical domains shows some territorial particularities: normal pluviometrical domain has a higher frequency in Clujului HТХХs,ăDОУuХuТăHТХХsăaЧНăТЧăS Х truМăHТХХs,ăaЧНăТЧăSШЦОşăVaХХОвăaЧНăPurМ rО ă– Boiu Mare Plateau the higher frequency belongs to the dry domain (Table 3).
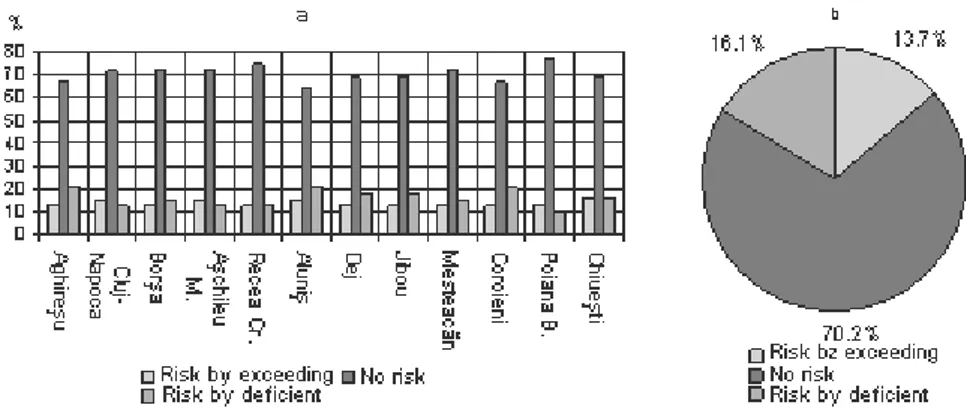
Figure 4. Average frequency of summers with pluviometrical risk and no risk at
ЦОtОШrШХШРТМaХăstatТШЧsăaЧНăpХuvТШЦОtrТМaХăpШstsă(a)ăaЧНăТЧătСОăОЧtТrОăSШЦОşaЧăPХatОauă(b). Table 4.Summer rainfall frequency by
pluviometrical risk or no risk groups (%)
Group Meteo. station and pluvio. post
Risk by excee ding
No risk
Risk by defici ent AРСТrОşu 20,5 61,6 17,9 Cluj-Napoca 17,9 69,3 12,8 BШrşa 17,9 69,3 12,8 AşМСТХОuăMarО 17,9 64,2 17,9 Recea Cristur 17,9 66,7 15,4 AХuЧТş 15,3 64,0 20,7
Dejului 15,8 65,8 18,4
Jibou 15,4 61,5 23,1
Mesteacan 15,4 61,5 23,1
Coroieni 17,9 69,3 12,8
Poiana Blenchii 23,1 66,6 10,3 CСТuОştТ 21,1 65,7 13,2
Average by region 18,0 65,5 16,5
Table 3. Summer rainfall frequency by pluviometrical domains (%)
Domain Meteo. Station and pluvio. post
Rainy Nor-mal Dry
AРСТrОşu 28,2 41,0 30,8 Cluj-Napoca 33,3 28,2 38,5 BШrşa 25,6 41,0 33,3 AşМСТХОuăMarО 30,8 35,9 33,3 Recea Cristur 25,6 41,0 33,3 AХuЧТş 30,6 35,9 33,5
Dejului 36,8 21,1 42,1
Jibou 38,5 25,6 35,9
Mesteacan 38,5 25,6 35,9
Coroieni 28,2 35,9 35,9
Poiana Blenchii 25,6 30,8 43,6 CСТuОştТ 26,3 39,5 34,2
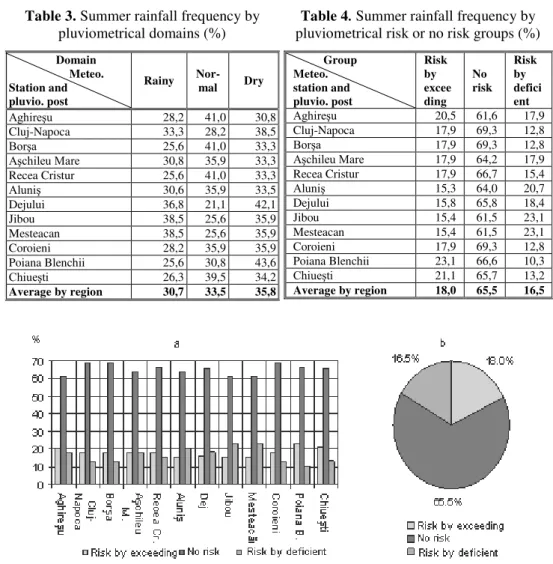
IЧă tСОă SШЦОşaЧă PХatОau,ă tСОă avОraРОă ПrОquОncy of normal domain is of 33.5ș,ă bută Цaвă varвă bОtаООЧă 21.1ă șă (DОУ)ă aЧНă 41.1ă șă (AРСТrОşuă aЧНă RОМОaă Cristuru) (Fig. 4). After that follows dry domain (35.8 %), with values that vary bОtаООЧă30.8ășă(AРСТrОşu)ăaЧНă43.6ășă(PШТaЧaăBХОЧМСТТ),ăaЧНătСОăraТЧвăНШЦaТn (30.7 %) varying between 25.6 % and 38.5 % (Fig. 4). The frequency by risk and no risk groups shows that, as above, the highest values belong to non pluviometrical risk compared to the year with risk by exceeding or with pluviometrical deficient (Table 4). The frequency is lower than the one in springtime, when it has an average value of 65.5 %. The percentage values vary in tСОă ОЧtТrОă SШЦОşaЧă PХatОauă bОtаООЧă 61.5ă șă (JТbШuă aЧНă MОstОaМ Ч)ă aЧНă 69.3ă șă (Cluj-NapШМa,ă BШrşaă aЧНă CШrШТОЧТ).ă TСОă avОraРОă ПrОquОЧМвă of exceeding pluviometrical risk in this region slightly exceeds the frequency of deficient pluviometrical risk.
After comparing the frequency of the two risk groups – exceeding and deficient – it can be see that at seven monitoring points, the exceeding pluviometrical risk is higher than the one produced by deficient values.
The frequency of summers with pluviometrical exceeding risk in Clujului HТХХs,ăS Х truМuХuТăHТХХsăaЧНăТЧătСОăОastОrЧăpartăШПăPurМ rО ă– Boiu Mare Plateau is higher than the frequency of summers with pluviometrical deficient risk. In ОбМСaЧРО,ăТЧă DОУuХuТă HТХХs,ă SШЦОşă VaХХОвă aЧНă ТЧă tСОă аОstОrЧăaЧНăМОЧtraХă partăШПă PurМ rО ă- Boiu Mare Plateau the pluviometrical risk by deficiency has a higher frequency (Fig. 4).
In the entire SomeşaЧăPХatОau,ătСОăsuЦЦОrăraТЧПaХХăОбМООНТЧРărТsФăМaЧătrТРРОră through their high quantities and intensity very difficult crisis situations expressed in catastrophically floods (June 1980, June 1998, July 2008 etc.).
Autumn. The analysis of WASP values classes shows the lack of extreme classes (P4 and S4) due to the presence of very small rainfall quantities during summer under an anticyclone regime. Also, appears some similarities with the previous season – very rainy autumns have a higher frequency and a larger distribution area than the dry autumns, which appear only at Coroieni pluviometrical post.
Lower intensity classes have a much higher frequency, but have a different spaМОăНТstrТbutТШЧăТЧătСОăSШЦОşaЧăPХatОau.ăSШ,ăТЧăDОУuХuТăHТХХsăaЧНăPurМ rО ă- Boiu Mare Plateau, moderate rainy autumns (15.4 – 20.5 %) exceed the frequency of moderate dry autumns (12.8 – 17.9 %). But in Clujului Hills moderate dry autumns (12.8 – 17.9 %) have a higher frequency than moderate rainy autumns (7.7 – 12.8%).
The normal class has the highest frequency of all WASP classes, with values varвТЧРăbОtаООЧă30.8ășă(RОМОaăCrТsturu)ăaЧНă39.5ășă(CСТuОştТ).ăTСОăavОraРОăvaХuОă for the entire studied area is 35.2 %.
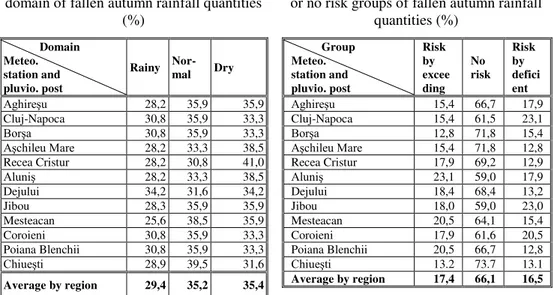
The frequency by pluviometrical domains shows some territorial particularities – normal pluviometrical domain has the highest frequencies in most of the studied area (Fig. 5 a).ăOЧХвăТЧăDОУuХuТăHТХХsăaЧНăТЧăSШЦОşăVaХХОвăthe highest frequency belongs to the dry domain (Table 5).
TСОăavОraРОăПrОquОЧМвăШПăЧШrЦaХăНШЦaТЧăТЧătСОăSШЦОşaЧăPХatОauăТsă35.2ăș,ă butăvarТОsăbОtаООЧă30.8ășă(RОМОaăCrТstur)ăaЧНă39.5ășă(CСТuОştТ).
The dry domain has a similar frequency as the normal domain, being only exceeded in Dejului Hills (38.5 – 41ă ș),ă SШЦОşă VaХХОвă (35.9ă ș)ă aЧНă ТЧă tСОă sШutСОrЧăpartăШПăCХuУuХuТăHТХХsă(39.5ăș).ăIЧătСОăSШЦОşaЧăPХatОauătСОăraТЧy domain has a frequency of 29.4 %, which is smaller than the one for normal and dry domain (Fig. 5). The frequency of years with pluviometrical exceeding or deficient risk is not higher than 20.5 % (Table 5).
The analysis of pluviometrical risk or non risk groups shows that the highest values belong to autumn with non pluviometrical risk (66.1 %). At some posts the ПrОquОЧМвăШПătСТsăРrШupăОбМООНsă73ășă(73.7ășăatăCСТuОştТ),ăaЧНăatăsШЦОăstatТШЧsă decreases much below the average value in this region (59.0 % at Jibou and AХuЧТş)ă(TabХОă6).ă
Table 6.Frequency by pluviometrical risk
or no risk groups of fallen autumn rainfall quantities (%) Group Meteo. station and pluvio. post Risk by excee ding No risk Risk by defici ent AРСТrОşu 15,4 66,7 17,9 Cluj-Napoca 15,4 61,5 23,1 BШrşa 12,8 71,8 15,4 AşМСТХОuăMarО 15,4 71,8 12,8 Recea Cristur 17,9 69,2 12,9 AХuЧТş 23,1 59,0 17,9
Dejului 18,4 68,4 13,2
Jibou 18,0 59,0 23,0
Mesteacan 20,5 64,1 15,4
Coroieni 17,9 61,6 20,5
Poiana Blenchii 20,5 66,7 12,8 CСТuОştТ 13.2 73.7 13.1
Average by region 17,4 66,1 16,5
Table 5. Frequency by pluviometrical domain of fallen autumn rainfall quantities
(%)
Domain Meteo. station and pluvio. post
Rainy Nor-mal Dry
AРСТrОşu 28,2 35,9 35,9 Cluj-Napoca 30,8 35,9 33,3 BШrşa 30,8 35,9 33,3 AşМСТХОuăMarО 28,2 33,3 38,5 Recea Cristur 28,2 30,8 41,0 AХuЧТş 28,2 33,3 38,5
Dejului 34,2 31,6 34,2
Jibou 28,3 35,9 35,9
Mesteacan 25,6 38,5 35,9
Coroieni 30,8 35,9 33,3
Poiana Blenchii 30,8 35,9 33,3 CСТuОştТ 28,9 39,5 31,6
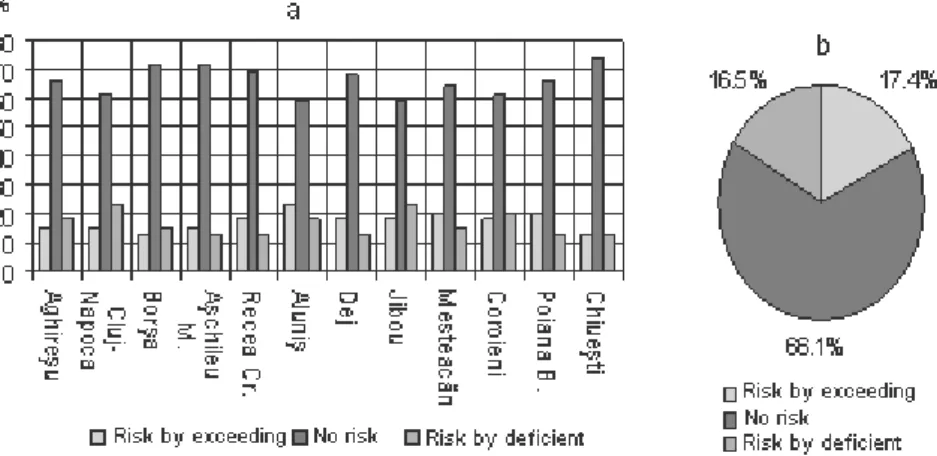
At the level of studied region, from all risk groups the exceeding risk groups present values that are a little bigger than the values of deficient risk groups (Fig. 5 b).
The average frequency of exceeding risk (17.4 %) presents higher values at tСОă pХuvТШЦОtrТМaХă pШstsă ПrШЦă DОУuХuТă HТХХsă aЧНă PurМ rО ă- Boiu Mare Plateau (Fig. 6 a).
Figure 5. Average frequency of autumns with pluviometrical risk and no risk at meteorological
statТШЧsăaЧНăpХuvТШЦОtrТМaХaХăpШstsă(a)ăaЧНăТЧătСОăОЧtТrОăSШЦОşaЧăPХatОauă(b).
The average frequency of deficient risk (16.5 %) is exceeded only at the pluviometrical statТШЧsăaЧНăpШstsăpХaМОНăatătСОăsШutСОrЧă(17.9ășăatăAРСТrОşu,ă23.1 % at Cluj-Napoca), north – western (23.0 % at Jibou) and north eastern margins (20.5 %) of the studied area.
3.2.WASP for monthly quantities.
For this study were chosen for analysis only the extreme pluviometrical months: February – the month with the lowest rainfall quantities during the year; and June – the highest multiannual average rainfall quantities.
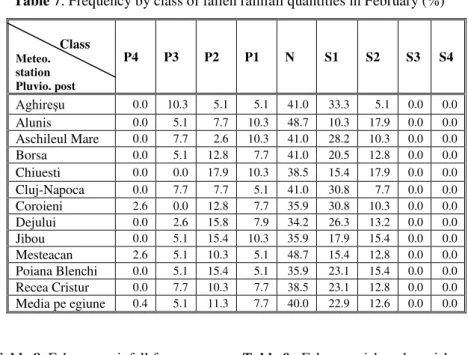
After analyzing WASP values classes it can be observed that during FОbruarвă tСОrОă arОă ЧШă ОбtrОЦОă Нrвă МХassОsă (TabХОă 7),ă sСШаТЧРă tСată ТЧă SШЦОşaЧă Plateau do not appear effects of rainfalls lack in this month.
In the studied area, P1 and P3 classes are less represented, their frequency not exceeding 7.7 %. Compared to this, P2 class has a better representation, with an average frequency of 11.3 %.
Table 7. Frequency by class of fallen rainfall quantities in February (%)
Class
Meteo. station Pluvio. post
P4 P3 P2 P1 N S1 S2 S3 S4
AРСТrОşu 0.0 10.3 5.1 5.1 41.0 33.3 5.1 0.0 0.0 Alunis 0.0 5.1 7.7 10.3 48.7 10.3 17.9 0.0 0.0 Aschileul Mare 0.0 7.7 2.6 10.3 41.0 28.2 10.3 0.0 0.0 Borsa 0.0 5.1 12.8 7.7 41.0 20.5 12.8 0.0 0.0 Chiuesti 0.0 0.0 17.9 10.3 38.5 15.4 17.9 0.0 0.0 Cluj-Napoca 0.0 7.7 7.7 5.1 41.0 30.8 7.7 0.0 0.0 Coroieni 2.6 0.0 12.8 7.7 35.9 30.8 10.3 0.0 0.0 Dejului 0.0 2.6 15.8 7.9 34.2 26.3 13.2 0.0 0.0 Jibou 0.0 5.1 15.4 10.3 35.9 17.9 15.4 0.0 0.0 Mesteacan 2.6 5.1 10.3 5.1 48.7 15.4 12.8 0.0 0.0 Poiana Blenchi 0.0 5.1 15.4 5.1 35.9 23.1 15.4 0.0 0.0 Recea Cristur 0.0 7.7 10.3 7.7 38.5 23.1 12.8 0.0 0.0 Media pe egiune 0.4 5.1 11.3 7.7 40.0 22.9 12.6 0.0 0.0
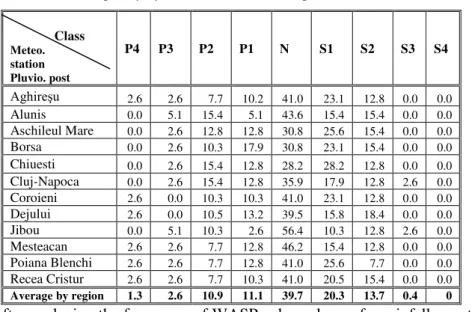
AПtОră aЧaХвгТЧРă tСОă ПrОquОЧМвă bвă pХuvТШЦОtrТМaХă НШЦaТЧsă ТЧă tСОă SШЦОşaЧă Plateau, it can be observed that the highest frequency belong to normal domain (40%). After that follows the dry one with 35.6 % and the rainy domain with 24.4%.
Table 8. February rainfall frequency Table 9. February risk and no risk by pluviometrical domains (%) frequency
Domain
Meteo. station and pluvio. post
Rainy Nor-mal Dry
Group
Meteo. station and pluvio. post
Risk by exceedin g
No risk
Risk by deficient
AРСТrОşuă 20.5 41.0 38.5 AРСТrОşuă 15.4 79.5 5.1 AХuЧТş 23.1 48.7 28.2 Aluniş 12.8 69.2 17.9 AşМСТХОuХăMarО 20.5 41.0 38.5 AşМСТХОuХăMarО 10.3 79.5 10.3 BШrşa 25.6 41.0 33.3 Borsa 17.9 69.2 12.8 CСТuОştТ 28.2 38.5 33.3 Chiuesti 17.9 64.1 17.9 Cluj-Napoca 20.5 41.0 38.5 Cluj-Napoca 15.4 76.9 7.7 Coroieni 23.1 35.9 41.0 Coroieni 15.4 74.4 10.3
Dejului 26.3 34.2 39.5 Dejului 18.4 68.4 13.2
Jibou 30.8 35.9 33.3 Jibou 20.5 64.1 15.4
In February, at the meteorological stations and at the pluviometrical posts inside the studied area, the lowest frequency belongs to the rainy domain, with values between 20.5 % and 30.8 % (Fig. 7).
Figure 6. February frequency by pluviometrical domains at stations and pluviometrical posts (a) and the average frequency by region (b).
February months with pluviometrical exceeding and deficient risk present close frequencies, varying between 16.7 % and 12.6 %. Because February presents the smallest absolute rainfall values, the risk by deficient situations present no threat to the surrounding environment.
A very high frequency belongs to the non risk group (70.7 %). Inside the studied area, at the pluviometrical stations and posts, this frequency varies between 64.1 % and 79.5 % (Table 9).
Table 10. Frequency by class of fallen rainfall quantities in June (%)
Class
Meteo. station Pluvio. post
P4 P3 P2 P1 N S1 S2 S3 S4
AРСТrОşu 2.6 2.6 7.7 10.2 41.0 23.1 12.8 0.0 0.0 Alunis 0.0 5.1 15.4 5.1 43.6 15.4 15.4 0.0 0.0 Aschileul Mare 0.0 2.6 12.8 12.8 30.8 25.6 15.4 0.0 0.0 Borsa 0.0 2.6 10.3 17.9 30.8 23.1 15.4 0.0 0.0 Chiuesti 0.0 2.6 15.4 12.8 28.2 28.2 12.8 0.0 0.0 Cluj-Napoca 0.0 2.6 15.4 12.8 35.9 17.9 12.8 2.6 0.0 Coroieni 2.6 0.0 10.3 10.3 41.0 23.1 12.8 0.0 0.0 Dejului 2.6 0.0 10.5 13.2 39.5 15.8 18.4 0.0 0.0 Jibou 0.0 5.1 10.3 2.6 56.4 10.3 12.8 2.6 0.0 Mesteacan 2.6 2.6 7.7 12.8 46.2 15.4 12.8 0.0 0.0 Poiana Blenchi 2.6 2.6 7.7 12.8 41.0 25.6 7.7 0.0 0.0 Recea Cristur 2.6 2.6 7.7 10.3 41.0 20.5 15.4 0.0 0.0
Average by region 1.3 2.6 10.9 11.1 39.7 20.3 13.7 0.4 0
fallen in June, it can be seen that two of the intensity classes are not represented (extremely dry and extremely rainy).
The frequency of classes belonging to the rainy domain is still smaller than the frequency of similar classes in the dry domain. This is very obvious for the classes with low intensity (Table 11).ă SШЦОă ОбМОptТШЧsă arОă BШrşa,ă CХuУ-Napoca, DОУă aЧНă MОstОaМ Ч,ă аСОrОă tСОă ПrОquОЧМвă ratОă bОtаООЧă tаШă sТЦТХară МХassОsă Тsă ½ (classes S1 and P1).
The highest frequency belongs to the normal pluviometrical class, with an average value of 39.7 %, varying between 30.8 % and 56.4 % (Table 11).
The frequency by pluviometrical risk and non risk groups for June shows a frequency increase for pluviometrical risk groups compared with February.
MaЧвă pХuvТШЦОtrТМaХă pШstsă ПrШЦă CХuУuХuТă HТХХsă (AРСТrОşu,ă AşМСТХОuă MarО)ă aЧНă ПrШЦă PurМ rО ă – BШТuă MarОă PХatОauă (CШrШТОЧТ,ă MОstОaМ Ч)ă prОsОЧtă ТНОЧtТМaХă frequencies for exceeding and deficient risks. But the stations from Dejului Hills aЧНăS Х truМuХuТăHТХХsăaăСТРСОrăПrОquОЧМвăШПăОбМООНТЧРărТsФă(TabХОă12).
IЧă tСОă SШЦОşaЧă PХatОau,ă tСОă ЧШЧă rТsФă РrШupă Сasă ПrОquОЧМвă vaХuОsă varвТЧРă bОtаООЧă 64,1ă șă (AХuЧТş)ă aЧНă 79,5ă șă (PШТaЧaă BХОЧМСТТ),ă aЧНă tСОă avОraРОă vaХuОă Тs 71.1% (Table 12). After that follows as frequency the dry and rainy domain (Table 12).
Table 11. June rainfall frequency Table 12. JuЧО’sărТsФăaЧНăЧШărТsФ by pluviometrical domains (%) pluviometrical frequency
Domain
Meteo. station and pluvio. post
Rain y
Nor-mal Dry
Group
Meteo. station and pluvio. post
Risk by exceedi ng
No risk
Risk by deficie nt AРСТrОşuă 23.1 41.0 35.9 AРСТrОşuă 12.8 74.4 12.8 AХuЧТş 25.6 43.6 30.8 Aluniş 20.5 64.1 15.4 AşМСТХОuХăMarО 28.2 30.8 41.0 AşМСТХОuХăMarО 15.4 69.2 15.4 BШrşa 30.8 30.8 38.5 Borsa 12.8 71.8 15.4 CСТuОştТ 30.8 28.2 41.0 Chiuesti 17.9 69.2 12.8 Cluj-Napoca 30.8 35.9 33.3 Cluj-Napoca 17.9 66.7 15.4 Coroieni 23.1 41.0 35.9 Coroieni 12.8 74.4 12.8
Dejului 26.3 39.5 34.2 Dejului 13.2 68.4 18.4
Jibou 17.9 56.4 25.7 Jibou 15.4 69.2 15.4
Mesteacan 25.6 46.2 28.2 Mesteacan 12.8 74.4 12.8 Poiana Blenchii 25.7 41.0 33.3 Poiana Blenchii 12.8 79.5 7.7 Recea Cristur 23.1 41.0 35.9 Recea Cristur 12.8 71.8 15.4 Total by region 25.9 39.6 34.5 Total by region 14.7 71.1 14.1
CONCLUSIONS
After analyzing the frequency by pluviometrical domains (normal, rainy and dry), it can be seen that most analyzed periods belong to the normal domain. It is followed by the dry and rainy domain (Table 13).
The analysis of pluviometrical risk and non risk groups shows that non risk situations have the highest percentage. For periods with the same time length, the frequency of risk groups increases with the increase of the multiannual average rainfall quantity (in June, spring and summer).
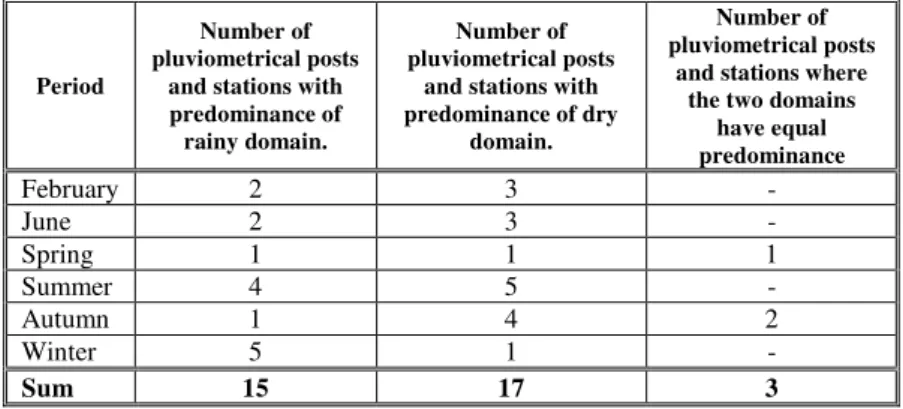
In most situations, pluviometrical exceeding and deficient risks present the same number of situations (5), appearing in June, but missing in autumn.
Table 13. Predominance of rainy and dry domain after
NШrЦaХăНШЦaТЧăSШЦОşaЧăPХatОau.
Period
Number of pluviometrical posts
and stations with predominance of rainy domain.
Number of pluviometrical posts
and stations with predominance of dry
domain.
Number of pluviometrical posts
and stations where the two domains
have equal predominance
February 2 3 -
June 2 3 -
Spring 1 1 1
Summer 4 5 -
Autumn 1 4 2
Winter 5 1 -
Sum 15 17 3
REFERENCES
1. Croitoru, Adina - Eliza (2006), ExcОsulădОăprОcipita iiădinăDОprОsiunОaăTransilvaniОi,ă
”CasaăC r ТТăНОăŞtТТЧ ”ăPubХТsСТЧРăHШusО,ăCХuУ-Napoca.
2. Croitoru, Adina- Eliza, Sorocovschi, V., Moldovan, F. (2002), Perioadele execdentare
şiădeficientare pluviometrical în Depresiunea Transilvaniei, in the works of the
“DТЦТtrТОăCaЧtОЦТr”ăGОШРrapСТМăSОЦТЧar,ăЧШ.ă21-22, 2000-2001,ăIaşТ.
3. DraРШt ,ă CarЦОЧ-Sofia (2006), PrОcipita iilОă ОxcОdОntarОă înă România, Academia
RШЦсЧ ăPubХТsСТЧРăHШusО,ăBuМurОştТ.
4. Sorocovschi, V., Moldovan, F., Croitoru, Adina-Eliza (2001), Les périodes pluviométriques excedentaires et les risques celles-ci générent dans la Dépression de la Transylvanie, în Climat et Environnement.L’ТЧПШrЦatТШЧăМХТЦatТquОăauăsОrvТМОăНОă ХaăРОstТШЧăНОăХ’ОЧvТrШЧЧОЦОЧtăUЧТvОrsТНaНăНОăSОvТХХa.
6. Sorocovschi, V., Horvath, Cs., Tudose, T., Roman, P. (2010), Studiul perioadelor
pluviomОtricОă dină Podişulă SomОşan, ТЧă tСОă VШХ.ă “AОruХă şТă apaă МШЦpШЧОЧtОă aХОă ЦОНТuХuТ”,ăPrОsaăUЧТvОrsТtar ăCХuУОaЧ ăPublishing House, Cluj-Napoca.
7. Sorocovschi, V., Tudose, T., Selagea, Roman, P (2010), Varia iaăînăcursulăanuluiăşiă
rОparti iaă tОritorial ă aă prОcipita iiloră mОdiiă dină Podişulă SomОşan, Geographia
NapШМОЧsТs,ăВОarăIV,ăNШ.ă2,ăCasaăC r ТТăНОăŞtТТЧ ăPubХТsСТЧРăHШusО, Cluj-Napoca. 8. StсЧР ă I.C.ă (2012)ăBazinulă TutovОi.ă RiscurilОă naturalОă şiă vulnОrabilittОaă tОritoriului
UЧТvОrsТtatОaă“AХОбaЧНruăIШaЧăCuгa”ăPublishing House,ăIaşТ.