online | memorias.ioc.fiocruz.br Leprosy is a chronic infectious disease that can lead
to physical disability, social stigma and great suffering. As the disease is transmitted person to person, it has re-mained endemic in some developing countries. From biblical times to the modern period, leprosy has been de-scribed as a horrifying disease due to the physical appear-ance of infected individuals. Leprosy results in disfigured limbs and creates marks of cultural dishonour that have caused “lepers” to remain on the darker side of society.
Confirmed reports of leprosy first appeared approxi-mately 600 BC in sacred Indian texts that describe an affected individual’s loss of finger and toe sensations. However, the disease originated in Eastern Africa or the Near East and spread with successive human migrations. Europeans and/or North Africans then introduced lep-rosy into West Africa and the Americas within the past 500 years (Monot 2005).
Historically, leprosy was associated with social ex-clusion and isolation in leper colonies was considered the only instrument of control until the mid XX century. The social exclusion of those affected by the disease was, at first, based on the religious belief that the patients were impure. In the second half of XIX century, which was also known as the bacteriologic era, the hypothesis that leprosy was caused by a transmissible agent con-flicted with the alternative hypothesis of leprosy being a hereditary disease. Mycobacterium hansen was the first microorganism identified as a cause of disease in 1873, which provided a scientific basis for patients’ isolation. In the 1940’s, the introduction of treatment with dapsone brought hope for a cure and disease control, but for
mul-tibacillary (MB) leprosy patients, this progress meant lifelong treatment. Then, it was not until the 1970’s that multidrug therapy (MDT) with rifampicin provided an effective cure for MB cases after many years of treat-ment. In 1981, which was 20 years after the international medical practice abandoned single-drug therapy for tu-berculosis, the WHO recommended a standard leprosy treatment that consisted of two regimens: rifampicin and dapsone over six months for PB leprosy and rifampicin, clofazimine and dapsone over 24 months for MB leprosy or until skins smears became negative.
In May 1991, the 44th World Health Assembly ad-opted resolution WHA44.9, which committed the World Health Organization (WHO) to attaining global elimina-tion of leprosy by the year 2000. The goal was to reduce the known prevalence of leprosy to below 1 in 10,000 inhabitants. Furthermore, the implementation of MDT turned a previously lifelong disease into a curable one. Thus, given the resulting shorter disease duration, a rapid and significant reduction of the known prevalence was anticipated, along with a reduction of the burden of leprosy on health systems.
WHO’s Secretariat also predicted an important in-cidence decrease to be reflected in case detection rate (CDR) (Nordeen 1991), despite the absence of any previ-ous evidence of huge impact on transmission in conse-quence of leprosy or tuberculosis isolation or treatment programs. The target of elimination of leprosy as a pub-lic health problem through universal and efficient MDT assumed the reduction of health care period as well as the reduction in transmission.
In 1997, the WHO recommended reducing MB leprosy treatment from 24-12 months after the 7th Expert Com-mittee Meeting stated in its final report that “based on the available information, it is possible that the duration of the current MDT regimen for multibacillary leprosy could be shortened to 12 months” (p. 37) (WHO 1998). This new reduction in disease duration enabled the global elimina-tion target to be achieved by the end of the year 2000. + Corresponding author: [email protected]
Received 14 March 2012 Accepted 11 July 2012
Leprosy frequency in the world, 1999-2010
Maria Lúcia Fernandes Penna1/+, Gerson Oliveira Penna2
1Departamento de Epidemiologia e Bioestatística, Universidade Federal Fluminense, Niterói, RJ, Brasil 2Núcleo de Medicina Tropical, Universidade de Brasília, Brasília, DF, Brasil
In 1991, the World Health Organization (WHO) committed to reducing the prevalence of leprosy to below 1 in 10,000 inhabitants by 2000. Significant improvements in leprosy control have occurred, but leprosy remains a public health problem in many countries due to its high incidence and rate of transmission. This paper reviews data published by the WHO in the years 2000, 2005 and 2010. These data sets included 148 countries or territories that reported to the WHO at least once. Only four countries reported higher prevalence rates in 2010 than in 2000 and eight reported higher case detection rate (CDR) in 2009 than in 1999. Prevalence rate reductions were greater for the first five-year period examined, while CDR reductions were greater in the second five-year period. Thirty-six countries and territories reported at least one prevalence value higher than 1 per 10,000 inhabitants and 32 reported at least one CDR value higher than 9 per 100,000 inhabitants. A total of 39 countries fit at least one of these criteria and all were located in tropical regions.
Significant improvements have occurred in the last two decades, as leprosy is no longer a lifelong disease and leprosy colonies for patient isolation are part of pub-lic health history. However, leprosy remains a pubpub-lic health problem in many parts of the world due to its high incidence and transmission rate.
From 1990-1999, the CDR increased in all WHO re-gions except for the Eastern Mediterranean and Western Pacific regions, where the CDR has remained less than 1.6 per 100 thousand inhabitants since 1990 (WHO 2000).
In a scenario where a highly efficacious treatment and government commitment to provide access to drugs are present, once extensive treatment availability is reached, the hidden prevalence cases are mainly responsible for transmission and the known prevalence value variation in time will reflect the detection rate behaviour over time.
Hence, reducing transmission presupposes timely case detection, to reduce the duration of the disease prior to diagnosis. As timely case detection may raise the known value of prevalence in the short term, the known preva-lence value measures the disease burden on the health system, rather than the community, at a specific point in time and its variation reflects mainly operational, rather than epidemiological, trends. As a result, emphasis has shifted from using prevalence to CDR in recent years as the main epidemiological indicator for leprosy.
Data on leprosy are reported to the WHO from most countries except for those in the European Region. In this paper, we intend to review leprosy occurrence in the world based on data published by the WHO in the years 2000, 2005 and 2010.
MATERIALS AND METHODS
We evaluated data published in the Weekly Epidemi-ological Record (WER) in 2000, 2005 and 2010 (WHO 2000, 2005, 2010). The WER presented rates of preva-lence per 10,000 inhabitants and CDRs per 100,000 inhabitants in 2000 and 2005, but only the numbers of prevalent cases and newly detected cases were pub-lished in 2010. Rates for this year were estimated using population data from the United Nations Population Di-vision (UN 2011).
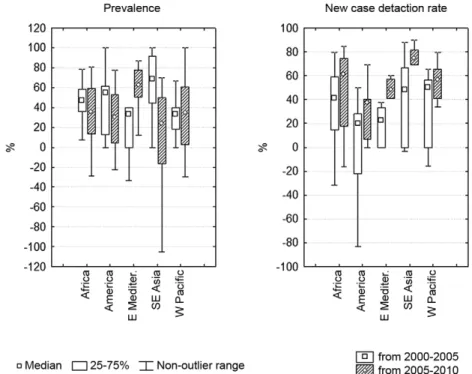
We estimated the relative reductions in the preva-lence rate and CDR in each five-year period. Negative numbers were used to represent a relative increase dur-ing each period and the values are presented as percent-ages. To depict data from the reporting countries, we used box-whisker plots. The Pearson correlation coeffi-cient was used to evaluate collinearity of different indi-cators, i.e., how they varied together.
We classified countries as highly endemic if they had reported a prevalence rate higher than 1 per 10,000 inhabitants or a CDR higher than 9 per 100,000 inhabit-ants in one of the years studied.
RESULTS
The data sets included 148 countries or territories that had reported to the WHO in at least in one of the years studied; of these, 63 reported in 2000, 112 reported in 2005 and 141 reported in 2010. Published data repre-sents the prevalence rate on January 1 of the
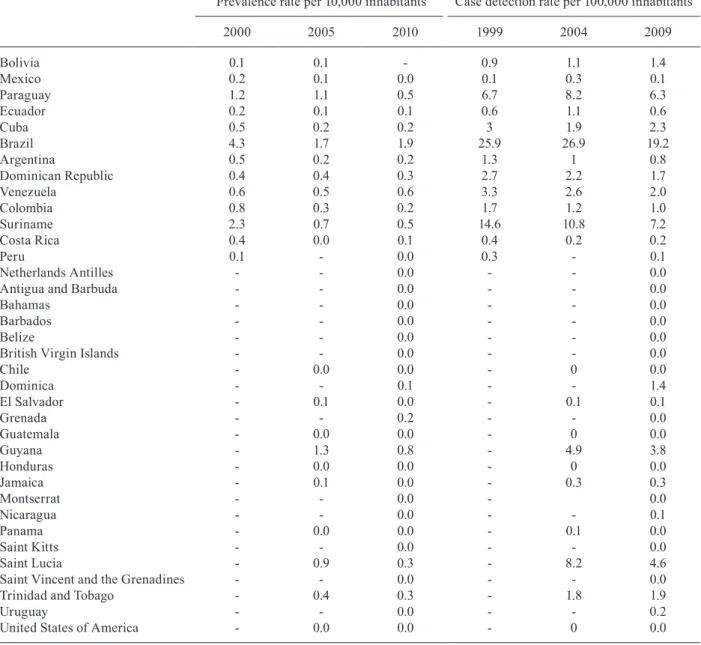
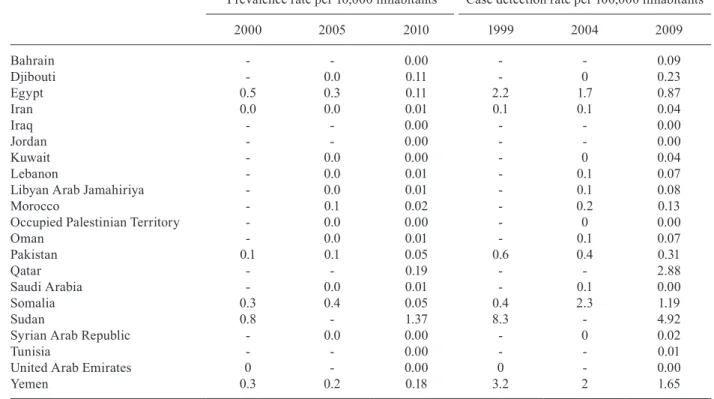
publica-tion year and the CDR for the previous year. Tables I-V present the prevalence rates and CDRs of leprosy in the selected years by region.
Only four countries reported a higher prevalence rate in 2010 than in 2000, including Liberia, Sudan, Sri Lanka and Malawi and eight countries reported a higher CDR in 2009 than 1999, including Somalia, Congo, Zambia, Liberia, Bolivia, Malawi, Guinea-Bissau and Mexico.
Fig. 1 shows the box-whisker plots of the relative per cent reduction in the prevalence rate and the CDR over each five-year period. Notably, the prevalence rate reduc-tion was larger in the first five-year period, while the CDR reduction was larger in the second five-year period.
Table VI presents the correlation coefficient of the prevalence data and CDR data. There were low correla-tions between the 2000 prevalence and the 1999 CDR and between the 2010 prevalence and the 2009 CDR. These low correlations suggest important variations in mean disease duration, which likely result from the dis-tribution of disease forms and from differential compli-ance to the one-year treatment regimen recommended by the WHO for MB cases.
In contrast, the correlation coefficient between the 2005 prevalence and the 2004 CDR was very high at 0.94, which suggested a very rigid prevalent case defini-tion and uniform disease duradefini-tion. However, this corre-lation was not maintained in the correcorre-lation between the prevalence decrease and the CDR decrease in the follow-ing five-year period, which can be seen in Table VII.
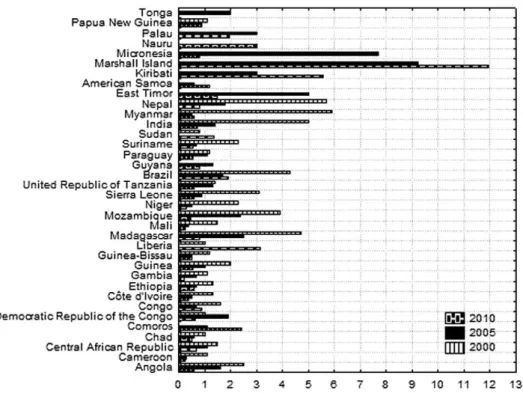
Fig. 2 shows prevalence data from the 36 countries and territories with at least one prevalence value higher than 1 per 10,000 inhabitants. According to WHO Re-gion, 52.8% of these countries were in the Africa ReRe-gion, 11.1% were in the Americas, 22.2% were in the Western Pacific Region, 11.1% were in the Southeast Asia Region and 2.8% were in the Eastern Mediterranean Region. Fig. 3 shows the CDR and prevalence data from countries with at least one CDR value greater than 9 per 100,000 inhabitants. Of these 32 countries, 56.3% were located in the African Region, 6.3% were in the Americas, 18.8% were in the Western Pacific Region and 18.8% were in the Southeast Asia Region. Only 10 countries met only one of the high-endemicity criteria. Benin, Bangladesh and Sri Lanka reported CDR above 9 per 100,000 inhabitants, but the prevalence values for these countries were all below 1 per 10,000 inhabitants. The highest reported prevalence values were 0.8 per 10,000 inhabitants in 2000 in Benin, 0.9 per 10,000 inhabitants in 2000 in Bangladesh and 0.89 per 10,000 inhabitants in 2010 in Sri Lanka.
hypoth-esis that the inclusion of data from South Sudan raised the prevalence by 0.8 in 2000 was not supported by the CDR reported in this period (8.3 per 100,000 inhabitants in 1999 and 4.5 per 100,000 inhabitants in 2009, a reduc-tion of 46%). Paraguay reported high prevalence rates in 2000 and 2005 and only demonstrated a small reduction in the CDR (5.8%) from 1999-2009. Ethiopia, which had
a high prevalence in 2000, showed a 26% reduction in the CDR to reach a rate of 5.4 per 100,000 inhabitants in 2010. Guinea-Bissau also had a high prevalence in 2000 and showed an 86.5% increase in the CDR from 1999-2009. Moreover, Guiana had a high prevalence in 2005, but demonstrated a 29.9% reduction in the CDR from 2004-2009 (no data available for 2000).
TABLE I
Prevalence and detection of leprosy - Africa (WHO Region)
Prevalence rate per 10,000 inhabitants Case detection rate per 100,000 inhabitants
2000 2005 2010 1999 2004 2009
Algeria - 0.0 0.0 - 0 0.0
Angola 2.5 1.6 0.6 14.9 13.6 5.0
Benin 0.8 0.4 0.2 10.2 5.5 2.9
Burkina Faso 0.8 0.8 0.2 7.5 8.6 2.6
Burundi - 0.5 0.3 - 2.7 3.4
Cameroon 1.1 0.3 0.3 9.1 2.6 2.4
Central African Republic 1.5 1.1 0.7 11.8 10.1 5.7
Chad 1 0.6 0.5 14.5 4 4.4
Comoros - 1.1 2.4 - 18.9 44.3
Democratic Republic of the Congo 1 1.9 0.7 8.6 21.1 7.9
Congo 1.6 0.7 0.9 1.8 10.7 3.7
Côte d’Ivoire 1.3 0.5 0.4 10.9 6 4.5
Ethiopia 1.3 0.7 0.6 7.4 6.3 5.4
Gabon - - 0.2 - - 1.7
Gambia 1.1 0.7 0.2 9.4 4.7 2.0
Ghana 0.7 0.3 0.3 8.4 3.8 2.6
Guinea 2 1.0 0.5 32 11.19 6.5
Equatorial Guinea - - 0.5 - - 3.4
Guinea-Bissau 1.2 0.5 0.5 4.6 2.7 5.0
Kenya 0.2 0.1 0.1 0.8 0.4 0.4
Lesotho - 0.0 0.0 - 0.2 0.2
Liberia 1 - 3.1 6 - 10.8
Madagascar 4.7 2.5 0.8 51.6 20.5 7.8
Malawi 0.5 - 0.5 4.5 - 5.2
Mali 1.5 0.4 0.3 14.7 3 2.3
Mauritania - - 0.1 - - 1.0
Mozambique 3.9 2.4 0.5 28.7 22 5.2
Namibia - 0.0 0.0 - 0.4 0.2
Niger 2.3 0.5 0.3 18.2 5.6 3.7
Nigeria 0.6 0.4 0.3 6.3 4.1 2.7
Rwanda - - 0.0 - - 0.3
Senegal 0.5 0.4 0.3 5.1 3.7 2.2
Sierra Leone 3.1 0.9 0.6 8.5 11.2 8.0
United Republic of Tanzania 1.4 1.3 0.6 15.4 13.8 6.1
Togo 0.7 0.2 0.2 7.1 2.9 2.7
Uganda 0.5 0.3 0.1 4.1 2.4 1.1
Zambia 0.8 - 0.5 1.9 - 3.5
Zimbabwe - - 0.0 - - 0.0
Botswana - 0.1 - - 0.3
-Cabo Verde - 0.3 - - 0.6
-SaoTomé-et-Principe - 0.0 - - 0
-Seychelles - 0.1 - - 0
-South Africa - 0.0 - - 0.1
-DISCUSSION
In the year 2000, the WER only published data on leprosy from countries with more than 100 cases. The coverage of available country data became larger in 2005 and 2010, which enabled an improved evaluation of leprosy occurrence in the world.
Although data reported to WHO are not completely reliable, as published elsewhere (Murdur 2005, Penna & Penna 2007), and the drop of 29% from 2003-2004 of India’s CDR (WHO 2005) suggests, the analysis of data published by WHO in the selected years may shed light on leprosy distribution in the world. Year 2000 was the year established by the WHO for attaining the global elimination target, 2005 the year established by WHO
secretariat for attaining the more radical target of reach-ing elimination at national and then sub-national levels, 2010 is the year when more recent data were published.
The greater prevalence reduction in the first five-year time period was expected, as prevalence reduction that is based on disease duration diminution through treat-ment reaches an operational limit when MDT coverage reaches 100%. The backlog of known cases to be treated and cured by MDT, which was the main issue related to leprosy control programmes in the eighties and early nineties, has disappeared in the last decade, as treatment has been aimed mainly at newly detected cases. The high correlation between the 2005 prevalence rate and the 2004 CDR indicates that mean disease duration is very homogeneous among the reporting countries and this
TABLE II
Prevalence and detection of leprosy - Americas
Prevalence rate per 10,000 inhabitants Case detection rate per 100,000 inhabitants
2000 2005 2010 1999 2004 2009
Bolivia 0.1 0.1 - 0.9 1.1 1.4
Mexico 0.2 0.1 0.0 0.1 0.3 0.1
Paraguay 1.2 1.1 0.5 6.7 8.2 6.3
Ecuador 0.2 0.1 0.1 0.6 1.1 0.6
Cuba 0.5 0.2 0.2 3 1.9 2.3
Brazil 4.3 1.7 1.9 25.9 26.9 19.2
Argentina 0.5 0.2 0.2 1.3 1 0.8
Dominican Republic 0.4 0.4 0.3 2.7 2.2 1.7
Venezuela 0.6 0.5 0.6 3.3 2.6 2.0
Colombia 0.8 0.3 0.2 1.7 1.2 1.0
Suriname 2.3 0.7 0.5 14.6 10.8 7.2
Costa Rica 0.4 0.0 0.1 0.4 0.2 0.2
Peru 0.1 - 0.0 0.3 - 0.1
Netherlands Antilles - - 0.0 - - 0.0
Antigua and Barbuda - - 0.0 - - 0.0
Bahamas - - 0.0 - - 0.0
Barbados - - 0.0 - - 0.0
Belize - - 0.0 - - 0.0
British Virgin Islands - - 0.0 - - 0.0
Chile - 0.0 0.0 - 0 0.0
Dominica - - 0.1 - - 1.4
El Salvador - 0.1 0.0 - 0.1 0.1
Grenada - - 0.2 - - 0.0
Guatemala - 0.0 0.0 - 0 0.0
Guyana - 1.3 0.8 - 4.9 3.8
Honduras - 0.0 0.0 - 0 0.0
Jamaica - 0.1 0.0 - 0.3 0.3
Montserrat - - 0.0 - 0.0
Nicaragua - - 0.0 - - 0.1
Panama - 0.0 0.0 - 0.1 0.0
Saint Kitts - - 0.0 - - 0.0
Saint Lucia - 0.9 0.3 - 8.2 4.6
Saint Vincent and the Grenadines - - 0.0 - - 0.0
Trinidad and Tobago - 0.4 0.3 - 1.8 1.9
Uruguay - - 0.0 - - 0.2
finding is likely a result of very high compliance to the WHO-recommended MDT. However, the lack of a cor-relation between the decrease in the prevalence rate and the CDR between 2005 and 2010 does not support this hypothesis and an alternative hypothesis is that this cor-relation was a consequence of changes to the prevalent case definition, i.e., the discharge of newly diagnosed cases turned prevalence into a linear function of CDR.
The criteria we used to classify a country as high-ly endemic consisted of the prevalence cut-point used by the WHO to declare leprosy eliminated as a public health problem and a similar criterion for CDR has been reported. Our criterion was established in accordance with a health surveillance perspective that used data to monitor recent M. hansen circulation in the community. The highly endemic countries in our study were located
TABLE IV
Prevalence and detection of leprosy - Southeast Asia (WHO Region)
Prevalence rate per 10,000 inhabitants Case detection rate per 100,000 inhabitants
2000 2005 2010 1999 2004 2009
Afghanistan 0.1 0.0 - 0.1 0.1
-Bangladesh 0.9 0.5 0.28 11.4 5.9 3.54
Bhutan - 0.2 0.41 - 0.8 1.67
East Timor - 5.0 1.49 - 41.9 14.51
India 5 1.4 0.71 54.3 23.9 11.00
Indonesia - 0.9 0.87 - 7.5 7.22
Maldives - 0.2 0.22 - 2.5 3.51
Myanmar 5.9 0.5 0.58 62.9 7.5 6.56
Nepal 5.7 1.8 0.81 78.7 26.2 14.86
Sri Lanka 0.7 0.7 0.87 9.4 9.7 8.94
Thailand 0.4 0.2 0.11 1.4 1 0.43
TABLE III
Prevalence and detection of leprosy - Eastern Mediterranean (WHO Region)
Prevalence rate per 10,000 inhabitants Case detection rate per 100,000 inhabitants
2000 2005 2010 1999 2004 2009
Bahrain - - 0.00 - - 0.09
Djibouti - 0.0 0.11 - 0 0.23
Egypt 0.5 0.3 0.11 2.2 1.7 0.87
Iran 0.0 0.0 0.01 0.1 0.1 0.04
Iraq - - 0.00 - - 0.00
Jordan - - 0.00 - - 0.00
Kuwait - 0.0 0.00 - 0 0.04
Lebanon - 0.0 0.01 - 0.1 0.07
Libyan Arab Jamahiriya - 0.0 0.01 - 0.1 0.08
Morocco - 0.1 0.02 - 0.2 0.13
Occupied Palestinian Territory - 0.0 0.00 - 0 0.00
Oman - 0.0 0.01 - 0.1 0.07
Pakistan 0.1 0.1 0.05 0.6 0.4 0.31
Qatar - - 0.19 - - 2.88
Saudi Arabia - 0.0 0.01 - 0.1 0.00
Somalia 0.3 0.4 0.05 0.4 2.3 1.19
Sudan 0.8 - 1.37 8.3 - 4.92
Syrian Arab Republic - 0.0 0.00 - 0 0.02
Tunisia - - 0.00 - - 0.01
United Arab Emirates 0 - 0.00 0 - 0.00
in the tropical areas of South America, Africa, the In-dian subcontinent and Pacific and InIn-dian Ocean Islands and many of these countries consist of small islands or regions with a very humid climate (Fig. 4).
The leprosy problem in many Pacific islands is well researched. Worth (1996) documented the end of the lep-rosy epidemic in Hawaii, where the CDR decreased 80% from 1900-1950 among Hawaiians and part-Hawaiians, which represents a mean annual reduction of 3.5% per year. This paper also noted the introduction of leprosy into Nauru and Micronesia in the 1920’s. In 1999, Ha-waii had a CDR of 1.8 cases per 100,000 inhabitants, although imported cases from the Marshall Islands and Micronesia, where leprosy still produces many cases, are still diagnosed in Hawaii (Ong et al. 1999) and other
United States of America (USA) states (Woodall et al. 2011). No secondary cases reaching natives have been linked to these imported cases in Hawaii or USA and this break in transmission points to the importance of socioeconomic factors in leprosy transmission.
This epidemiological pattern raises the question of how leprosy persistence occurs in these islands, as most infectious agents that are transmitted by direct contact, i.e., from person to person, do not persist in very small and isolated populations. Leprosy persistence may be explained by the lifelong duration of leprosy disease in MB cases if the infection is not treated; however, if this mechanism were responsible for maintaining leprosy transmission in small populations, patient isolation would have a large impact on disease dynamics. Although some
TABLE V
Prevalence and detection of leprosy - Western Pacific (WHO Region)
Prevalence rate per 10,000 inhabitants Case detection rate per 100,000 inhabitants
2000 2005 2010 1999 2004 2009
American Samoa - 0.6 1.19 - 4.8 4.48
Australia - 0.0 0.00 - 0 0.02
Brunei Darussalam - - 0.05 - - 0.51
Cambodia 0.5 0.3 0.20 7.2 3.3 2.50
China 0 0.0 0.02 0.2 0.1 0.12
China - Hong Kong SAR - 0.1 0.03 - 0.1 0.07
China - Macao SAR - 0.0 0.00 - 0.4 0.00
Cook Islands - 0.0 0.00 - 0 0.00
Fiji - 0.0 0.02 - 0.4 0.23
French Polynesia - - 0.37 - - 3.33
Guam - - 0.27 - - 3.34
Japan - 0.0 0.00 - 0 0.00
Kiribati - 3.0 5.56 - 66 95.29
Lao 0.5 0.4 0.15 3.2 3.7 1.63
Malaysia 0.5 0.3 0.24 1 1 0.67
Marshall Island - 9.2 11.95 - 103.3 80.88
Micronesia - 7.7 0.81 - 139.1 22.77
Mongolia - 0.0 0.00 - 0 0.00
Nauru - - 3.00 - - 30.00
New Caledonia - 0.0 0.16 - 0.1 2.79
Niue - 0.0 0.00 - 0 0.00
North Mariana Islands - - 0.14 - - 0.00
Palau - 3.0 1.95 - 30 19.51
Papua New Guinea 1.1 0.9 0.90 15.5 5.4 6.47
Philippines 0.6 0.4 0.29 4.5 2.8 1.95
Pitcairn Islands - 0.0 - - 0
-Korea 0.1 0.1 0.06 0 0 0.01
Samoa - 0.4 0.22 - 5.4 2.72
Singapore - 0.0 0.02 - 0.1 0.16
Solomon Islands - 0.4 0.39 - 4.1 5.70
Tokelau - - 0.00 - - 0.00
Tonga - 2.0 0.00 - 1 0.00
Tuvalu - 0.0 0.67 - 0 0.00
Vanuatu - 0.5 0.21 - 1.4 2.13
Viet Nam 0.3 0.1 0.04 2.3 1 0.47
-impact on leprosy epidemiology has been attributed to isolation in Norway, the CDR decrease was slow (Irgens 1980). The long latent period of infection may explain this epidemiological characteristic and it also may ex-plain the slow CDR decrease caused mainly by the birth cohort effect, which states that individuals born in more recent years experience smaller risks of leprosy infection than older cohorts when transmission risk decreases. Ir-gens (1980) has described the birth cohort effect in Nor-way since the middle of the XIX century and Penna et al. (2012) described the same effect in the Brazilian state of Amazonas over the last 30 years. This birth cohort effect and the lack of an efficient way to detect and treat latency by chemoprophylaxis clearly reduces the probability of the complete disappearance of new leprosy cases in the medium term, as proposed by the WHO (2012).
Although the map in Fig. 4 poorly illustrates the lep-rosy situation in Pacific Ocean and Indian Ocean island countries and territories, this map clearly shows a belt of
highly endemic countries in tropical Africa. The Indian subcontinent is also a known area for high leprosy trans-mission and, in the Americas, the Amazon Region has been acknowledged as a highly endemic region since the beginning of the XX century (Penna et al. 2009).
Although the distribution of leprosy by country is in-teresting, we also know that leprosy is clustered in certain areas and subpopulations. However, improved knowledge of transmission mechanisms and human susceptibility is needed to support a control strategy that can have a sig-nificant impact on Mycobacterium leprae transmission. Socioeconomic development has a known impact on the epidemiological behaviour of leprosy and local transmis-sion of leprosy does not occur in developed countries.
In the USA, new cases in American-born individu-als attributed to local transmission occur in a delimited area of the Gulf Coast, mainly in the Mississippi delta. Moreover, recent work has shown that M. leprae can be found infecting both humans and wild nine-band
arma-TABLE VI
Correlations between reported indicators
Prevalence
Case detection rate
1999 2004 2009
2000 0.05 -0.00 -0.00
2005 0.20 0.94 0.67
2010 -0.00 -0.00 -0.03
TABLE VII
Correlations between relative declines of indicators
Prevalence decline
Case detection rate decline
1999-2004 2004-2009 1999-2009
2000-2005 0.34 - 0.01 0.34
2005-2010 - 0.03 0.09 0.06
2000-2010 0.04 0.03 0.38
dillos in this area (Truman et al. 2011) and leprosy trans-mission by wild fauna, even though the agent was first introduced into the Americas by humans, makes leprosy eradication impossible because this disease may persist
as a zoonosis. Wild armadillos naturally infected by lep-rosy have also been found in different Brazilian regions (Deps et al. 2007). A case-control study in Texas found a significant association between leprosy and contact
Fig. 2: prevalence data from countries with at least one prevalence report bigger than 1 per 10,000 habitants.
with armadillos, but a stronger association was found between leprosy and a history of living in Mexico (Clark et al. 2008). Furthermore, cases in African chimpanzees raise the possibility that these animals could maintain leprosy transmission in Africa (Suzuki et al. 2010).
Changes in leprosy magnitude in high-incidence areas will likely only be apparent after many years of work, but it is important to monitor this progress. Im-provements in health information systems are also im-portant to avoid the collection of unreliable data, as pre-viously highlighted by Fine (2006, 2008).
The Eighth WHO Expert Committee on Leprosy (WHO 2010) has recommended the use of a new indicator, the CDR of grade 2 disability cases (CDR-G2D) per one million inhabitants, arguing that it is more specific than the CDR. However, the CDR-G2D is less precise than the CDR due to small numbers in the numerator and this dif-ference will make it difficult to use for monitoring small areas, i.e., small countries and local control programmes. Moreover, the CDR-G2D is influenced by early and late diagnoses and by the total incidence of leprosy, as mea-sured by the total CDR. Interestingly, the health surveil-lance tradition aims to implement more sensitive indica-tors as a disease becomes rare, if the disease continues to be monitored. A new global goal of reaching a CDR-G2D of 1 per one million by 2020 has been suggested, which would mean obtaining a 9.12% reduction per year (Penna et al. 2011, Rodrigues & Lockwook 2011).
Since the complete genome sequence of M. leprae was published by Cole et al. (2001), new perspectives for research have been created (Mira et al. 2004). However, old questions about leprosy still need to be addressed (Scollard 2005), including the transmission mechanisms of M. leprae, how its metabolism imposes intracellular reproduction and impedes culture growing, the human immune response to infection that determines disease presentation in different forms and the process of leprosy reaction episodes. Further research will advance knowl-edge of this old disease, contribute to better targeted public health interventions and may make its eradication
from human populations feasible. Meanwhile, leprosy control should be based on early diagnosis and treatment, along with socioeconomic development that has a known impact on the epidemiological of leprosy behaviour.
REFERENCES
Clark BM, Murray CK, Horvath LL, Deye GA, Rasnake MS, Long-field RN 2008. Case-control study of armadillo contact and Han-sen’s disease. Am J Trop Med Hyg 78: 962-967.
Cole ST, Eiglmeier K, Parkhill J, James KD, Thomson NR, Wheeler PR, Honoré N, Garnier T, Churcher C, Harris D, Mungall K, Basham D, Brown D, Chillingworth T, Connor R, Davies RM, Devlin K, Duthoy S, Feltwell T, Fraser A, Hamlin N, Holroyd S, Hornsby T, Jagels K, Lacroix C, Maclean J, Moule S, Murphy L, Oliver K, Quail MA, Rajandream MA, Rutherford KM, Rut-ter S, Seeger K, Simon S, Simmonds M, Skelton J, Squares R, Squares S, Stevens K, Taylor K, Whitehead S, Woodward JR, Barrell BG 2001. Massive gene decay in the leprosy bacillus.
Nature 409: 1007-1011.
Deps PD, Antunes JM, Tomimori-Yamashita J 2007. Detection of
Mycobacterium leprae infection in wild nine-banded armadillos (Dasypus novemcinctus) using the rapid ML Flow test. Rev Soc Bras Med Trop 40: 86-87.
Fine PE 2006. Global leprosy statistics: a cause for pride or frustra-tion? Lepr Rev 77: 295-297.
Fine PE 2008. Leprosy’s global statistics - still room for improvement.
Lepr Rev 79: 235-238.
Irgens LM 1980. Leprosy in Norway. An epidemiological study based on a national patient registry. Lepr Rev 51: 1-130.
Mira MT, Alcais A, Nguyen VT, Moraes MO, Di Flumeri C, Vu HT 2004. Susceptibility to leprosy is associated with PARK2 and PACRG. Nature 427: 636-640.
Monot M, Honore N, Garnier T, Araoz R, Coppee JY, Lacroix C 2005. On the origin of leprosy. Science 308: 1040-1042.
Murdur G 2005. Doctors accuse India of massaging leprosy figures.
BMJ 330: 1104.
Nordeen SK 1991. Leprosy control through multidrug therapy (MDT).
Bull WHO 69: 263-269.
Ong AK, Frankel RI, Maruyama MH 1999. Cluster of leprosy cases in Kona, Hawaii: impact of the compact of free association. Int J Lepr Other Mycobact Dis 67: 13-18.
Penna ML, Pedrosa VL, dos Santos PE 2012. Leprosy decline in Ama- zonas state, Brazil. Trop Med Int Health 17: 244-246.
Penna ML, Penna GO 2007. Case detection and leprosy elimination in Brazil. Trop Med Int Health 12: 647-650.
Penna MLF, de Oliveira MLWR, Penna G 2009. Spatial distribution of leprosy in the Amazon Region of Brazil. Emerg Infect Dis 15: 650-652.
Penna MLF, Temporão JG, Grossi MAF, Penna GO 2011. Leprosy control: knowledge shall not be neglected. J Epidemiol Commu-nity Health 65: 473-474.
Rodrigues LC, Lockwook DNJ 2011. Leprosy now: epidemiology, prog-ress, challenges and research gaps. Lancet Infect Dis 11: 464-470.
Scollard DM 2005. Leprosy research declines but most of the basic questions remain unanswered. Int J Lepr Other Mycobact Dis 73: 25-27.
suggested in a case of a chimpanzee used for medical research.
J Clin Microbiol 48: 3432-3434.
Truman RW, Singh P, Sharma R, Busso P, Rougemont J, Paniz-Mondolfi 2011. Probable zoonotic leprosy in the southern United States. N Engl J Med 364: 1626-1633.
UN - United Nations 2010. World population prospects: the 2010 re-vision [CD-ROM]. Department of Economic and Social Affairs, Population Division 2011, New York.
WHO - World Health Organization 1998. WHO Expert Committee on Leprosy, WHO, Geneva, 43 pp.
WHO - World Health Organization 2000. Leprosy - global situation.
Wkly Epidemiol Rec 75: 226-231.
WHO - World Health Organization 2005. Global leprosy situation, 2005. Wkly Epidemiol Rec 80: 289-295.
WHO - World Health Organization 2010. Global leprosy situation, 2010. Wkly Epidemiol Rec 85: 337-348.
WHO - World Health Organization 2010. Leprosy (Hansen dis-ease). Report by the Secretariat, Executive Board 128th Session, EB128/16. Available from: apps.who.int/gb/ebwha/pdf_files/ EB128/B128_16-en.pdf.
WHO - World Health Organization 2012 Accelerating work to over-come the global impact of neglected tropical diseases - A road-map for implementation, WHO, Geneva, 15 pp.
Woodall P, Scollard D, Rajan L 2011. Hansen disease among Microne-sian and Marshallese persons living in the United States. Emerg Infect Dis 17: 1202-1208.