The choice between a five-point and a
ten-point scale in the framework of
customer satisfaction measurement
Pedro S. Coelho Susana P. Esteves New University of Lisbon
In marketing research, and particularly in the context of customer satisfaction measurement, we often try to measure attitudes and human perceptions. This raises a number of questions regarding appropriate scales to use, such as the number of response alternatives. Obviously, there is a trade-off between the desired response discrimination level and the effort that is demanded of the respondent to situate his or her answer in one of the scale categories. If this effort is too high it can reduce the quality of responses and increase the non-response rate. In the context of customer satisfaction measurement we compare a five-point and a ten-five-point numerical scale. The analysis includes the evaluation of non-response rates, response distribution, the ability to model customer satisfaction, as well as convergent, discriminant and nomological validity of constructs used in the ECSI (European Customer Satisfaction Index) model. Globally, results tend to favour the choice of the ten-point scale, which contradicts some conventional wisdom. Moreover, we conclude that in this context there are no effects of socio-demographic characteristics (namely educational level) on the ability of respondents to use each scale.
Introduction
In fact, in recent years some discussion has taken place among academics and practitioners regarding the appropriate number of response alternatives to use. It is usually accepted that a small number of points does not allow a good discrimination of responses (limiting the ability to find significant differences between segments) and may limit the data analysis methods that can be used. More points improve the data metric, enrich the possible data analyses and facilitate the calculation of covariances between variables, which are used in most multivariate data analysis methods. Obviously, there is a trade-off between the desired response discrimination level and the effort that is demanded of the respondent to locate his response in one of the scale categories. If this effort is too high it can reduce the quality of responses and increase the non-response rate. Some of the traditional guidelines suggest the use of a number of categories between three and nine (Stem & Noazin 1985; Malhotra & Birks 2003) and clearly the most used number of response alternatives is seven (Cox 1980). Motivational theorists have been arguing against questions with a large number of response alternatives, based on the fact that respondents may not be sufficiently motivated to make meaningful discriminations (Tourangeau 1984; Krosnick & Alwin 1989; Alwin 1991). Obviously the choice regarding the number of response alternatives depends on several factors, such as the nature of the phenomena being measured, the involvement of respondents in the phenomena, the socio-demographic characteristics of respondents and even the nature of the data collection methods.
In spite of these well-known ideas very little work has been done in trying to validate them. Particularly in the context of customer satisfaction measurement many authors have proposed the ten-point numerical scale (anchored in the extremes). This is the usual approach in the European
Customer Satisfaction Index (ECSI) (ECSI 1998; Ball et al. 2004) and in
the framework of the American Customer Satisfaction Index (ACSI)
(Fornell et al. 1996, 1998; Johnson et al. 2001). Nevertheless, some
practitioners have criticised this scale, arguing that respondents have difficulty discriminating answers using more than five points (particularly in a telephone survey) and that an odd number of points may be preferable in order to account for neutrality. According to these arguments a standard five-point scale would be a preferable choice over a ten-point scale.
This paper aims to compare a five-point and a ten-point numerical scale in the context of customer satisfaction measurement. The analysis includes the evaluation of non-response rates, response distribution, the ability to discriminate between attributes being measured, the ability to model customer satisfaction, as well as convergent, discriminant and nomological validity of constructs used in the ECSI model. Moreover, we investigate the effects of social-demographic characteristics on the ability of respondents to use each scale. The social-demographic analysis includes both the effects on response profile and the probability of non-response.
The structure of the paper is organised as follows. The Introduction presents the problem and the goals of the paper. In the next section we introduce the use of scales in attitude measurement, and approach the problem of choosing the number of response alternatives, referring to previous work in this context. The organisation of the empirical study is shown in the subsequent section. This presentation includes the ECSI model as well as the study design. The fourth section presents and analyses the main results obtained in the study. The final section discusses the main findings.
Number of scale points in attitude measurement
For instance, customer satisfaction and customer loyalty are considered antecedents of behaviours like customer attrition, customer acquisition and customer value. Attitude variables that can be found in typical surveys include things such as beliefs, preferences and intentions.
In surveys, attitude variables are often measured using rating scales. Among the major decisions when constructing a rating scale are the number of response alternatives and the use of an odd or even number of categories. The choice between attitude scales and particularly the choice regarding the number of response alternatives is not new in marketing theory, but there is clearly a lack of empirical work on this issue. Moreover, in published research there is little agreement about the optimal number of response alternatives (Neumann & Neumann 1981; Alwin 1997), or the use of an odd or even number of categories (Malhotra & Birks 2003). While several authors have concluded that there are no significant gains in using more than five response alternatives (Jenkins & Taber 1977; Stem & Noazin 1985; Converse & Presser 1986), others have favoured scales with more alternatives (up to 25) (Green & Rao 1970; Cox 1980; Alwin 1997). Nevertheless, most of the results tend to favour a solution with a number of alternatives between five and nine (Andrews & Withey 1976; Cox 1980; Neumann & Neumann 1981; Givon &
Shapira 1984; Cicchetti et al. 1985; Alwin & Krosnick 1991; Colman
et al. 1997).
Green and Rao (1970), comparing scales with two, three, six and eighteen response categories, recommend using at least six points and at least eight scales per variable. Nevertheless, they conclude that little information appears to be gained by increasing the number of response categories beyond six. Ramsay (1973), studying the effects of the number of response categories on precision of scale values, concluded that using seven categories provides almost as much precision as a scale requiring a continuous judgment. Jenkins and Taber (1977), using a Monte Carlo study to analyse composite scale reliability, conclude that reliability levels off after five response categories. Neumann and Neumann (1981) compared six rating scales of lengths between two and ten points. Although their conclusions favour the longer scales, they could not find significant differences between a seven-point and a ten-point scale in terms
of correlation and etacoefficients. Moreover they found that deviations of
they have not found any increase in reliability from using a number of categories above five, and detected a significant decrease in reliability
when using more than seven points. Cicchettiet al. (1985), using a Monte
Carlo simulation to access the extent to which the interrater reliability is affected by the number of scale points, concluded that, although reliability increases up to seven scale points, no substantial increases occur beyond that point. Nevertheless, conclusions are necessarily limited to the simulation parameters. Haley and Case (1979) have tested 13 attitude scales for agreement, discrimination among brands and response pattern, but their study did not offer much insight into the choice of the number of response alternatives within a same scale type. Givon and Shapira (1984) use a stochastic model to investigate the conjoint effect of the number of items and number of response alternatives on the sampling error of a composite scale estimator. They conclude that sampling error may be reduced, increasing the number of response alternatives up to five, seven or nine, depending on the number of items used. A review of the work done up until the beginning of the 1980s, regarding the optimal number of response alternatives, can be found in Cox (1980). The author concludes that there is no single number of response alternatives for a scale that is appropriate under all circumstances. Also, he concludes that no formula can be given to indicate what this number should be, even in a particular set of circumstances. Nevertheless, he establishes that scales with two or three response alternatives are generally inadequate and that the marginal return from using more than nine response alternatives is minimal. Consequently, he proposes that the optimal number of response alternatives is normally situated between five and nine. One exception is Alwin’s (1997) work, which compares seven- and eleven-category rating scales. His conclusions favour the eleven-point scale in terms of measurement precision, and reject the idea that the eleven-point scale is more vulnerable to measurement errors.
Description of the study
The ECSI model
The European Customer Satisfaction Index (ECSI) appeared in 1999 and is adapted from the Swedish Customer Satisfaction Index (Fornell 1992)
and the ACSI (American Customer Satisfaction Index) (Fornell et al.
(ECSI 1998; Cassel & Eklof 2001; Vilares & Coelho 2004). It has been validated across a number of European countries and many industries, such as insurance, mobile phones, fixed phones, carbonated soft drinks, public transportation, retail banking, cable TV, supermarkets, postal services, food products and public service.
The ECSI model is composed of two sub-models: the structural model and the measurement model. The structural model defines the relationships between the latent variables and is represented in Figure 1. Customer satisfaction is the central variable of this model, having as antecedents the image of the company, customer expectations, perceived quality of products and services, and perceived value (where the relation between quality and price is measured). As consequences of customer satisfaction there are two variables: complaints and loyalty.
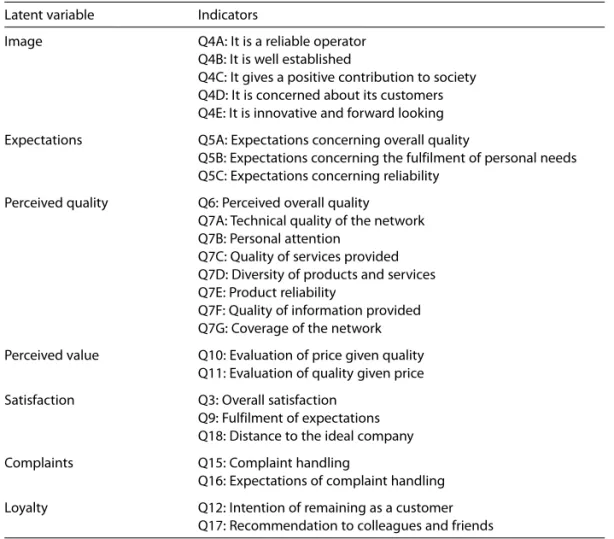
The measurement model includes the relations between the latent or non-observable variables and the observed indicators that correspond to survey questions (Table 1). Within this model we assume that the relationships between the latent variables and the observed indicators are all of the reflective nature (i.e. the indicators are assumed to be reflex of the latent variables).
Figure 1 ECSI structural model
Complaints Loyalty Image
Expectations
Perceived quality
Perceived value
PLS (Partial Least Squares) was used to estimate this model using two data sets obtained as explained in the next section. The methodology PLS applied to ECSI is presented in detail by several authors (e.g. ECSI 1998;
Casselet al. 2000).
Data
Data came from a survey corresponding to the 2004 wave of ECSI-Portugal (the Portuguese Customer Satisfaction Index). The selection of respondents follows the criteria defined in ECSI (1998). Data collection took place in November and December 2004, through telephone interviews supported by a CATI system. The same questionnaire was administered to both samples, but for one sample we used a five-point
Table 1 Indicators of each latent variable
Latent variable Indicators
Image Q4A: It is a reliable operator Q4B: It is well established
Q4C: It gives a positive contribution to society Q4D: It is concerned about its customers Q4E: It is innovative and forward looking
Expectations Q5A: Expectations concerning overall quality
Q5B: Expectations concerning the fulfilment of personal needs Q5C: Expectations concerning reliability
Perceived quality Q6: Perceived overall quality Q7A: Technical quality of the network Q7B: Personal attention
Q7C: Quality of services provided Q7D: Diversity of products and services Q7E: Product reliability
Q7F: Quality of information provided Q7G: Coverage of the network
Perceived value Q10: Evaluation of price given quality Q11: Evaluation of quality given price
Satisfaction Q3: Overall satisfaction Q9: Fulfilment of expectations Q18: Distance to the ideal company
Complaints Q15: Complaint handling
Q16: Expectations of complaint handling
scale and for the other a ten-point scale (anchored in the extremes).1 The
two scales are both numerical, with the same labels on the extreme points. Therefore, the only difference between them is the number of response alternatives. The questionnaire is the standard questionnaire used in ECSI-Portugal for the mobile telecommunications industry. The questionnaire includes a set of questions regarding the seven constructs of a structural satisfaction model (image, expectations, perceived quality, perceived value, satisfaction, complaints, and loyalty), plus a set of socio-demographic questions. The sample size was 252 for the five-point scale and 253 for the ten-point scale. Both data sets were collected among customers of the same mobile telecommunications operator. The sampling design includes a random selection of households using random-digit dialling. In each household one resident is selected randomly and qualified as a member of the target population.
Results
Descriptive analysis
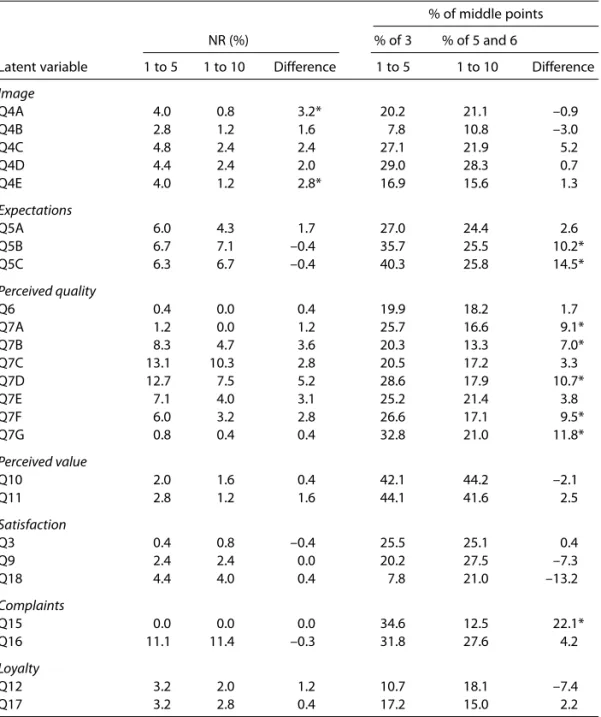
Table 2 shows the frequency of non-response and the frequency of response on the middle points of each scale. Results are shown by indicator and organised in seven groups corresponding to the seven latent variables in the satisfaction model. From the results presented in Table 2 it can be seen that, in general, the five-point scale has a higher proportion of non-responses when compared to the ten-point scale. Among the 25 indicators considered, only four show higher non-response rates for the ten-point scale.
When we formally test the difference between the proportions of non-response measured with the two scales, using the hypotheses
H0: pi,5–p= pi,10–p H1: pi,5–p= pi,10–p
where pi,5–p is the proportion of non-response for variable i, when using
the five-point scale and pi,10–p has the same meaning when using the
ten-point scale, we never reject the null hypothesis, with the exception of variables Q4a and Q4e, at a 5% significance level. Therefore, although the
proportion of non-response is numerically higher in the sample using the five-point scale, we can not conclude that generally these proportions are different in the population.
Table 2 Non-response rates and proportion of responses in the middle points of the scale
% of middle points
NR (%) % of 3 % of 5 and 6
Latent variable 1 to 5 1 to 10 Difference 1 to 5 1 to 10 Difference
Image
Q4A 4.0 0.8 3.2* 20.2 21.1 –0.9
Q4B 2.8 1.2 1.6 7.8 10.8 –3.0
Q4C 4.8 2.4 2.4 27.1 21.9 5.2
Q4D 4.4 2.4 2.0 29.0 28.3 0.7
Q4E 4.0 1.2 2.8* 16.9 15.6 1.3
Expectations
Q5A 6.0 4.3 1.7 27.0 24.4 2.6
Q5B 6.7 7.1 –0.4 35.7 25.5 10.2*
Q5C 6.3 6.7 –0.4 40.3 25.8 14.5*
Perceived quality
Q6 0.4 0.0 0.4 19.9 18.2 1.7
Q7A 1.2 0.0 1.2 25.7 16.6 9.1*
Q7B 8.3 4.7 3.6 20.3 13.3 7.0*
Q7C 13.1 10.3 2.8 20.5 17.2 3.3
Q7D 12.7 7.5 5.2 28.6 17.9 10.7*
Q7E 7.1 4.0 3.1 25.2 21.4 3.8
Q7F 6.0 3.2 2.8 26.6 17.1 9.5*
Q7G 0.8 0.4 0.4 32.8 21.0 11.8*
Perceived value
Q10 2.0 1.6 0.4 42.1 44.2 –2.1
Q11 2.8 1.2 1.6 44.1 41.6 2.5
Satisfaction
Q3 0.4 0.8 –0.4 25.5 25.1 0.4
Q9 2.4 2.4 0.0 20.2 27.5 –7.3
Q18 4.4 4.0 0.4 7.8 21.0 –13.2
Complaints
Q15 0.0 0.0 0.0 34.6 12.5 22.1*
Q16 11.1 11.4 –0.3 31.8 27.6 4.2
Loyalty
Q12 3.2 2.0 1.2 10.7 18.1 –7.4
Q17 3.2 2.8 0.4 17.2 15.0 2.2
If the response effort were too high using the ten-point scale we would expect to find a higher frequency of non-response in the group using this scale. Results do not confirm this hypothesis, and we may conclude that the use of a five-point or ten-point scale does not tend to affect significantly the non-response rate.
The concentration of response in the middle points of the scale can also be seen in Table 2. This table exhibits the proportion of response in category 3 for the five-point scale and the proportion of response in categories 5 and 6 for the ten-point scale. It can be observed that in general the concentration of response in the middle points is higher for the five-point scale, when compared to the ten-five-point one. In fact, only six indicators (among 25) show a higher concentration of response in middle points for the ten-point scale.
When we formally test the difference between the proportions of responses in middle points with the two scales, using the hypotheses
H0: pi,5–p= pi,10–p H1: pi,5–p≠p
i,10–p
where pi,5–p is the proportion of responses on rate 3 for variable i, when
using the five-point scale and pi,10–pis the proportion of responses on rates 5 and 6 when using the ten-point scale, we reject for eight variables the null hypothesis that the proportions are equal in the population (cf. Table 2) at 5% significance level. Therefore, we can conclude that concentration of response in middle points tends to be higher for the five-point scale.
This is also an interesting result that tends to confirm our hypothesis that within an odd scale the middle point is often used by the respondents that prefer to reduce the response effort, resulting in an overestimation of the true frequency associated with this middle point. This result, along with the equivalence of non-response rates using both scales, tends to validate the idea that for most questions measuring attitudes within customer satisfaction surveys the use of a scale with an even number of response alternatives may be a preferable choice.
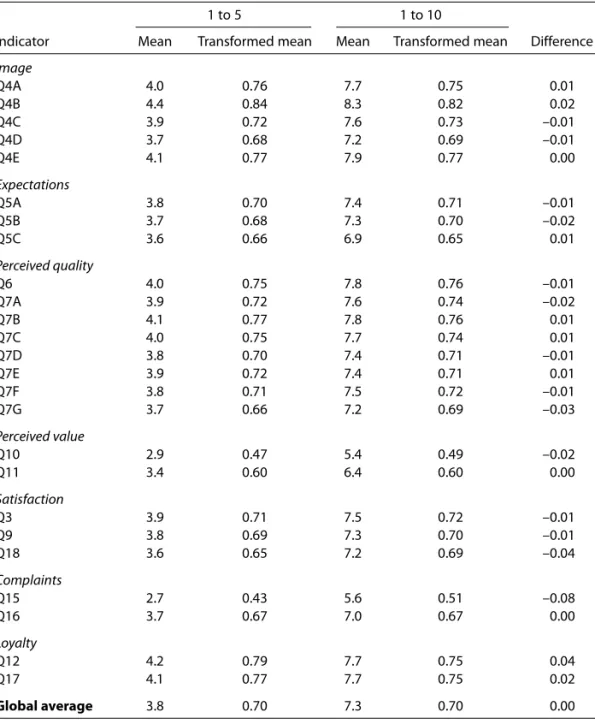
The mean of each indicator, both for the five-point and the ten-point scale, is shown is Table 3. We also present the transformed mean, after
conversion of both scales to the interval [0;1], using the formula yi* =
(yi– 1)/Riwhere yiis the original rating for respondent i, Riis the range of
the scale used by respondent i and yi* is the transformed rating for
It can be seen that for the transformed variables the global average is identical both for the five-point and ten-point scales: 0.70. Also, when analysing individual indicators, both means tend to show similar values (the differences are always smaller than 0.08).
Table 3 Means by indicator using the original and the transformed scale
1 to 5 1 to 10
Indicator Mean Transformed mean Mean Transformed mean Difference
Image
Q4A 4.0 0.76 7.7 0.75 0.01
Q4B 4.4 0.84 8.3 0.82 0.02
Q4C 3.9 0.72 7.6 0.73 –0.01
Q4D 3.7 0.68 7.2 0.69 –0.01
Q4E 4.1 0.77 7.9 0.77 0.00
Expectations
Q5A 3.8 0.70 7.4 0.71 –0.01
Q5B 3.7 0.68 7.3 0.70 –0.02
Q5C 3.6 0.66 6.9 0.65 0.01
Perceived quality
Q6 4.0 0.75 7.8 0.76 –0.01
Q7A 3.9 0.72 7.6 0.74 –0.02
Q7B 4.1 0.77 7.8 0.76 0.01
Q7C 4.0 0.75 7.7 0.74 0.01
Q7D 3.8 0.70 7.4 0.71 –0.01
Q7E 3.9 0.72 7.4 0.71 0.01
Q7F 3.8 0.71 7.5 0.72 –0.01
Q7G 3.7 0.66 7.2 0.69 –0.03
Perceived value
Q10 2.9 0.47 5.4 0.49 –0.02
Q11 3.4 0.60 6.4 0.60 0.00
Satisfaction
Q3 3.9 0.71 7.5 0.72 –0.01
Q9 3.8 0.69 7.3 0.70 –0.01
Q18 3.6 0.65 7.2 0.69 –0.04
Complaints
Q15 2.7 0.43 5.6 0.51 –0.08
Q16 3.7 0.67 7.0 0.67 0.00
Loyalty
Q12 4.2 0.79 7.7 0.75 0.04
Q17 4.1 0.77 7.7 0.75 0.02
When we formally test the difference between the transformed means with the two scales, using the hypotheses
H0: mi,5–p = mi,10–p H1: mi,5–p ≠m
i,10–p
where mi,5–pis the mean for variable iwhen using the five-point scale and
mi,10–p has the same meaning when using the ten-point scale, we never
reject the null hypothesis. Therefore we can not conclude that these means are different in the population. Once again this result tends to confirm that both scales produce equivalent mean scores and validate the acceptability of the ten-point scale. In fact, if the efforts demanded of respondents were too high using the ten-point scale we would expect to find different mean scores for the two scales.
The effect of socio-demographics on ratings
One specific fear regarding the use of ten-point scales concerns some socio-demographic groups, specifically those with a lower education level. The question to be answered is: ‘Do people with different education levels use the five- and ten-point scales differently?’
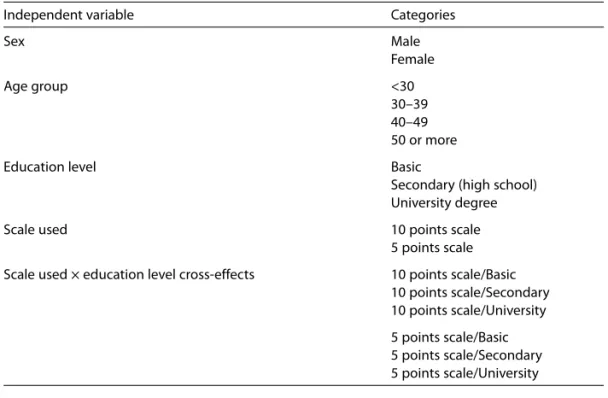
To answer this question we have implemented two analyses:
1. an analysis of variance having as dependent variable the ratings to question Q3 (overall satisfaction)
2. a logistic regression having as its dependent variable a binary variable representing the non-response to question Q7c (quality of services provided).
Results for the analysis of variance are given in Tables 5 and 6. Table 5
shows the F tests for the significance of the regression and for each
individual variable (using Type III sum of squares). The null hypothesis that all model coefficients are zero is rejected, showing the relevance of the model. From the tested factors, only sex and education level are significant at any reasonable significance level. These are important results that tend to show that the scale used (ten-point or five-point) does not influence the mean rating for the dependent variable. Also, although the education level
Table 4Independent variables and categories
Independent variable Categories
Sex Male
Female
Age group <30
30–39 40–49 50 or more
Education level Basic
Secondary (high school) University degree
Scale used 10 points scale
5 points scale
Scale used × education level cross-effects 10 points scale/Basic 10 points scale/Secondary 10 points scale/University
5 points scale/Basic 5 points scale/Secondary 5 points scale/University
Table 5 Ftests
Source DF Sum of squares Mean square Fvalue Pr>F
Model 10 1.21637952 0.12163795 3.42 0.0002
Error 491 17.46895476 0.03557832
Corrected total 501 18.68533428
Variables
Sex 1 0.27802108 0.27802108 7.81 0.0054
Used scale 1 0.00268551 0.00268551 0.08 0.7836
Age group 4 0.07279392 0.01819848 0.51 0.7273
is a significant factor, there is no interaction between the scale used and the education level. The conclusion is that people with different educations do not tend to use the two scales differently.
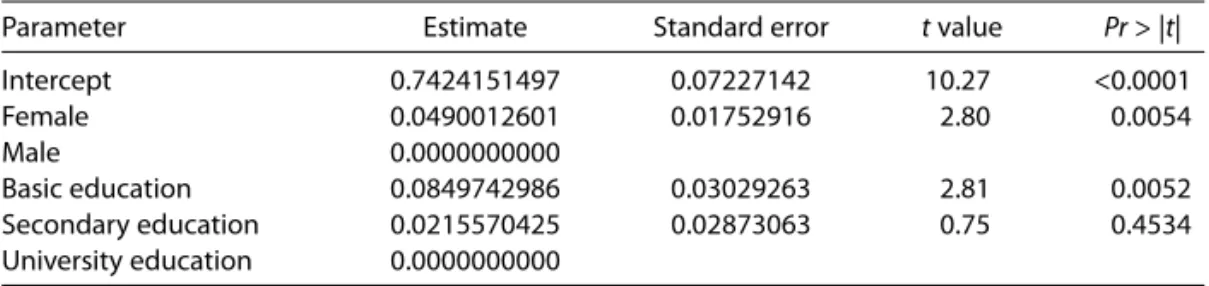
Table 6 shows coefficient estimates for the significant parameters. Please remember that only sex and education level were considered significant. Results confirm the well-known notion in customer satisfaction studies that females tend to show higher ratings than males, and also that mean scores tend to decrease with the increase of education level.
With a logistic regression we intend to offer a complementary insight to the question regarding the hypothetical influence of socio-demographic variables on the rating profile. With the analysis of variance we have been concerned with the response pattern to question Q3 (overall satisfaction). Nevertheless, it is also interesting to understand whether the scale used and socio-demographic characteristics influence the probability of non-response. This is particularly important since, despite concluding that the scale does not influence the response pattern (for respondents), it may influence the probability of response and therefore the quality of collected data. The dependent variable Q7c (quality of services provided) was chosen for being one with the higher non-response rate among variables in the questionnaire. Results for the logistic regression are given in Tables 7 and 8.
Table 7 shows a chi-square test for the model significance and Wald statistics2for individual independent variables. The null hypothesis that all
model coefficients are zero is rejected, showing the relevance of the model. For the independent variables only age group and education level are significant at any reasonable significance level. Once again, these results
Table 6 Parameter estimates
Parameter Estimate Standard error tvalue Pr> |t|
Intercept 0.7424151497 0.07227142 10.27 <0.0001
Female 0.0490012601 0.01752916 2.80 0.0054
Male 0.0000000000
Basic education 0.0849742986 0.03029263 2.81 0.0052
Secondary education 0.0215570425 0.02873063 0.75 0.4534 University education 0.0000000000
tend to show that the scale used (ten-point or five-point) does not influence the probability of non-response for the dependent variable. Also, although the education level is a significant factor, there is no interaction between the scale used and the education level. The conclusion is that within an education level, people using different scales do not tend to show different response rates.
Coefficient estimates for the significant parameters are shown in Table 8. Note that only age group and education level were considered significant. Also note that the probability modelled in our analysis is with regard to the response event. Results show that the response probability tends to decrease with the increase of age. Also it can be seen that the response probability tends to be higher for people with higher education levels.
Table 7 Chi-square tests
Testing global null hypothesis: BETA = 0
Test DF Chi-square Pr> chi sq
Likelihood ratio 10 40.6550 <.0001
Score 10 44.7595 <.0001
Wald 10 36.7804 <.0001
Variables
Sex 1 0.8306 0.3621
Scale used 1 0.6921 0.4054
Age group 4 16.8279 0.0021
Education level 2 12.8545 0.0016
Scale used*education level 2 0.0698 0.9657
Table 8 Parameter estimates
Analysis of maximum likelihood estimates
Standard Wald
Parameter DF Estimate error chi-square Pr> chi sq
Intercept 1 1.7622 0.2092 70.9829 <0.0001
Age group <30 1 0.9717 0.3625 7.1847 0.0074
Age group 30–39 1 0.4654 0.3489 1.7787 0.1823
Age group 40–49 1 0.7258 0.3529 4.2303 0.0397
Age group 50 or + 1 –0.1955 0.2795 0.4893 0.4842
Globally, we can conclude that:
• some socio-demographic variables, such as sex, age group and
education level, influence the probability of non-response or the response profiles for respondents
• the scale used (ten-point or five-point) influences neither the
probability of non-response nor the response profiles for respondents
• in neither analysis is there an interaction between the scale used and
the education level; therefore, we can conclude that, within any education level, people using different scales do not tend to show different response patterns.
These conclusions tend to confirm the empirical analysis made in the previous section where we have observed that both scales produced similar non-response rates as well as similar mean scores (after rescaling). Therefore, the small and usually non-significant differences in response rates between both samples, rather than being a consequence of the scale used, may be totally explained by small differences in the socio-demographic profile of the samples. In fact, the sample using the ten-point scale presents a slightly higher proportion of both young and well-educated people that contributes to a higher response rate.
Validity assessment
Figures 2 and 3 show the estimated path coefficients and tvalues (between
parentheses) for the structural models estimated with five-point and ten-point scales, respectively. Generally, the hypothesised links tend to be significant at 5% significance level. For the model estimated with the five-point scale the only exceptions are the Image–Loyalty, Expectations– Satisfaction and the Complaints–Loyalty paths that are not significant at 10% significance level. In particular, the estimate for the hypothesised path between Complaints and Loyalty is negative (contradicting the
theory) and shows an extremely low tratio. When using the ten-point scale
Figure 2 Model parameter estimate and t values for the five-point scale Complaints Loyalty 0.10 (1.31**) 0.11 (1.46**) 0.25 (3.87) 0.46 (5.73) 0.25 (4.44) 0.31 (3.99) 0.58 (13.42) 0.66 (16.78) 0.65 (17.22) 0.30 (3.93)
* Non-significant at 5% significance level ** Non-significant at 10% significance level 0.29 (3.21) –0.03 (0.34)** Image Expectations Perceived quality Perceived value Satisfaction (ECSI)
Figure 3 Model parameter estimate and t values for the ten-point scale
Complaints Loyalty 0.14 (1.62**) 0.14 (1.79*) 0.34 (4.83) 0.48 (4.89) 0.34 (4.56) 0.19 (2.22) 0.55 (9.77) 0.68 (22.42) 0.64 (15.43) 0.17 (2.31)
We also access the model’s explanatory power (through the
determination coefficient,3 R2) for the equations explaining satisfaction
and loyalty, both in the five-point and ten-point scales. From the results presented in Table 9 it can be seen that the ten-point scale shows a higher explanatory power for customer satisfaction and loyalty, when compared to the five-point scale. The increase in explanatory power attributed to the ten-point scale is particularly impressive for the loyalty construct.
The R2value for satisfaction is higher than 0.50 for both scales (0.59 for
the five-point scale and 0.66 for the ten-point scale). On the other hand, although the R2value for loyalty on the ten-point scale is quite high (0.54),
the value is very low for the five-point scale (0.27), showing a weaker explanatory power for loyalty.
These results clearly favour the ten-point scale and can be seen as a confirmation of the higher nomological validity of this scale, since, globally, constructs in the model estimated with the ten-point scale tend to show higher correlations, confirming theoretical predictions.
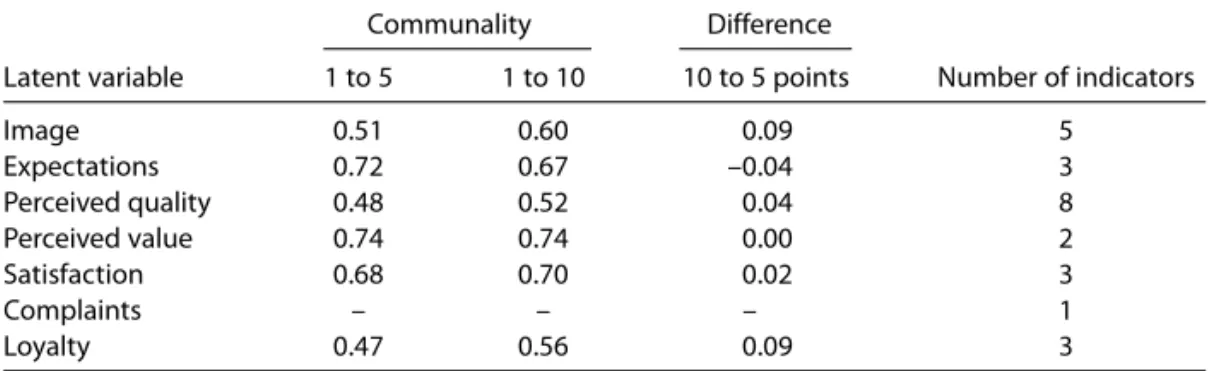
Table 10 presents the average communalities for the seven latent variables of the ECSI model, both for five-point and ten-point scales. Communality for a manifest variable may be interpreted as the proportion of its variance, which is reproduced by the directly connected latent variable. This measure can be used as an indicator of the convergent validity of the measurement model. In almost all cases latent variable communalities are higher than 0.50, indicating than the variance captured by each latent variable is significantly larger than variance due to measurement error, and thus demonstrating a high convergent validity of the construct. There are two exceptions: quality and loyalty, which have communality slightly below 0.50 for the five-point scale (0.479 and 0.468, respectively). In general the communality is higher for the ten-point scale. The only exception occurs in expectation (0.717 for the five-point scale
Table 9 Determination coefficient (R2) of satisfaction and loyalty
Latent variable 1 to 5 1 to 10
Satisfaction 0.59 0.66
Loyalty 0.27 0.54
and 0.674 for the ten-point scale). Once again these results tend to favour the convergent validity of the ten-point scale.
Some authors (e.g. Givon & Shapira 1984) have contended that the advantages of using a higher number of response alternatives tend to be more pronounced for constructs with fewer number of indicators. The results showed in Table 10 do not confirm this statement. In fact, the latent variables with a higher difference between communality for the ten-point scale and five-point scale are image (0.093), loyalty (0.089) and perceived quality (0.041). Nevertheless, image and quality are the constructs in our model with a higher number of indicators (five and eight, respectively). So, globally, we could not find a relation between the communality improvements resulting from using a higher number of response alternatives and the number of indicators in the construct.
One way to assess discriminant validity is to determine whether each latent variable shares more variance with its own measurement variables than with other constructs. For that we start to compare measurement variables communalities with the squared correlations between their own construct and other constructs in the model. A low percentage of latent variable squared correlations exceeding measurement variables communalities tends to confirm discriminant validity (Chin 1998).
Communalities for the indicators of each latent variable and the percentage of latent variable squared correlations exceeding measurement variables communalities are shown in Table 11. Regarding the indicators communalities it can be seen that values tend to be higher for the ten-point scale, when compared to the five-point one. Among the 24 indicators considered, only five show higher communalities in the five-point scale.
Regarding the latent variable squared correlations exceeding measurement variables communalities, in general there are few violations.
Table 10 Communality and number of indicators by latent variable
Communality Difference
Latent variable 1 to 5 1 to 10 10 to 5 points Number of indicators
Image 0.51 0.60 0.09 5
Expectations 0.72 0.67 –0.04 3
Perceived quality 0.48 0.52 0.04 8
Perceived value 0.74 0.74 0.00 2
Satisfaction 0.68 0.70 0.02 3
Complaints – – – 1
Table 11 Indicators communalities and percentage of latent variable squared correlations exceeding measurement variables communalities
1 to 5 1 to 10
Latent variable Latent variable square correlations square correlations exceeding measurement exceeding measurement
variables communalities variables communalities
Commu- Number of % of Commu- Number of % of Indicator nality comparisons violations nality comparisons violations
Image
Q4A 0.49 6 16.7 0.59 6 0.0
Q4B 0.21 6 83.3 0.43 6 33.3
Q4C 0.57 6 0.0 0.62 6 0.0
Q4D 0.71 6 0.0 0.70 6 0.0
Q4E 0.54 6 16.7 0.64 6 0.0
Expectations
Q5A 0.71 6 0.0 0.65 6 0.0
Q5B 0.78 6 0.0 0.70 6 0.0
Q5C 0.65 6 0.0 0.67 6 0.0
Perceived quality
Q6 0.51 6 16.7 0.59 6 0.0
Q7A 0.45 6 33.3 0.51 6 0.0
Q7B 0.39 6 50.0 0.44 6 50.0
Q7C 0.50 6 16.7 0.63 6 0.0
Q7D 0.50 6 16.7 0.53 6 0.0
Q7E 0.57 6 0.0 0.60 6 0.0
Q7F 0.57 6 0.0 0.53 6 0.0
Q7G 0.33 6 50.0 0.34 6 66.7
Perceived value
Q10 0.67 6 0.0 0.68 6 0.0
Q11 0.80 6 0.0 0.80 6 0.0
Satisfaction
Q3 0.63 6 0.0 0.59 6 0.0
Q9 0.66 6 0.0 0.73 6 0.0
Q18 0.75 6 0.0 0.78 6 0.0
Complaints
Q15–16 1.00 6 0.0 1.00 6 0.0
Loyalty
Q12 0.30 6 0.0 0.72 6 0.0
In expectations, perceived value, satisfaction, complaints and loyalty we observed no violations. In the other latent variables, the violations tend to be more significant for the five-point scale. Note that the gains in discriminant validity for the ten-point scale are concentrated in the Image and Perceived Quality constructs, which is to be expected since these are the latent variables measured with a higher number of indicators. The exception occurs in indicator Q7g of perceived quality, where there is one more violation for the ten-point scale (four, in a total of six comparisons). Nevertheless, one should note that this is an indicator with low discriminant validity in both scales. Generally, these results confirm a higher discriminant validity of the constructs when using the ten-point scale.
A complementary assessment of discriminant validity may be obtained using the variance extracted test (Fornell & Larcker 1981). We compare the estimates of average variance extracted (AVE) for each pair of constructs in the model with the correlation between the constructs. Discriminant validity is demonstrated if both square roots of variance extracted are greater than this correlation. Table 12 presents the results for both scales. Elements in the main diagonal represent the square roots of AVE and the other elements correlations between constructs. Although for both scales discriminant validity is generally achieved for most constructs,
Table 12Square roots of average variance extracted and correlations between constructs
Perceived
Image Expectations value Quality Satisfaction Complaints Loyalty
Five-point scale
Image 0.74
Expectations 0.65 0.85
Perceived value 0.46 0.50 0.85
Quality 0.75 0.66 0.50 0.69
Satisfaction 0.67 0.60 0.58 0.69 0.83
Complaints 0.50 0.42 0.44 0.51 0.58 1.00
Loyalty 0.40 0.34 0.37 0.45 0.51 0.29 0.82
Ten-point scale
Image 0.78
Expectations 0.64 0.82
Perceived value 0.52 0.45 0.86
Quality 0.70 0.68 0.51 0.71
Satisfaction 0.72 0.62 0.66 0.67 0.84
Complaints 0.44 0.49 0.40 0.49 0.55 1.00
results tend to favour the ten-point scale. In fact, with the five-point scale a lack of discriminant validity is detected between image and quality constructs (note that these are the constructs where we have found some construct squared correlations exceeding measurement variables communalities). Also, the square root of AVE for quality is equal to the correlation between this construct and satisfaction, while with the ten-point scale all constructs show square roots of AVEs higher than all the corresponding correlations.
Discussion and conclusions
This paper aimed to compare a five-point and a ten-point numerical scale in customer satisfaction measurement in the framework of the Portuguese Customer Satisfaction Index (ECSI-Portugal). The analysis includes the evaluation of non-response rates, response distribution, as well as convergent, discriminant and nomological validity of constructs used in the ECSI model. Moreover we have investigated the effects of socio-demographic characteristics on the ability of respondents to use each scale. Globally, it is apparent that the ten-point scale shows better properties than the five-point scale, validating the choice made in the context of ECSI-Portugal. In fact, it has been seen that the ten-point scale generally shows higher validity than the five-point scale. This is true both for convergent and discriminant validity. Also the ten-point scale showed a higher explanatory power for the main variables in our model (satisfaction and loyalty) thus confirming a higher nomological validity.
may be a preferable choice. We can also conclude that respondents can deal with scales with an even number of points and therefore the use of scales with a neutral category should not be mandatory.
Through an analysis of variance aiming to explain response scores and a logistic regression aiming to explain non-response, we confirmed the well-known idea in customer satisfaction studies that some socio-demographic variables, such as sex, age group and education level, influence the probability of non-response and the response profiles of respondents. We have also concluded that the scale used (ten-point or five-point) influences neither the probability of non-response, nor the response profiles of respondents. Finally, we found that there was not, in either analysis, any interaction between the scale used and education level. Therefore we can conclude that within any education level, people using different scales do not tend to exhibit different response probabilities or response profiles. This is a particularly important result since some criticism regarding the use of scales with a high number of response alternatives is that it would decrease the quality of response, particularly for people with lower educational levels.
If we use Cox’s (1980) definition regarding the optimal number of response alternatives for a scale – ‘a scale with the optimal number of response alternatives is refined enough to be capable of transmitting most of the information available from respondents without being so refined that it simply encourages response error’ – we can clearly state that in the context of our study ten points is a better choice for the number of response alternatives than five points.
that they are contributing to the improvement of the product/service offered by their supplier, but this seems to be an insufficient cause for the specificity of the results. Third, the analysis performed differs from most previous studies defending a lower number of response categories. In fact, we have compared the two scales using multi-item constructs estimated in a structural equation modelling (SEM) framework. Some of the previous work concerned with single-item measures and the ones using multi-item constructs were almost exclusively concerned with reliability. In fact, validity, which was one of the major concerns in our study, has not been used as a criterion for most studies. Fourth, it is possible that the conventional wisdom of 20 or 30 years ago no longer applies. One possible explanation is that consumers have become more sophisticated at taking tests and rating their attitudes. Globally, the familiarity with scales has definitely been growing. Decades ago, the use of standardised tests and attitude scales was much less common than today. Phrases such as ‘On a scale of 1 to 10, how would you rate …’ have crept into popular speech. Taken together, these facts may point to a shift in the ability of average consumers to use more discriminating scales with greater ease.
If it is true that consumers can use scales with more scale points more easily than they could in the past, there is every reason for researchers to use such scales. Our results suggest that more scale points, routinely used, will result in greater ability to identify important relationships, higher validity for constructs, and better hypothesis tests in theory and practice.
out that the analysis was limited to the fact that the two questionnaires (using different scales) were administered to independent samples. Some additional analysis would be beneficial if the two questionnaires were administered to the same sample.
Acknowledgements
The authors would like to thank Dr Dwayne Ball (University of Nebraska-Lincoln) and the anonymous referees for their helpful comments.
References
Alwin, D.F. (1991) Research on survey quality. Sociological Methods & Research,
20, pp. 3–29.
Alwin, D.F. (1997) Feeling thermometers versus 7-point scales – which are better? Sociological Methods and Research, 25, 3, pp. 318–340.
Alwin, D.F. & Krosnick, J.A. (1991) The reliability of attitudinal survey measures: the role of question and respondent attributes. Sociological Methods & Research,
20, pp. 139–181.
Andrews, F.M. & Withey, S.B. (1976) Social Indicators of Well-Being: Americans’
Perceptions of Life Quality. New York: Plenum.
Ball, A.D., Coelho, P.S. & Machás, A. (2004) The role of communication and trust in explaining customer loyalty: an extension to the ECSI model. European Journal of Marketing, 38, available from the authors.
Cassel, C. & Eklof, J.A. (2001) Modeling customer satisfaction and loyalty on aggregate levels: experience from the ECSI pilot study. Total Quality Management,
12, 7–8, pp. 834–841.
Cassel, C., Hackl, P. & Westlund, A. (2000) On measurement of intangibles assets: a study of robustness of partial least squares. Total Quality Management, 7,
pp. 897–907.
Chin, W.W. (1998) The partial least squares approach to structural equation modeling. In: G.A. Marcoulides (ed.) Modern Methods for Business Research. Mahwah, NJ: Lawrence Erlbaum Associates.
Cicchetti, D.V., Showalter, D. & Tyrer, P.J. (1985) The effect of number of rating scale categories on levels of interrater reliability: a Monte Carlo investigation. Applied Psychological Measurement, 9, 1, pp. 31–36.
Colman, A.M., Norris, C.E. & Preston, C.C. (1997) Comparing rating scales of different lengths: equivalence of scores from 5-point and 7-point scales. Psychological Reports, 80, pp. 355–362.
Converse, J.M. & Presser, S. (1986) Survey Questions: Handcrafting the
Standardized Questionnaire. Newbury Park, CA: Sage.
ECSI (1998) European Customer Satisfaction Index. Report prepared for the ECSI Steering Committee.
Fornell, C. (1992) A national customer satisfaction barometer: the Swedish experience. Journal of Marketing, 56, 1, pp. 6–21.
Fornell, C. & Larcker, D.F. (1981) Evaluating structural equation models with unobservable variables and measurement error. Journal of Marketing Research,
18, pp. 39–50.
Fornell, C., Johnson, M.D., Anderson, E.W., Cha, J. & Everitt Bryant, B. (1996) The American Customer Satisfaction Index: nature, purpose and findings. Journal of Marketing, 60, 4, pp. 7–18.
Fornell, C., Johnson, M.D., Anderson, E.W., Cha, J. & Everitt Bryant, B. (1998)
The American Customer Satisfaction Index: Methodology Report. Ann Arbor, MI:
University of Michigan.
Givon, M.M. & Shapira, Z. (1984) Response to rating scales: a theoretical model and its application to the number of categories problem. Journal of Marketing Research, 21, pp. 410–419.
Green, P.E. & Rao, V.R. (1970) Rating scales and information recovery – how many scales and response categories to use. Journal of Marketing, 34, pp. 33–39.
Haley, R.I. & Case, P.B. (1979) Testing thirteen attitude scales for agreement and brand discrimination. Journal of Marketing, 43, pp. 20–32.
Jenkins, G.D. & Taber, T.D. (1977) A Monte Carlo study of factors affecting three indices of composite scale reliability. Journal of Applied Psychology, 62,
pp. 392–398.
Johnson, M., Gustafsson, A., Andreason, T.W., Lervik, L. & Cha, G. (2001) The evolution and future of national customer satisfaction index models. Journal of
Economic Psychology, 22, pp. 217–245.
Krosnick, J.A. & Alwin, D.F. (1989) Response strategies for coping with the cognitive demands of survey questions. Unpublished manuscript. Ann Arbor, MI: University of Michigan, Institute for Social Research.
Malhotra, N. & Birks, D. (2003) Marketing Research: An Applied Approach, 2nd European edn. Prentice Hall.
Neumann, L. & Neumann, Y. (1981) Comparison of six lengths of rating scales: students’ attitudes toward instruction. Psychological Reports, 48, pp. 399–404.
Ramsay, J.O. (1973) The effect of number of categories in rating scales on precision of estimation of scale values. Psychometrika, 37, pp. 513–532.
Reynolds, F.D. & Neter, J. (1982) How many categories for respondent classification. Journal of the Market Research Society, 24, 4, pp. 345–346.
Stem, D.E. & Noazin, S. (1985) The effects of number of objects and scale positions on graphic position scale reliability. In: R.E. Luschet al. (eds) AMA Educators’
Proceedings. Chicago: Marketing Association, pp. 370–372.
Tourangeau, R. (1984) Cognitive sciences and survey methods. In: T.B. Jabine, M.L. Straf, J.M. Tanur & R. Tourangeau (eds) Cognitive Aspects of Survey
Methodology: Building a Bridge between Disciplines. Washington, DC: National
Academy Press, pp. 73–100.
Vilares, M. & Coelho, P. (2004) The employee–customer satisfaction chain in the ECSI model. European Journal of Marketing, 37, pp. 1703–1722.
About the authors
Pedro Simões Coelho is Associate Professor at Instituto Superior de Estatística e Gestão de Informação of the Universidade Nova de Lisboa (ISEGI-UNL). He is also a researcher in the Statistics and Information Management Center (CEGI) at ISEGI-UNL, Vice-President of the Portuguese Association for Classification and Data Analysis (CLAD) and Vice-President of Qmetrics, SA. Additionally, he is co-coordinator of the Portuguese committee of the ECSI-Portugal (European Customer Satisfaction Index) project. At ISEGI-UNL he is Director of the Master degrees and is lecturing courses in survey methodology, marketing research, data collection methodologies and quantitative methods for marketing. Pedro Simões Coelho has been a consultant for several organisations, including the Portuguese Statistical Office. His main research interests are in survey methodology, structural equation modelling, customer satisfaction measurement, and the explanation of customer loyalty.
Susana Pereira Esteves ([email protected]) is presently Assistant Professor at Instituto Superior de Estatística e Gestão de Informação of the Universidade Nova de Lisboa (ISEGI-UNL). She is a researcher in the Statistics and Information Management Research Center (CEGI) of the same university and is also a member of the workgroup of ECSI - Portugal (European Customer Satisfaction Index) project. Her current work focuses on marketing research, in particular customer satisfaction and loyalty measurement.
Address correspondence to: Professor Pedro Simões Coelho, ISEGI-UNL, Campus de Campolide, 1070-312 Lisboa, Portugal.