KAMILA TOMOKO YUYAMA
CONDIÇÕES FISIOLÓGICAS E AMBIENTAIS QUE FAVORECEM A PRODUÇÃO DE CAROTENÓIDES POR Rhodotorula mucilaginosa
Dissertação apresentada à Universidade Federal de Viçosa, como parte das exigências do Programa de Pós-Graduação em Microbiologia Agrícola, para obtenção do título de Magister Scientiae.
VIÇOSA
Ficha catalográfica preparada pela Seção de Catalogação e Classificação da Biblioteca Central da UFV
T
Yuyama, Kamila Tomoko, 1989-Y95c
2013
Condições fisiológicas e ambientais que favorecem a produção de carotenóides por Rhodotorula mucilaginosa / Kamila Tomoko Yuyama. – Viçosa, MG, 2013.
xi, 28 f. : il. ; 29 cm.
Inclui anexos. Inclui apêndices.
Orientador: Flávia Maria Lopes Passos.
Dissertação (mestrado) - Universidade Federal de Viçosa. Inclui bibliografia.
1. Carotenóides. 2. Leveduras - Crescimento.
3. Temperatura. 4. Luz. I. Universidade Federal de Viçosa. Departamento de Microbiologia. Programa de Pós-Graduação em Microbiologia Agrícola. II. Título.
KAMILA TOMOKO YUYAMA
CONDIÇÕES FISIOLÓGICAS E AMBIENTAIS QUE FAVORECEM A PRODUÇÃO DE CAROTENÓIDES POR Rhodotorula mucilaginosa
Dissertação apresentada à Universidade Federal de Viçosa, como parte das exigências
do Programa de Pós-Graduação em
Microbiologia Agrícola, para obtenção do título de Magister Scientiae.
APROVADA: 22 de outubro de 2013.
Antônio Galvão do Nascimento (Coorientador)
Maria Cristina Dantas Vanetti (Coorientadora)
Vanessa Cristina de Castro Flávia Maria Lopes Passos
ii
Essa tese é dedicada a minha maior fortaleza e
inteligência de vida, ao meu super pai Kaoru
Yuyama e in mnmoriam a minha maior guerreira e
exemplo de superação, a minha querida e amada
mãe Lucia Kiyoko Ozaki Yuyama, pelo amor
incondicional, incentivo, apoio e confiança nos
momentos bons e mais difíceis durante toda essa
trajetória do Mestrado. À vocês meu carinho,
respeito, amor e admiração eterna.
Deus dá a cruz somente aqueles que com ousadia, sabedoria e coragem conseguem superar os desafios.
“Tu és minha força outro Deus não há, tu és minha paz, minha liberdade! Nada nesta vida nos separará,
em tuas mãos seguras minha vida guardarás. Eu não temerei o mal, tu me livrarás e no teu perdão
iii
AGRADECIMENTOS
A Deus, por ter me dado o dom da vida, por me acalmar nos
momentos mais difíceis, por iluminar e proteger meus caminhos e por me
mostrar que sempre existirão coisas boas depois de todo dilúvio.
Aos meus pais Kaoru Yuyama e Lucia Kiyoko Ozaki Yuyama (in
memoriam), por sempre me mostrarem o lado bom da vida e que com muito esforço e dedicação conseguimos transformar sonhos em realidade, pelo
incentivo nos momentos de maior fraqueza e dificuldade e por serem meus
maiores exemplos de vida, de pesquisa, de dignidade e de muito amor e
felicidade.
Aos meus irmãos Erika K. Yuyama e Thiago S. Yuyama, pelo
companheirismo, pelas brincadeiras e implicâncias, por sempre cuidarem de
mim mesmo distante e por terem sido meu porto seguro no momento mais
difícil.
À minha orientadora Flávia Maria Lopes Passos, pela orientação
(mesmo longe), pelo incentivo nos inúmeros problemas enfrentados durante
o experimento, pelo apoio incondicional, confiança e carinho.
Aos meus co-orientadores Prof. Antônio Galvão do Nascimento e
Profa. Maria Cristina Dantas Vanetti, pela ótima convivência e orientação
durante o mestrado.
Ao Prof. Wendel Batista da Silveira, pelo apoio e auxílio na compra
dos reagentes necessários ao trabalho e na identificação da levedura.
À família “LAB FIS”, por terem me acolhido e me feito sentir parte de
uma verdadeira família, pelo apoio e carinho nos momentos mais difíceis,
pela ajuda nos experimentos, pela indescritível paciência com o ruído das
bombas, pelas inúmeras implicâncias e por sempre me fazerem rir todo dia.
Em especial as irmãs sintonia Lívia Colombo e Mariana Alvim; ao trio parada
dura Robson Souza (Róbson), Éder Galinari (Eds) e Fernando Augusto
(Fefs); ao irmão mais implicante Caio Soares; a irmã e companheira de altas
horas de laboratório Priscila Gonçalves, a baiana mais linda Josenilda (Josi)
iv
Raphael e Victor; e as pessoas mais simpáticas, Tatiana, Cristiane, Maria
Fernanda, Luna, Raquel, Sâmia e João; a todos que já passaram por essa
família e que de algum modo me fizeram sentir especial.
Ao técnico do laboratório de Fisiologia de Micro-organismo Hugo
Genier, pela amizade, paciência e pela incessante ajuda nos experimentos,
principalmente com o HPLC e com a superfície de resposta, que com
certeza sem essa incrível ajuda essa dissertação não sairia.
Ao Dr. Raphael Hermano, pela ajuda inicial nos experimentos, pelos
grandes conselhos e e-mails.
À Profa. Vanessa Castro, pela indispensável ajuda nos experimentos
iniciais, principalmente em relação ao HPLC, e pela orientação no Estágio
em Ensino.
Ao Dr. Péricles Leonardo, pelos ensinamentos e conselhos durante o
Estágio em Ensino.
Ao doutorando Filippe Elias, pela formidável ajuda nas análises dos
dados da superfície de resposta e ao seu irmão Denilson Elias, pela ajuda
nos problemas de computador.
À turma prática 14 da disciplina MBI-100, pelo entusiasmo e
participação nas aulas, podem ter certeza que eu aprendi muito ao ensinar
vocês.
Ao técnico do Departamento da Química Eduardo, pelos
ensinamentos com o HPLC e pela ajuda na análise dos carotenoides.
Às minhas ex-orientadoras Noemia Kazue Ishikawa e Cristina Sayuri
Maki, por terem plantado em mim a semente da Microbiologia e por sempre
me incentivarem a ir mais longe na pesquisa.
À minha segunda família, as guerreiras invencíveis, companheiras e
amigas-irmãs de todas as horas e momentos, tanto das árduas disciplinas
quanto dos inúmeros problemas enfrentados durante todo o mestrado. Se eu
consegui vencer cada etapa, isso é em grande parte graças a vocês, Isabela
Nascimento, Merielle Angélica, Lívia Gonzaga, Roméria Silva e Ubiana Silva.
Ao Departamento de Microbiologia, por me oferecer a oportunidade
v
A todos os professores do Departamento de Microbiologia, pelos
grandiosos ensinamentos nas matérias e por terem construído minha base
de conhecimento em Microbiologia.
A todos os laboratórios da Microbiologia, pela assistência oferecida
durante os experimentos, principalmente ao Laboratório do Petróleo,
Anaeróbios, Micorriza, Genética, Ecologia em especial ao doutorando Paulo
pelo auxílio com o nitrogênio líquido e ao Laboratório da “MIND” pelo uso
contínuo do vortex e da câmara de exaustão.
À secretária do Programa de Microbiologia Nilcéia, pela competência
e imensa ajuda no decorrer do curso, sem você estaríamos literalmente
perdidos.
Aos funcionários do Departamento de Microbiologia em especial ao
“Seu Paulinho” pela grande disposição e auxílio na autoclave, ao Danilo e
Evandro pelo ajuda com os reagentes e equipamentos, aos técnicos Rita
(Ritinha), Zé-Carlos, Júlio, Camila, Carlos e Cíntia, ao Paulo da portaria pela
enorme simpatia e as secretárias Aline, Letícia e Sandra.
Aos meus amigos de Manaus e outros estados que sempre torceram
por mim e ficaram ao meu lado nos momentos mais difíceis, em especial
Janaina Nogueira, Yuki Uehara, Thais Lemos, Lucila Tsuzuki, Rafael
Gerzvolf, Lie Koba, Caroline Komorita e Hideki Takizawa.
A toda minha família, especialmente (in memoriam) a meus avós maternos Kiyoshi Ozaki e Massako Nomoto Ozaki que criaram a mim e aos
meus irmãos e fizeram de nós as pessoas que somos hoje.
Ao CNPq e CAPES pelo auxílio financeiro.
A todos os colegas e amigos da Microbiologia pelo entusiasmo,
carinho e apoio.
A todos que de alguma forma me ajudaram e contribuíram para que
essa dissertação finalmente ficasse pronta, a todos vocês o meu muito
vi
BIOGRAFIA
KAMILA TOMOKO YUYAMA, filha de Kaoru Yuyama e Lucia Kiyoko
Ozaki Yuyama, nasceu no dia 13 de Abril de 1989, em Ribeirão Preto, São
Paulo. Graduou-se em Licenciatura em Ciências Biológicas pela
Universidade Federal do Amazonas em Março de 2011. Em julho desse
mesmo ano, iniciou o curso de mestrado no Programa de Pós-graduação em
Microbiologia Agrícola da Universidade Federal de Viçosa, Viçosa, Minas
vii
SUMÁRIO
RESUMO ... viii
ABSTRACT ... x
ARTICLE: PHYSIOLOGICAL AND ENVIRONMENTAL CONDITIONS THAT ENHANCE THE PRODUCTION OF CAROTENOIDS BY Rhodotorula mucilaginosa ...1
ABSTRACT ...2
1. INTRODUCTION ...3
2. MATERIAL AND METHODS ...4
2.1 Microorganism and maintenance ...4
2.2 Identification of microorganism ...4
2.3 Experimental design and statistical analysis ...5
2.4 Inoculum preparation and experimental procedure...6
2.5 Determination of the cell mass and specific growth rate ...6
2.6 Analytical methods ...7
3. RESULTS AND DISCUSSION ...7
4. CONCLUSION ... 18
5. ACKNOWLEDGEMENTS ... 19
6. REFERENCES ... 19
viii
RESUMO
YUYAMA, Kamila Tomoko, M.Sc., Universidade Federal de Viçosa, outubro de 2013. Condições fisiológicas e ambientais que favorecem a produção de carotenoides por Rhodotorula mucilaginosa. Orientadora: Flávia Maria Lopes Passos. Coorientadores: Antônio Galvão do Nascimento e Maria Cristina Dantas Vanetti.
Em micro-organismos produtores, carotenoides são pigmentos, precursores
de vitamina A, que os protegem contra o estresse oxidativo. Fatores
ambientais extrínsecos tais como temperatura, fontes específicas de
carbono e indutores de espécies reativas de oxigênio (ROS) como luz e
peróxido de hidrogênio associados a condições fisiológicas (fase de
crescimento exponencial máxima, fase estacionária inicial e tardia)
influenciam no acúmulo de carotenoides pelas células microbianas. Uma
levedura pigmentada foi isolada do horto da Universidade Federal de Viçosa,
Minas Gerais, Brasil. Os objetivos desse trabalho foram identificar esta
levedura isolada no horto da UFV e analisar a influência dos fatores
ambientais (temperatura, intensidade de luz e concentração de arabinose) e
das diferentes condições fisiológicas (fase log, estacionária inicial e tardia)
na produção de carotenoides e na velocidade de crescimento da levedura. A
identificação taxonômica da levedura foi feita pelo Centraalbureau voor Schimmelcultures (CBS) por meio das análises das sequências 5,8S e 26S do rRNA e por ferramentas moleculares e bioquímicas, resultando na
identificação da espécie como Rhodotorula mucilaginosa. A influência das condições ambientais e fisiológicas na produção de carotenoides e na taxa
de crescimento foi verificada pela metodologia de superfície de resposta
(RSM) por meio de um delineamento composto central (CCD) com três
fatores e seis replicatas do ponto central. Os 20 experimentos foram feitos
em 91h de batelada e as amostras foram coletadas em diferentes estados
fisiológicos da cultura, isto é na fase de crescimento máximo (fase log), fase
de desaceleração do crescimento (2h iniciais na entrada da fase
estacionária) e fase estacionária (60h após alcançar a massa celular
máxima). Demonstrou-se que a formação de carotenoides pela levedura
ix
massa celular (µg/g) ocorreu na fase de desaceleração do crescimento. A
velocidade específica máxima de crescimento (µmax) e o rendimento em
carotenóide total por massa celular (µg/g) foram ajustados ao modelo
matemático, com R2 de 0,96 e 0,91 respectivamente, e o desajuste não foi
significante (p>0,05). Os níveis de intensidade de luz (µmol m-2s-1),
arabinose (%p/v) e temperatura (°C) que criaram a resposta máxima de
rendimento de carotenóides totais (93,92 µg/g) foram 100 µmol m-2s-1; 5%;
18 °C e da velocidade de crescimento (0,31h-1) foram 63,6 µmol m-2s-1;
x
ABSTRACT
YUYAMA, Kamila Tomoko, M.Sc., Universidade Federal de Viçosa, October, 2013. Physiological and environmental conditions that enhance the production of carotenoids by Rhodotorula mucilaginosa. Adviser: Flávia Maria Lopes Passos. Co-advisers: Antônio Galvão do Nascimento and Maria Cristina Dantas Vanetti.
In pigmented microorganisms, carotenoids are pigments, precursors of
vitamin A that provide protective effects against oxidative damage. Extrinsic
environmental factors such as temperature, specific carbon sources and
inducers of reactive oxygen species (ROS) such as hydrogen peroxide and
light associated with physiological conditions (maximum exponential growth
phase, early and late stationary phase) influence the accumulation of
carotenoids in microbial cells. A pigmented yeast was isolated from an
orchard in Universidade Federal de Viçosa, Minas Gerais, Brazil. The main
aims were to identify the isolated yeast and analyze the influence of
environmental (light, temperature and arabinose) and physiological
conditions (log phase, early and late stationary phase) on the production of
carotenoids and the growth rate of the yeast. The taxonomical identification
of the yeast strain was accomplished through analysis of 5.8S and 26S rRNA
by the Centraalbureau voor Schimmelcultures (CBS) and biochemical and molecular approaches. The yeast was identified as Rhodotorula
mucilaginosa. In order to analyze the influence of factors on production of carotenoids and growth rate we used a methodology of response surface
(RSM), and a central compositefactorial design (CCD) with three factors and
six replicates of central point was applied. The 20 experiments were done in
batch in 91h and samples were collected at different physiological stages of
the culture, at maximum growth rate (log phase), at deceleration growth
phase (2h initial at the entrance of the stationary phase) and at stationary
phase (60h after reaching the maximum cell mass). It implicates that
carotenogenesis is not associated with cellular growth. The maximum
carotenoid yield per cell mass (µg/g) occurred at deceleration growth phase.
The growth rate (µ) and total carotenoid yield (µg/g) calculations
well-adjusted to the mathematical model, with R2 of 0.96 and 0.91, respectively,
xi
(µmol m-2s-1), arabinose (%w/v) and temperature (°C) that created a
maximum answer of total carotenoid yield (93.92 µg/g) were 100 µmol m-2s-1;
5% and 18 °C and growth rate (0.31h-1) were 63.6 µmol m-2s-1; 3.7% and
1
2
PHYSIOLOGICAL AND ENVIRONMENTAL CONDITIONS THAT ENHANCE THE PRODUCTION OF CAROTENOIDS BY Rhodotorula mucilaginosa
ABSTRACT
In pigmented microorganisms, carotenoids are pigments, precursors of vitamin A that provide protective effects against oxidative damage. Extrinsic environmental factors such as temperature, specific carbon sources and inducers of reactive oxygen species (ROS) such as hydrogen peroxide and light associated with physiological conditions (maximum exponential growth phase, early and late stationary phase) influence the accumulation of carotenoids in microbial cells. A pigmented yeast was isolated from an orchard in Universidade Federal de Viçosa, Minas Gerais, Brazil. The main aims were to identify the isolated yeast and analyze the influence of environmental (light, temperature and arabinose) and physiological conditions (log phase, early and late stationary phase) on the production of carotenoids and the growth rate of the yeast. The taxonomical identification of the yeast strain was accomplished through analysis of 5.8S and 26S rRNA by the Centraalbureau voor Schimmelcultures (CBS) and biochemical and molecular approaches. The yeast was identified as Rhodotorula mucilaginosa. In order to analyze the influence of factors on production of carotenoids and growth rate we used a methodology of response surface (RSM), and a central compositefactorial design (CCD) with three factors and six replicates of central point was applied. The 20 experiments were done in batch in 91h and samples were collected at different physiological stages of the culture, at maximum growth rate (log phase), at deceleration growth phase (2h initial at the entrance of the stationary phase) and at stationary phase (60h after reaching the maximum cell mass). It implicates that carotenogenesis is not associated with cellular growth. The maximum carotenoid yield per cell mass (µg/g) occurred at deceleration growth phase. The growth rate (µ) and total carotenoid yield (µg/g) calculations well adjusted to the mathematical model, with R2 of 0.96 and 0.91, respectively,
and the lack of fit was not significant (p>0.05). The levels of light (µmol m-2s-1), arabinose (%w/v) and temperature (°C) that created a
maximum answer of total carotenoid yield (93.92 µg/g) were 100 µmol m-2s-1;
5% and 18 °C and growth rate (0.31h-1) were 63.6 µmol m-2s-1; 3.7% and
24.6 °C.
3
1. INTRODUCTION
Carotenoids present antioxidant properties and reduce the risk of
chronic degenerative diseases in humans, such as cancer, cardiovascular
disease, osteoporosis, cataracts and age-related macular degeneration (Rao
and Rao, 2007). Over 600 carotenoids are naturally occurring, and 150 have
been found in photosynthetic organisms. However, filamentous fungi,
bacteria and nonphotosynthetic yeasts, as Cryptococcus, Rhodotorula, Rhodosporidium, Sporobolomyces and Phaffia, also produce carotenoids (Britton, 1993; Johnson and Lewis, 1979). Commercial production of natural
microbial carotenoids is a new more eco-friendly approach than synthetic
manufacture by chemical procedures (Rodríguez-Sáiz et al., 2010).
A great variety of microorganisms accumulates intracellularly
carotenoids (Nelis and De Leenheer, 1991). A variety of environmental and
cultural stimulants enhances volumetric production and cellular accumulation
of carotenoids in microorganisms (Bhosale, 2004). Some studies have used
genetic engineering, generating spontaneous mutations in order to improve
carotenoid production by microbial strains. However, these strains are not
always more robust in terms of resistance and adaptation (An, 1997).
Studies concerning cell physiology and environmental conditions that
favor microbial carotenoid synthesis are interesting not only to search for the
ideal parameters for industrial production but also to elucidate the microbial
physiological advantages provided by such pigments. Changes in
temperature of incubation, carbon sources and the presence of reactive
oxygen species (ROS) inducers, such as light and hydrogen peroxide,
promote increased production of carotenoids (Vázquez, 2001; Bhosale,
2004; Aksu and Eren, 2005; Liu and Wu, 2006; Rodríguez-Sáiz et al., 2010).
Carotenoids are potent antioxidants that show protective effects on the
organisms exposed to oxidative damage (Bhosale, 2004; Schroeder and
Johnson, 1995a; Schroeder and Johnson, 1995b).
A yeast strain was isolated from orchard in Universidade Federal de
Viçosa, Viçosa, Minas Gerais, Brazil. The strategies for isolation have
favored yeasts from genus Rhodotorula sp. (Barreto et al., 2008). Several
4
et al., 1994), from different carbon sources including agricultural wastes, as
pentoses like arabinose widely distributed in lignocelulosic biomass
(Izydorczyk and Biliaderi, 1995; Frengova, and Beshkova, 2009; Parajó et al.,
1997). Furthermore, factorial approaches can improve the carotenoid
production by yeast, through optimization of culture conditions with reduced
number of experimental trials needed to evaluate multiple variables and their
interactions (Buzzini, 2000; Gharibzahedi et al., 2012). The main aims of this
work were to identify the isolated yeast and analyze the influence of
environmental (light, temperature and arabinose) and physiological
conditions (log phase, early and late stationary phase) on the production of
carotenoids and the growth rate of the yeast.
2. MATERIAL AND METHODS
2.1 Microorganism and maintenance
A yeast strain was isolated from an exudate of Pinus sylvestris
growing at the University orchard (Universidade Federal de Viçosa-UFV
campus, Viçosa-MG-Brazil) at autumn season (Barreto et al., 2008). The
main criterion for choice of isolation spots was presence of color on the
exudates, indicative of production of carotenoids, like β-carotene or
astaxanthin. The UFV-isolated strain was maintained in YM medium [1%
glucose; 0.5% peptone, 0.3% malt extract and 0.3% yeast extract] with 40%
glycerol at -80 °C.
2.2 Identification of microorganism
Centraalbureau voor Schimmelcultures (CBS) performed the identification of the isolate based on molecular assays. Briefly, the strain was
cultured on Malt Extract Agar for 3-4 days in the dark at 25 °C. The MoBio
UltraClean™ Microbial DNA Isolation Kit was used for DNA isolation,
according to the instructions of the manufacturer. Fragments containing the
Internal Transcribed Spacer (ITS) 1 and 2 of the 5.8S gene were amplified
using the primers LS266 (GCATTCCCAAACAACTCGACTC) and V9G
5
Fragments containing the 26S ribosomal RNA gene, Large Subunit D1 and
D2 region (LSU) were amplified using the primers LR0R
(ACCCGCTGAACTTAAGC) and LR5 (TCCTGAGGGAAACTTCG, Vilgalys
and Hester, 1990). The PCR fragments were sequenced with the ABI Prism®
Big DyeTM Terminator v. 3.0 Ready Reaction Cycle sequencing Kit. Samples
were analyzed on an ABI PRISM 3700 Genetic Analyzer and contigs were
assembled using the forward and reverse sequences with the program
SeqMan from the Laser Gene package.
The sequences of ITS (5.8S rRNA) and LSU (26S rRNA) were
compared in a large yeast database of CBS-KNAW Fungal Biodiversity
Centre with sequences of most type strains. In order to create a phylogenetic
tree of Rhodotorula species, ITS (5.8S rRNA) sequences were compared with other ITS sequences in GenBank, through MEGA 5 software
(www.megasoftware.net) and the neighbor-joining method (Saitou and Nei,
1987) with 1000 bootstrap repetitions.
We complemented the identification of UFV-isolated strain by a
biochemical assay for nitrate and nitrite utilization (Rhodes & Roberts, 1975).
Escherichia coli DH5α was used as a positive control.
2.3 Experimental design and statistical analysis
In order to predict the surface response of literature-cited main factors
affecting carotenoid yield by yeast (Ambati and Ayanna, 2001; Sharma et al.,
2007), a response surface methodology (RSM) was designed. A central
composite factorial design (CCD) with three factors [arabinose (%w/v),
temperature (°C) and light intensity (µmol m-2s-1)] and six replicates of central
point was applied. This method was performed at five levels (-α, -1, 0, 1, +α)
where, α=2n/4, n equals the number of variables and 0 corresponds to the
central point in 20 experiments of CCD (Table 1). Two experimental
responses [carotenoid yield (μg carotenoid/g dry cell mass) and β-carotene
yield (μg carotenoids/g dry cell mass)] from each experiment were recorded.
The model was represented by the equation:
Y = bo + b1x1 + b2x2 + b3x3 + b11x12 + b22x22 + b33x32 + b12x1x2 + b23x2x3 +
6
Where Y is the predicted response: bo intercept coefficient; b1, b2, b3
the linear coefficients; b12, b23, b13 interaction coefficients; b11, b22, b33 the
quadratic coefficients; and x1, x2, x3, x11, x22, x33, x12, x23, x13 the factor levels.
The program for statistical Design Expert 8.0 was used to determine the
optimal level of factors (response curve) for maximum responses.
2.4 Inoculum preparation and experimental procedure
Preculture was prepared by inoculating a loop full of cell mass from
-80 °C stock into 250 mL Erlenmeyer flasks containing 50 mL of YM medium
with 1% arabinose and incubating at 30 °C under agitation of 200 rpm. After
24h incubation, cell mass were collected, washed twice and suspended in
sterile peptonated water (0.01%) and used to inoculate the 20 cultures
according to the designed experiments. All of them were initiated with cell
mass concentration ranging from 0.20 to 0.217 g/L, and were carried out in
500 mL jacketed glass reactors containing 180 mL of YM medium with
different concentrations of arabinose, and exposed under different light
intensities and temperature ranges (Table 1). All the cultures were equally
magnetically agitated. The intensity of light was set according to a radiometer
and the different temperatures were controlled by a cooled temperature water
bath (-10 to 100 °C). The 20 experiments were done in batch in 91h and
samples were collected at different physiological stages of the culture, at
maximum growth rate (log phase), at deceleration growth phase (2h initial at
the entrance of the stationary phase) and at stationary phase (60h after
reaching the maximum cell mass).
2.5 Determination of the cell mass and specific growth rate
The cell mass dry weight was determined as previously described
(Diniz et al., 2012), where a linear regression of the plot of the absorbance
(A600nm) versus dry mass (g/L) allowed the determination of the dry mass
corresponding to 1 unit of absorbance at 600 nm. One A600nm unit was found
7
1 cm
To determine the growth rate (μ), at least five points in the
exponential growth phase were collected to make a linear regression of the
plot of ln A600nm unit versus time (h).
2.6 Analytical methods
To extract the pigments, we adapted a method described by Kaiser et
al. (2007). This method was used to extract carotenoid from bacteria and
yeast and it was divided in four steps: disintegration of the cell, extraction,
separation, and quantitation. We substituted the process disintegration of the
cell to a mechanical cell disruption by shaking with a glass beads (70-100
U.S sieve) and DMSO (dimethylsulfoxide) for 5 min.
After extraction, we dissolved the pigment into petroleum ether to
quantify the total carotenoid yield (µg/g) by the formula (Rodriguez-Amaya,
2001):
Where A is the absorbance at 450 nm of the total carotenoid; V is the
total extract volume; W is the sample weight and A1% is the β-carotene
absorption coefficient in petroleum ether (2592).
3. RESULTS AND DISCUSSION
The results of molecular identification made by comparison of a large
yeast database of CBS-KNAW Fungal Biodiversity Centre were LSU
sequence differed in six nucleotides and ITS sequence differed in three
nucleotides of the type strain of Rhodotorula dairenensis (T. Haseg. and I. Banno) Fell, J.P. Gadanho and Sampaio. However, LSU sequence differed in
three nucleotides and ITS sequence differed in seven nucleotides of the type
strain of Rhodotorula mucilaginosa (A. Jörg.) F.C. Harrison. According to Gadanho and Sampaio (2002) the difference between R. mucilaginosa and
R. dairenensis is nitrate and nitrite utilization. The results of biochemical test Content of carotenoids (µg/g) = A x V (mL) x 104
A 1%
8
suggest that the UFV isolated Rhodotorula sp. is R. mucilaginosa, because the nitrate reduction did not occur.
In addition, a comparison of D1 and D2 from LSU 26S sequences and
ITS sequences of ribosomal RNA (rRNA) from the studied yeast with those of
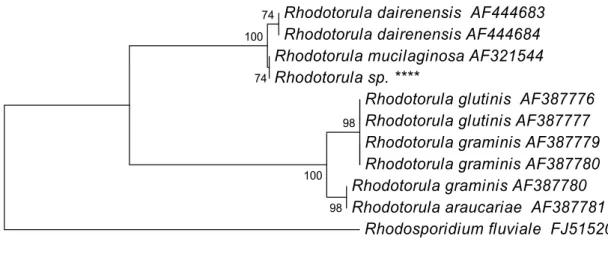
GenBank specimens showed high similarity (99%) with R. mucilaginosa. Corroborating to the molecular identification, we made a phylogenetic tree of
ITS sequence from the isolated yeast and from the related species of genus
Rhodotorula obtained from GenBank, with Rhodosporidium fluviale Fell, Kurtzman, Tallman & J.D. Buck as outgroup (Figure 1). The phylogenetic tree
showed that the isolated specimen remained in the same branch of R. mucilaginosa (AF321544) with a bootstrap value of 74.
Rhodotorula dairenensis AF444683 Rhodotorula dairenensis AF444684 Rhodotorula mucilaginosa AF321544 Rhodotorula sp. ****
Rhodotorula glutinis AF387776 Rhodotorula glutinis AF387777 Rhodotorula graminis AF387779 Rhodotorula graminis AF387780 Rhodotorula graminis AF387780 Rhodotorula araucariae AF387781
Rhodosporidium fluviale FJ515206 74 74 100 98 100 98 0.01
Figure 1. Phylogenetic tree of the UFV- isolated R. mucilaginosa and related species of the genus Rhodotorula, obtained by neighbor-joining analysis of the ITS region of the 5.8S rRNA, with R. fluviale as outgroup. Percentage bootstrap values of 1000 replicates are given at each node. GenBank accession numbers are indicated after strain designation.
The results of biochemical and molecular identification analysis
showed that, in fact, the specimen isolated is R. mucilaginosa.
R. mucilaginosa is a basidiomycetous yeast, that belongs to
Sporidiobolus clade (Fell et al., 2000); it has a wide distribution in terrestrial (Butinar et al., 2007; Maldonade et al., 2007), aquatic (Libkind et al., 2003)
and marine habitats (Lahav et al., 2002; Nagahama et al., 2001). It can be an
endophytic (Bura et al., 2012) and can also be found in human microbiota.
9
causes serious infections in patients who have immunodeficiency or undergo
transient or long-term immunosuppression (Galán-Sánchez et al., 1999).
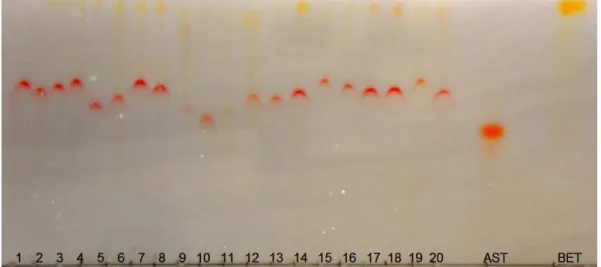
However, R. mucilaginosa presents a high potential to produce diverse and abundant carotenoids, such as β-carotene, but not synthesized
astaxanthin (Figure 2). According to Libkind and Brook (2006) the yeast can
synthesize beyond β-carotene, also torulene and torularhodin in many
proportions. The carotenogenesis is affected by many environmental and
physiological conditions, especially temperature (Johnson and Lewis, 1979;
Frengova and Beshkova, 2009), carbon sources (Fang and Chen, 1993) and
the singlet oxygen and superoxide formed during illumination (Schroeder and
Johnson, 1995a; Schroeder and Johnson, 1995b).
Figure 2. TLC plate showing the separation of the carotenoids synthesized by R. mucilaginosa in the 20 experiments of RSM. The mobile phase was methanol-acetone-toluene (5:20:75, v/v/v). AST: astaxanthin standard and BET: β-carotene standard.
The samples were collected at different physiological stages of the
culture (Figure 3A). The production of carotenoid was not proportional to the
growth rate (Figure 3B), typical of secondary metabolism (Griffin, 1994).
Although the amount of carotenoid depends on the amount of cell mass, it
was not related to the growth rate of yeast population. It means that the
process for carotenoids production should be designed in two stages: cell
mass formation in the first stage and carotenoids synthesis in the second. As
show in Figure 3B there is a greater accumulation of carotenoids in the
10
Figure 3. (A) Growth of R. mucilaginosa at 23 °C, 60 µmol m-2s-1 of light and
3.25% arabinose, gray arrows indicate points where samples were collected to analyze the carotenoid yield (µg/g) and black arrows the points considered to calculate the linear regression from what the slope value was taken as growth rate (B). The carotenoid yield in exponential growth phase and in stationary phase (2h and 60h after reaching maximum cell mass) evaluated by Tukey Test with probability of 5% and six repetitions.
The carotenogenesis of UFV-isolated R. mucilaginosa is related to the cellular maintenance and not with cellular growth. According to Goodwin
(1972), carotenoid accumulation in most yeast occurs in the late logarithmic
phase and continues in the stationary phase. The carotenoid yield was
reduced in the stationary phase (60h), perhaps because at this stage a large
amount of cells are unviable and growth rate approximate to zero. In that
condition the stress is higher than the cell can endure.
The results of central of composite design to determine the optimal
levels of light (µmol m-2s-1), arabinose (%w/v) and temperature (°C) for the
carotenoid yield and growth rate by R. mucilaginosa are shown in Tables 1
11
Table 1. Experimental central composite design (CCD) runs and corresponding carotenoid yield (µg/g) after 60 h in stationary phase.
Run order
Light (µmol m-2s-1)
Arabinose (%w/v)
Temperature (°C)
Carotenoid (µg/g)
1 20.0 1.50 18.0 62.6
2 100 1.50 18.0 84.6
3 20.0 5.00 18.0 41.4
4 100 5.00 18.0 90.2
5 20.0 1.50 28.0 47.9
6 100 1.50 28.0 53.6
7 20.0 5.00 28.0 50.8
8 100 5.00 28.0 71.5
9 -7.27 3.25 23.0 58.6
10 127 3.25 23.0 101
11 60.0 0.31 23.0 44.8
12 60.0 6.19 23.0 63.6
13 60.0 3.25 14.6 81.3
14 60.0 3.25 31.4 58.2
15 60.0 3.25 23.0 26.9
16 60.0 3.25 23.0 28.2
17 60.0 3.25 23.0 33.1
18 60.0 3.25 23.0 36.1
19 60.0 3.25 23.0 26.9
12
Table 2. Experimental central composite design (CCD) runs and corresponding cell mass (mg/g) and µ (h-1).
Run order
Light (µmol m-2s-1)
Arabinose (%w/v)
Temperature (°C)
Cell mass*
(mg/mL) µ (h
-1)
1 20.0 1.50 18.0 4.70 0.10
2 100 1.50 18.0 3.60 0.17
3 20.0 5.00 18.0 7.65 0.10
4 100 5.00 18.0 5.50 0.12
5 20.0 1.50 28.0 5.10 0.21
6 100 1.50 28.0 5.00 0.20
7 20.0 5.00 28.0 12.82 0.21
8 100 5.00 28.0 7.60 0.28
9 -7.27 3.25 23.0 3.71 0.12
10 127 3.25 23.0 3.50 0.12
11 60.0 0.31 23.0 4.25 0.23
12 60.0 6.19 23.0 8.00 0.25
13 60.0 3.25 14.6 4.41 0.09
14 60.0 3.25 31.4 8.24 0.15
15 60.0 3.25 23.0 8.80 0.31
16 60.0 3.25 23.0 9.00 0.29
17 60.0 3.25 23.0 8.80 0.29
18 60.0 3.25 23.0 8.37 0.29
19 60.0 3.25 23.0 8.90 0.33
20 60.0 3.25 23.0 9.27 0.35
*Cell mass accumulated after 60h in stationary phase.
The responses that provided total carotenoid yield (µg/g) and specific
maximum growth rate (h-1) of R. mucilaginosa were evaluated by analysis of
variance (Table 3 and 4). After the removal of terms relating to
non-significant variables (p>0.05), the parameters could be obtain by the
functions:
Total carotenoid = 379.14129 - 0.50369 Light - 24.46374 Temperature + 0.074678 Light Arabinose - 0.027770 Light Temperature + 0.52121
Arabinose Temperature + 0.010072 Light2 + 2.29807 Arabinose2 + 0.50135
Temperature2
µ = 1.30657 + 0.11835 Temperature -3.93259 x 10⁻⁵ Light2 - 6.69223 x 10⁻³
13
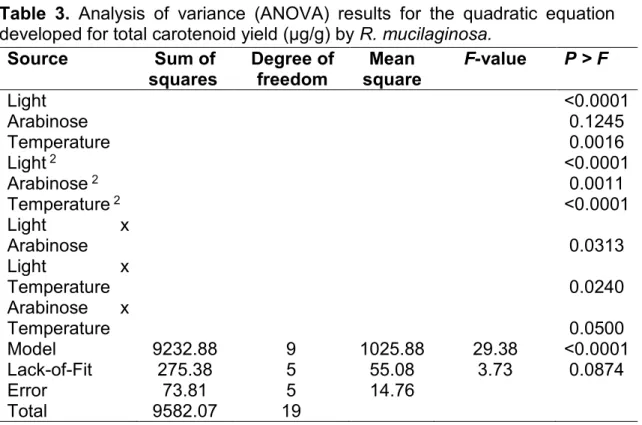
Table 3. Analysis of variance (ANOVA) results for the quadratic equation developed for total carotenoid yield (µg/g) by R. mucilaginosa.
Source Sum of
squares
Degree of freedom
Mean square
F-value P > F
Light <0.0001
Arabinose 0.1245
Temperature 0.0016
Light 2 <0.0001
Arabinose 2 0.0011
Temperature 2 <0.0001
Light x
Arabinose 0.0313
Light x
Temperature 0.0240
Arabinose x
Temperature 0.0500
Model 9232.88 9 1025.88 29.38 <0.0001
Lack-of-Fit 275.38 5 55.08 3.73 0.0874
Error 73.81 5 14.76
Total 9582.07 19
Table 4. Analysis of variance (ANOVA) results for the quadratic equation developed for growth rate (h-1) by R. mucilaginosa.
Source Sum of
squares Degree of freedom Mean square
F-value P > F
Light 0.2677
Arabinose 0.6293
Temperature 0.0025
Light 2 <0.0001
Arabinose 2 0.0482
Temperature
2 <0.0001
Light x
Arabinose 0.7653
Light x
Temperature 0.7653
Arabinose x
Temperature 0.2133
Model 0.13 9 0.014 11.93 0.0003
Lack-of-Fit 8.675 x 10⁻³ 5 1.735 x 10⁻³ 2.64 0.1550
Error 3.283 x 10⁻³ 5 6.567 x 10⁻⁴
14
The regression model presented statistical significance (F test), and
the analysis of variance was performed for the response surface of the
quadratic model (Tables 3 and 4). In addition, R2 of the model was 0.96 for
total carotenoid yield and 0.91 for growth rate (h-1), demonstrating that the
quadratic model was significant and the lack of fit was not significant
(p>0.05). The high R2 indicates fitness of the model (Weisberg, 1985).
In Figure 4 and 5 are shown the three-dimensional response surfaces
of the final model of total carotenoid yield (µg/g) and growth rate (h-1),
produced by R. mucilaginosa. The response surfaces were based on the final model, with one constant variable fixed at its optimal level, while the
remaining two factors varied within the experimental range.
The levels of light (µmol m-2s-1), arabinose (%w/v) and temperature
(°C), which created a maximum response of total carotenoid yield (93.92
µg/g) were 100 µmol m-2s-1, 5 % and 18 °C; and growth rate (0.31 h-1) were
63.6 µmol m-2s-1, 3.7 % and 24.6 °C. Furthermore, carotenoids are
intracellular components that cannot be excreted to the medium and the key
for biological carotenoid production is the cost of the cell mass production,
the concentration of carotenoids and their production inside the cell (Ausich,
1997). Although maximum specific growth rate does not always means
maximum total cell mass (Table 2), the productivity depends on response of
growth rate, because it can indicate how fast the cell will enter into stationary
15
16
17
The light intensity influenced carotenogenesis in R. mucilaginosa
(Table 3 and Figure 4), especially in a high intensity of light, such as 100
µmol m-2s-1, which was similar to result found in R. minuta (Tada and
Shiroishi, 1982). There are many reports on light effect in carotenogenesis
(Meyer and Du Preez, 1994; An, 1997; Sasaki et al., 2000; Stachowiak and
Czarnecki, 2007). According to Schroeder and Johnson (1995a), carotenoids
protect cells from photo-oxidative damage by scavenging harmful agents
such as singlet and triplet molecular species produced upon illumination,
through its structure of nine or more conjugated double bond.
Carotenogenesis is an important factor to protect R. mucilaginosa against oxidative stress, because Cu/Zn superoxide dismutase genes are silent in
this yeast, as consequence of no-functional promoters (Moore et al., 1989;
Hernandez-Saavedra, 2003). Furthermore, the color of carotenoid serves to
block out certain wavelengths of light that could otherwise damage the cell
(Chandi and Grill, 2011).
The interaction of light and temperature in carotenogenesis (Table 3)
was significant and our results agree with the reported of Bhosale and Gadre
(2002), which have investigated the production of β-carotene by R. glutinis in
a 1 L fermenter at different temperature and illumination conditions. In their
experiments, the optimum temperature for growth and β-carotene production
was 30 and 20 °C, respectively. At 30 °C, illuminating the fermenter in late
logarithmic phase resulted in a 58% increase of β-carotene production with a
concurrent decrease in torulene. However, at 20 °C, no appreciable increase
was observed, thus the interaction of light and temperature was essential to
carotenogenesis.
Although luminosity has higher influence on carotenogenesis, it also
affects growth rate (Table 4 and Figure 5). In this work, moderate intensity of
light (63.6 µmol m-2s-1) contributed to the maximum growth rate (0.31h-1) from R. mucilaginosa. According to Yen and Zhang (2011) the light could greatly enhance the cells growth rate and total lipid productivity in R. glutinis.
Temperature affects not only the growth kinetics of the microorganism
(Table 4) but also the carotenogenesis (Table 3), which can change the
18
Johnson & Lewis, 1979). In this work, the interaction of the variables showed
that the best temperature for total carotenoid yield (µg/g) was 18 °C, while for
the growth rate it was 24.6 °C. Different from earlier report, which mention R. mucilaginosa with higher specific growth and carotenoid formation rates at 25 to 30 °C, decreasing sharply above 30 °C (Aksu and Eren, 2005).
We demonstrated that arabinose concentration in the range of 1.5 to
5%w/v has a positive influence in carotenogenesis. Arabinose is one of the
most abundant pentose in nature (Izydorczyk and Biliaderi, 1995; Pan et al.,
2007). There are few studies on the use of pentose by R. mucilaginosa and the genes of this metabolic pathway (Xu et al., 2011; Bura et al., 2012).
However, R. mucilaginosa can grow at both pentose and hexose as carbon source (Bura et al., 2012). In this work, glycerol also showed higher cell mass
yield (data not showed) which suggest that it could be an alternative
substrate for carotenoid production from biodiesel, similar to the results
reported by Taccari et al. (2012).
The interaction of temperature and carbon concentration on growth
rate of R. mucilaginosa (Figure 5) also has been related in others studies of
pigmented yeast (Rossi et al., 2009 and Aksu and Eren, 2005).
Hence, this study established the light intensity, temperature and
arabinose concentration for higher growth rate (0.31h-1) and carotenoid
production (93.92 µg/g) by R. mucilaginosa. The potential of this yeast to synthesize carotenoids, in stressful conditions, such as simulated by low
growth rate is a promising condition for industrial production.
4. CONCLUSION
The pigmented yeast isolated from UFV campus orchard was
identified as Rhodotorula mucilaginosa. There is a greater accumulation of carotenoids in the earlier stationary phase than in maximum exponential
growth phase. The light intensity, temperature and arabinose concentration
19
in stressful conditions, and is considered as a candidate for future industrial
applications.
5. ACKNOWLEDGEMENTS
The authors are grateful to Coordenação de Aperfeiçoamento de
Pessoal de Nível Superior (CAPES), Fundação de Amparo à Pesquisa de
Minas Gerais (FAPEMIG) and Conselho Nacional de Desenvolvimento
Científico e Tecnológico (CNPq) for finantial support.
6. REFERENCES
1. Aksu, Z. and Eren, A.T., 2005. Carotenoids production by the yeast
Rhodotorula mucilaginosa: use of agricultural wastes as a carbon source.
Process Biochem. 40, 2985-2991.
2. Ambati, P. and Ayanna, C., 2001. Optimizing medium constituents and
fermentation conditions for citric acid production from palmyra jaggery
using response surface method. World J. Microbiol. Biotechnol. 17,
331-335.
3. An, G.-H., 1997. Photosensitization of the yeast Phaffia rhodozyma at a low temperature for screening carotenoid hyperproducing mutants. Appl.
Biochem. Biotechnol. 66, 263-268.
4. Ausich, R.L., 1997. Commercial opportunities for carotenoid production
by biotechnology. Pure and Appl. Chem. 69(10), 2169-2173.
5. Barreto, P; Castro, V. C.; Passos, F. J. V.; Passos, F. M. L., 2008.
Produção de astaxantina por levedura para uso na aquacultura. In: XXI
Congresso Brasileiro de Ciência e Tecnologia de Alimentos - CBCTA,
Belo Horizonte. Resumos. Belo Horizonte: XXI Congresso Brasileiro de
20
6. Bhosale, P. and Gadre, R.V., 2002. Manipulation of temperature and
illumination conditions for enhanced β-carotene production by mutant 32
of Rhodotorula glutinis. Lett. Appl. Microbiol. 34, 349-353.
7. Bhosale, P., 2004. Environmental and cultural stimulants in the
production of carotenoids from microorganisms. Appl. Microbiol.
Biotechnol. 63, 351-36.
8. Britton, G. and Yong A. J., 1993. Carotenoids in photosynthesis, London,
Glasgow: Chapman & Hall.
9. Bura, R.; Vajzovic, A.; Doty, S.L., 2012. Novel endophytic yeast
Rhodotorula mucilaginosa strain PTD3 I: production of xylitol and ethanol. J. Ind. Microbiol. Biotechnol. 39: 1003-1011.
10. Butinar, L.; Spencer-Martins, I.; Gunde-Cimerman, N., 2007. Yeasts in
high Arctic glaciers: the discovery of a new habitat for eukaryotic
microorganisms. A. van Leeuw. J. Microb.91, v. 277-289.
11. Buzzini, P., 2000. An optimization study of carotenoid production by
Rhodotorula glutinis DBVPGG 3853 from substrates containing concentrated rectified grape must as the sole carbohydrate source. J.
Ind. Microbiol. Biotechnol. 4, 41-45.
12. Chandi, G.K. and Gill, B.S., 2011. Production and characterization of
microbial carotenoids as an alternative to synthetic colors: a review. Int.
J. Food Prop. 14, 503-513.
13. Diniz, R.H.S; Silveira, W.B.; Fietoo, L.G.; Passos, F.M.L., 2012. The high
fermentative metabolism of Kluyveromyces marxianus UFV-3 relies on the increased expression of key lactose metabolic enzymes. A. van
21
14. Fang, T. J. and Chen, Y.-S., 1993. Improvement of astaxanthin
production by Phaffia rhodozyma through mutation and optimization of culture conditions. J. Ferment. Bioeng. 75 (6), 466-469.
15. Fell, J. W.; Boekhout, T.; Fonseca, A.; Scorzetti, G. and Statzell-Tallman,
A, 2000. Biodiversity and systematics of basidiomycetous yeasts as
determined by large-subunit rRNA D1/D2 domain sequence analysis. Int.
J. Syst. Evol. Micr. 50, 1351-1371.
16. Frengova, G. I. and Beshkova, D. M., 2009. Carotenoids from
Rhodotorula and Phaffia: yeast of biotechnological importance. J. Ind. Microbiol. Biotechnol. 36, 163-180.
17. Frengova, G., Simova, E., Pavlova, K., Beshkova, D., Grigorova,
D.,1994. Formation of carotenoids by Rhodotorula glutinis in whey ultrafiltrate. Biotechnol. Bioeng. 44, 888-894.
18. Gadanho, M. and Sampaio, J.P., 2002. Polyphasic taxonomy of the
basidiomycetous yeast genus Rhodotorula: Rh. glutinis sensu stricto and
Rh. dairenensis comb. nov. FEMS Yeast Res.. 2, 47-58.
19. Galán-Sánchez, F.; García-Martos, P.; Rodríguez-Ramos, C,
Marín-Casanova, P. and Mira-Gutiérrez, J., 1999. Microbiological
characteristics and susceptibility patterns of strains of Rhodotorula
isolated from clinical samples. Mycopathologia. 145, 109-112.
20. Gerrits van den Ende, A. H. G., and De Hoog, G. S., 1999. Variability and
molecular diagnostics of the neurotropic species Cladophialophora
bantiana. Stud. Mycol. 43, 151-162.
21. Gharibzahedi, S. M. T.; Razavi, S. H.; Mousavi, S. M.; Moayedi, V., 2012.
High efficiency canthaxanthin production by a novel mutant isolated from
22
22. Goodwin, T.W., 1972. Carotenoids in fungi and non-photosynthetic
bacteria. Prog. Ind. Microbiol. 11, 29-88.
23. Griffin, D.H., 1994. Fungal Physiology. Wiley-Liss, USA.
24. Hernandez-Saavedra, N.Y., 2003. Cu, Zn superoxide dismutase in
Rhodotorula and Udeniomyces spp. isolated from sea water: cloning and sequencing the encoding region. Yeast. 20, 479-492.
25. Izydorczyk, M.S. and Biliaderi, C.G., 1995. Cereal arabinoxylans:
advances in structure and physicochemical properties. Carbohydr.
Polym. 28: 33-48.
26. Johnson, E. A. and Lewis, M. J., 1979. Astaxanthin formation by the
yeast Phaffia rhodozyma. J. Gen. Appl. Microbiol. 115, 173-183.
27. Kaiser, P.; Surmann, P.; Vallentin, G.; Fuhrmann, H., 2007. A small-scale
method for quantitation of carotenoids in bacteria and yeasts. J.
Microbial. Biotech. 70, 142-149.
28. Lahav, R.; Fareleira, P.; Nejidat, A.; Abeliovich, A., 2002. The
identification and characterization of osmotolerant yeast isolates from
chemical wastewater evaporation ponds. Microb. Ecol. 43, 388-396.
29. Libkind, D. and van Broock, M, 2006. Biomass and carotenoid pigment
production by patagonian native yeasts. World J. Microb. Biot. 22,
687-692.
30. Libkind, D.; Brizzio, S.; Ruffini, A.; Gadanho, M.; van Broock, M.V. and
Sampaio, P., 2003. Molecular characterization of carotenogenic yeasts
from aquatic environments in Patagonia, Argentina. A. van Leeuw. J.
23
31. Liu, Y.S.; Wu, J.W., 2006. Hydrogen peroxide-induced astaxanthin
biosynthesis and catalase activity in Xanthophyllomyces dendrorhous.
Appl. Microbiol. Biotechnol. 73, 663-668.
32. Maldonade, I.R.; Scamparini, A.R.P.; Rodriguez-Amaya,D.B., 2007.
Selection and characterization of carotenoid-producing yeasts from
Campinas region, Brazil. Braz. J. Microbiol. 38, 65-70.
33. Meyer, P. S. & Du-Preez, J. C., 1994. Astaxanhin production by a Phaffia rhodozyma mutant on grape juice. World J. Microb. Biot. 10, 178-183.
34. Moore, M.M.; Breedveld, M.W.; Auotr, A.P., 1989. The role of
carotenoids in preventing oxidative damage in the pigmented yeast,
Rhodotorula mucilaginosa. Arch. Biochem. Biophys. 270 (2), 419-431.
35. Nagahama, T.; Hamamoto, M.; Nakase, T.; Takami, H. and Horikoshi, K.,
2001. Distribution and identification of red yeasts in deep-sea
environments around the northwest Pacific Ocean. A. van Leeuw. J.
Microb. 80, 101-110.
36. Nelis, H.J. and De Leenheer, A.P., 1991. Microbial sources of carotenoid
pigments used in foods and feeds. J. Appl. Bacteriol. 70, 181-191.
37. Pan, X.; Xie, D.; Yu, R.W.; Lam, D.; Saddler, J.N., 2007. Pretreatment of
lodgepole pine killed by mountain pine beetle using the ethanol
organosolv process: fractionation and process optimization. Ind. Eng.
Chem. Res. 46, 2609-2617.
38. Parajó, J.C.; Santos, V.; Vásquez, M.; Cruz, J.M., 1997. Production of
carotenoids by Xanthophyllomyces dendrorhous growing on enzymatic hydrolysates of prehydrolysed wood. Food Chem. 3, 347-355.
39. Rao, A.V. and Rao, L.G., 2007. Carotenoids and human health.
24
40. Rhodes, J.C. and Roberts, G.D., 1975. Comparison of four methods for
determining nitrate utilization by Cryptococci. J. Clin. Microbiol. 1 (1),
9-10.
41. Rodriguez-Amaya, D.B., 2001. A guide to carotenoid analysis in foods.
ILSI PRESS, Campinas-Brazil.
42. Rodríguez-Sáiz, M.; de la Fuente, J. L.; Barredo, J. L., 2010.
Xanthophyllomyces dendrorhous for the industrial production of astaxanthin. Appl. Microbiol. Biotechnol. 88, 645-658.
43. Saitou, N. and Nei, S., 1987. The neighbor-joining Method: a new
method for reconstructing phylogenetic trees. Mol. Biol. Evol. 4(4),
406-425.
44. Sasaki, H.; Nakanishi, T.; Satonaka, K.-Y.; Miki, W.; Fujita, T.;
Komemushi, S., 2000. Properties of a high-torularhodin producing mutant
of Rhodotorula glutinis cultivated under oxidative stress. J. Biosci. Bioeng. 89(2), 203-205.
45. Schroeder, W. A. and Johnson, E. A., 1995a. Singlet oxygen and peroxyl
radicals regulate carotenoid biosynthesis in Phaffia rhodozyma. J. Biol. Chem. 270 (31), 18374-18379.
46. Schroeder, W. A. and Johnson, E. A., 1995b. Carotenoids protect Phaffia rhodozyma against singlet oxygen damage. J. Ind. Microbiol. 14, 502-507.
47. Sharma, P.; Goel, R.; Capalash, N., 2007. Bacterial laccases. World J.
25
48. Stachowiak, B. and Czarnecki, Z., 2007. Effect of light on carotenoid
yield in fed cultures of Phaffia rhodozyma CBS5626. Pol. J. Food Nutr. Sci. 57 (3), 129-131.
49. Taccari, M.; Canonicoa, L.; Comitinia, F.; Mannazzub, I.; Ciania, M.,
2012. Screening of yeasts for growth on crude glycerol and optimization
of biomass production. Bioresource Technol. 110, 488-495.
50. Tada, M. and Shiroishi, M., 1982. Mechanism of photoregulated
carotenogenesis in Rhodotorula minuta. I. Photocontrol of carotenoid production. Plant. Cell. Physiol. 23, 541-547.
51. Vázquez, M., 2001. Effect of the light on carotenoid profiles of
Xanthophyllomyces dendrorhous strains (formerly Phaffia rhodozyma). Food Technol. Biotech. 39 (2), 123-128.
52. Vilgalys, R. and Hester, M., 1990. Rapid genetic identification and
mapping of enzymatically amplified ribosomal DNA from several
Cryptococcus species. J. Bacteriol. 172 (8), 4238-4246.
53. Weisberg, S., 1985. Applied Linear Regression, John Wiley & Sons, New
York.
54. Xu, P.; Bura, R. and Doty, S.L., 2011. Genetic analysis of D-xylose
metabolism by endophytic yeast strains of Rhodotorula graminis and
Rhodotorula mucilaginosa. Genet. Mol. Biol. 34 (3), 471-478.
55. Yen, H.-W. and Zhang, Z., 2011. Enhancement of cell growth rate by
26
ANEXO
Biochemical test of nitrate reduction
Right tube, positive control (Escherichia coli) for nitrate reduction. Left tube, uninoculated negative control. Middle tube, UFV-isolated Rhodotorula sp. with no nitrate reduction.
HPLC chromatograms
27
Experimental central composite design (CCD) runs and corresponding cell mass (mg/mL) and carotenoid yield (µg/g) of R. mucilaginosa.
Run order
Malt extract (%w/v)
Glycerol (%v/v)
H2O2
(mmoL/L-1)
Cell mass* (mg/mL)
Carotenoid yield (µg/g)
1 1.50 1.50 2.00 0.56 1857
2 5.00 1.50 2.00 0.78 1385
3 1.50 5.00 2.00 0.83 619.2
4 5.00 5.00 2.00 0.97 1055
5 1.50 1.50 8.00 0.62 730.5
6 5.00 1.50 8.00 0.75 1206
7 1.50 5.00 8.00 0.85 987.3
8 5.00 5.00 8.00 0.97 652.9
9 0.30 3.25 5.00 0.55 1757
10 6.19 3.25 5.00 0.84 624.9
11 3.25 0.31 5.00 0.61 799.1
12 3.25 6.19 5.00 0.78 838.8
13 3.25 3.25 -0.04 0.94 737.9
14 3.25 3.25 10.0 0.75 979.3
15 3.25 3.25 5.00 0.82 989.4
16 3.25 3.25 5.00 0.82 851.7
17 3.25 3.25 5.00 0.80 1092
18 3.25 3.25 5.00 0.76 883.4
19 3.25 3.25 5.00 0.84 767.0
20 3.25 3.25 5.00 0.81 731.5
28
Experimental central composite design (CCD) runs and corresponding carotenoid yield (µg/g).
Run order
Light (µmol m-2s-1)
Arabinose (%w/v)
Temperature (°C)
Carotenoid (µg/g)
Log S* (2 h) S* (60 h)
1 20.0 1.50 18.0 16.5 39.3 62.6
2 100 1.50 18.0 64.2 53.8 84.6
3 20.0 5.00 18.0 70.9 59.7 41.4
4 100 5.00 18.0 59.6 54.8 90.2
5 20.0 1.50 28.0 15.4 45.3 47.9
6 100 1.50 28.0 17.2 60.5 53.6
7 20.0 5.00 28.0 20.1 33.3 50.8
8 100 5.00 28.0 36.7 56.6 71.5
9 -7.27 3.25 23.0 44.4 30.0 58.6
10 127 3.25 23.0 45.0 95.3 101
11 60.0 0.31 23.0 17.8 64.6 44.8
12 60.0 6.19 23.0 32.8 40.0 63.6
13 60.0 3.25 14.6 28.5 42.0 81.3
14 60.0 3.25 31.4 36.1 35.0 58.2
15 60.0 3.25 23.0 22.0 46.0 26.9
16 60.0 3.25 23.0 31.4 32.7 28.2
17 60.0 3.25 23.0 27.9 42.4 33.1
18 60.0 3.25 23.0 29.2 42.4 36.1
19 60.0 3.25 23.0 26.0 44.3 26.9
20 60.0 3.25 23.0 19.2 52.8 28.0