Development and Validation of a
Gene-Based Model for Outcome Prediction in Germ
Cell Tumors Using a Combined Genomic and
Expression Profiling Approach
James E. Korkola1¤a, Sandy Heck2, Adam B. Olshen3¤b, Darren R. Feldman4, Victor E. Reuter5, Jane Houldsworth1¤c, George J. Bosl4, R. S. K. Chaganti1,4*
1Cell Biology Program, Sloan-Kettering Institute for Cancer Research, New York, New York, United States of America,2Departments of Medicine and Pathology, Weill Cornell Medical College, New York, New York, United States of America,3Department of Epidemiology and Biostatistics, Memorial Sloan Kettering Cancer Center, New York, New York, United States of America,4Department of Medicine, Memorial Sloan-Kettering Cancer Center, New York, New York, United States of America,5Department of Pathology, Memorial Sloan-Kettering Cancer Center, New York, New York, United States of America
¤a Current address: Oregon Health & Science University, Portland, Oregon, United States of America ¤b Current address: University of California San Francisco, San Francisco, California, United States of America
¤c Current address: Cancer Genetics, Inc., Rutherford, New Jersey, United States of America *[email protected]
Abstract
Germ Cell Tumors (GCT) have a high cure rate, but we currently lack the ability to accu-rately identify the small subset of patients who will die from their disease. We used a com-bined genomic and expression profiling approach to identify genomic regions and underlying genes that are predictive of outcome in GCT patients. We performed array-based comparative genomic hybridization (CGH) on 53 non-seminomatous GCTs
(NSGCTs) treated with cisplatin based chemotherapy and defined altered genomic regions using Circular Binary Segmentation. We identified 14 regions associated with two year dis-ease-free survival (2yDFS) and 16 regions associated with five year disease-specific sur-vival (5yDSS). From corresponding expression data, we identified 101 probe sets that showed significant changes in expression. We built several models based on these differen-tially expressed genes, then tested them in an independent validation set of 54 NSGCTs. These predictive models correctly classified outcome in 64–79.6% of patients in the valida-tion set, depending on the endpoint utilized. Survival analysis demonstrated a significant separation of patients with good versus poor predicted outcome when using a combined gene set model. Multivariate analysis using clinical risk classification with the combined gene model indicated that they were independent prognostic markers. This novel set of pre-dictive genes from altered genomic regions is almost entirely independent of our previously identified set of predictive genes for patients with NSGCTs. These genes may aid in the identification of the small subset of patients who are at high risk of poor outcome. OPEN ACCESS
Citation:Korkola JE, Heck S, Olshen AB, Feldman DR, Reuter VE, Houldsworth J, et al. (2015) Development and Validation of a Gene-Based Model for Outcome Prediction in Germ Cell Tumors Using a Combined Genomic and Expression Profiling Approach. PLoS ONE 10(12): e0142846. doi:10.1371/journal.pone.0142846
Editor:Candace Kerr, University of Maryland, UNITED STATES
Received:May 1, 2015
Accepted:October 27, 2015
Published:December 1, 2015
Copyright:© 2015 Korkola et al. This is an open access article distributed under the terms of the
Creative Commons Attribution License, which permits unrestricted use, distribution, and reproduction in any medium, provided the original author and source are credited.
Data Availability Statement:All relevant data are within the paper and its supporting information files.
Funding:This work was supported by NIH P30 CA008784, The Byrne Fund, MSKCC.
Background
Germ cell tumors (GCTs) are the most common solid malignancy in young adult men, with a peak incidence between the ages of 18 and 35 [1]. Fortunately, the cure rate for this disease is very high, such that greater than 90% of all new patients achieve long-term survival [1]. Even when patients present with metastatic disease, cures can be achieved in nearly 80% of cases [1].
Currently, patients are risk stratified using the International Germ Cell Cancer Collabora-tive Group (IGCCCG) prognostic classification, which is based on histology (seminoma [SEM] versus non-seminoma [NSGCT]), serum marker levels of alpha-fetoprotein (AFP), human chorionic gonadatropin (HCG), and lactate dehydrogenase (LDH), the presence of non-pul-monary visceral metastases, and the site of the primary tumor (gonadal versus mediastinal) [1]. Based on these parameters, patients are assigned to good, intermediate, and poor risk catego-ries. Treatment decisions are based on this risk stratification, with patients in the good risk cat-egory typically receiving either three cycles of BEP (bleomycin, etoposide, and cisplatin) or four cycles of EP (etoposide and cisplatin) [1,2], while intermediate and poor risk patients receive four cycles of BEP [1,3]. While the IGCCCG classification is useful for making treat-ment decisions, it does not perform as well in predicting patient outcome. For example, approximately 45% of poor risk patients are cured [1], but we currently have no means of dis-tinguishing those who will die of disease from those who will be cured. The addition of prog-nostic molecular markers could improve patient outcome prediction, as well as identify patients who might benefit from more aggressive or alternative treatments that are traditionally reserved for second line or salvage therapies, such as high dose chemotherapy with stem cell rescue or ifosfamide based therapies [4].
To this end, we previously performed a large expression based study to identify genes associ-ated with patient outcome [5]. While we were successful in developing gene based models that were highly predictive of outcome in NSGCT patients, this approach does have shortcomings. Specifically, since the model building methods we utilized are based on average expression in the poor versus good outcome groups, genes that may be highly predictive of outcome but are expressed in small subsets of tumors will have limited predictive power in the whole panel and thus be excluded. Recently, computational analyses have been described to identify these out-lier populations [6], but we chose an alternative approach making use of the genomic copy number analyses. We examined genomic alterations for correlation with patient outcome. We identified a number of regions, some of which were altered infrequently, that had very strong correlations with outcome. Since we lacked an independent CGH data set, we instead examined expression of genes that map to the altered regions associated with outcome to identify poten-tial predictive genes and build predictive models. We then validated these predictive gene expression models in an independent tumor cohort to determine their clinical utility.
Methods
Tumor Material
accession number GSE8614; expression profiles are available under accession numbers GSE3218 and GSE10783). Of the 74 tumors we previously profiled by array CGH, 53 were NSGCT that had been treated with cisplatin-based chemotherapy and had patient follow-up data, which were utilized for this study. The validation set consisted of an additional 54 NSGCT specimens for which we had no array CGH data but had expression data from our pre-vious expression profiling studies. Of these 54, 49 had sufficient follow-up for 5yDSS calcula-tions. The clinical information for all samples used in this study and our previous expression based study [5] are included asS1 Table. Normal testes samples from aged matched patients were used as normal controls, as described previously [8].
DNA Isolation and array CGH
DNA was isolated as previously described [7]. Array CGH (aCGH) was performed as previ-ously described using 1 Mb resolution BAC chips (Spectral Genomics) [7]. Additional copy number analysis was done using high-resolution Agilent 44K snp chips, and was performed by the Integrated Genomic Operation at MSKCC.
Statistical Analysis
independent tumor cohort for which we had expression and follow-up data but no genomic copy number data. This independent cohort consisted of two tumor sets that were profiled at different times. To avoid differences that may have arisen as a result of using different batches of arrays, the second set of tumors was normalized so that the median expression value for each gene matched the expression value for the corresponding gene from the first set of tumors (which were a subset of the tumors used to build the predictive model but which lacked copy number data).
Results
We previously completed a large study examining copy number changes in tumors from 74 GCT patients [7]. In the present study, we tested for associations between copy number alter-ations and outcome in a subset of 53 of NSGCT patients that were treated with cisplatin based chemotherapy and for whom we had clinical outcome information. Although these tumors represent a diverse set of NSGCT specimens with multiple histologic subtypes, which we have previously described [9], histology has not been shown as being an important predic-tive or prognostic marker for NSGCT, as evidenced by its absence in the IGCCCG risk strati-fication [13]. Thus, we used the entire cohort to examine two different outcome endpoints (2y Disease Free Survival (DFS) and 5y Disease Specific Survival (DSS)) using Fisher’s exact test for this study.
2yDFS Associations
We identified 14 regions (5 gains, 9 losses) that were associated with 2yDFS in the 53 patients
(Table 1). The size of the alteration associated with 2yDFS ranged from a single BAC (loss of
chr17, at 16.3 Mb) to almost the entire chromosome arm (loss of chr4q, 60.9 Mb-190.6 Mb). The alterations were present in a minimum of 5 patients (range, 5–30 patients, median 14.5). All regions were associated with poor patient outcome with the exception of gain of a region on 12q (82.3–83.6 Mb), which was associated with good patient outcome (Odds Ratio, OR = 0.18). There were four regions that had an infinite OR, as all patients who had the alter-ation had poor outcome (gain chr9, 72.7–120.8 Mb; gain chr18, 0.1–4 Mb; loss chr12, 41.2–
47.4; loss chr17, 16.3 Mb)
To determine which, if any, genes were potential targets of these alterations, we first identi-fied genes that mapped to the altered regions, and then used SAM to identify significantly dif-ferentially expressed genes as described in the methods. In particular, we focused on genes that showed at least a two-fold difference in expression, since smaller magnitude changes would likely be difficult to assess in clinical specimens. For nine of the regions, we were able to identify significant genes that were differentially expressed between tumors with alterations and tumors with normal copy number and/or normal testes specimens (Table 1). In total, there were 39 probe sets (representing 31 unique genes) that were differentially expressed at greater than a two-fold level between tumors with alterations and the tumors without alterations at the corre-sponding region.
5yDSS Associations
For 5yDSS, we identified 16 regions that showed associations with poor patient outcome, which were present in a minimum of 3 patients (range, 3–30 patients, median 16.5;Table 2). The smallest region was ~5 Mb in size (chr17, 0.7–5.9 Mb), while almost all of chr4 losses (0–
showed full or partial overlap with 2yDFS outcome-associated regions, including gain of chr14 (62.9–76.5 Mb), and losses of chr1 (19.2–26.4 Mb), chr4 (1.1–38.1 Mb and 72.7–190.6 Mb), and chr9 (0.2–35.9 Mb and 123.3–128.5 Mb).
For eight of the regions, we were unable to identify any genes that showed significant differ-ential expression between tumors with the alteration compared to those with normal copy number. For one other region (gain of chr14, 38.7–41.8 Mb), we identified 10 significant probe sets, but none showed a two- or three-fold difference relative to tumors with normal copy num-ber or normal testes specimens respectively. From the remaining seven regions, we identified 75 probe sets (representing 62 unique genes) that were significantly differentially expressed between tumors with the alterations and those with normal copy number (Table 2). As expected, several of the genes showed overlap with the genes associated with 2yDFS, including
ACTN1,ALDH6A1,CPEB2,DLST,FBXL5,MED6,PGF,SGPP1, andSYNPO2.
Validation of Copy Number Changes
Although we have previously published the copy number data, we felt it was important to vali-date the copy number calls in several samples since we were now associating the alterations with outcome. We confirmed the copy number changes in three tumor samples using the Agi-lent 44K chip platform for copy number changes. There was excelAgi-lent agreement in the
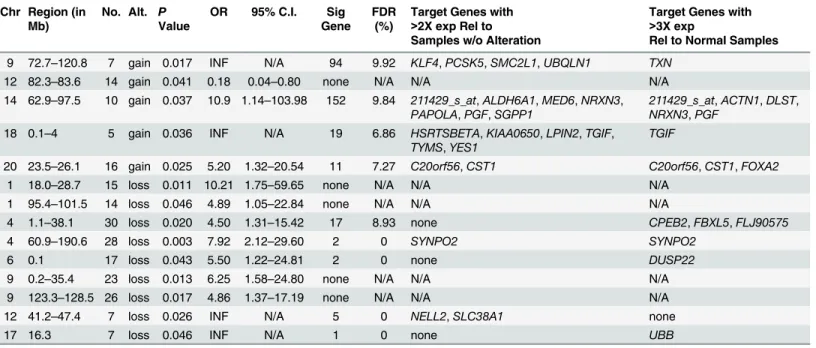
Table 1. Genomic regions and putative target genes associated with 2yDFS in NSGCT patients.
Chr Region (in Mb)
No. Alt. P Value
OR 95% C.I. Sig Gene
FDR (%)
Target Genes with
>2X exp Rel to Samples w/o Alteration
Target Genes with
>3X exp
Rel to Normal Samples
9 72.7–120.8 7 gain 0.017 INF N/A 94 9.92 KLF4,PCSK5,SMC2L1,UBQLN1 TXN
12 82.3–83.6 14 gain 0.041 0.18 0.04–0.80 none N/A N/A N/A
14 62.9–97.5 10 gain 0.037 10.9 1.14–103.98 152 9.84 211429_s_at,ALDH6A1,MED6,NRXN3,
PAPOLA,PGF,SGPP1
211429_s_at,ACTN1,DLST,
NRXN3,PGF
18 0.1–4 5 gain 0.036 INF N/A 19 6.86 HSRTSBETA,KIAA0650,LPIN2,TGIF,
TYMS,YES1
TGIF
20 23.5–26.1 16 gain 0.025 5.20 1.32–20.54 11 7.27 C20orf56,CST1 C20orf56,CST1,FOXA2
1 18.0–28.7 15 loss 0.011 10.21 1.75–59.65 none N/A N/A N/A
1 95.4–101.5 14 loss 0.046 4.89 1.05–22.84 none N/A N/A N/A
4 1.1–38.1 30 loss 0.020 4.50 1.31–15.42 17 8.93 none CPEB2,FBXL5,FLJ90575
4 60.9–190.6 28 loss 0.003 7.92 2.12–29.60 2 0 SYNPO2 SYNPO2
6 0.1 17 loss 0.043 5.50 1.22–24.81 2 0 none DUSP22
9 0.2–35.4 23 loss 0.013 6.25 1.58–24.80 none N/A N/A N/A
9 123.3–128.5 26 loss 0.017 4.86 1.37–17.19 none N/A N/A N/A
12 41.2–47.4 7 loss 0.026 INF N/A 5 0 NELL2,SLC38A1 none
17 16.3 7 loss 0.046 INF N/A 1 0 none UBB
Chr: chromosomal location of copy number alteration associated with outcome Region: chromosomal region associated with outcome
No.: number of tumors that display the copy number alteration Alt.: copy number alteration type (gain or loss)
p-value: p-value of the association between copy number alteration and outcome OR: odds ratio for the event
95% C.I.: 95% confidence interval of the odds ratio
Sig. Gene: number of significantly differentially expressed genes that map to region FDR: false discovery rate of significant genes mapping to region
identification of altered genomic regions between the different platforms, with concordance rates of 92.7, 97.6, and 97.2, confirming the accuracy of the copy number alteration calls (S1 Fig). The processed copy number data from the Agilent arrays is available asS2 Table.
Outcome Prediction
We used the tumors that we had identified the differentially expressed genes to build predictive models for both 2yDFS and 5yDSS, and then tested the models in an independent validation set of 54 NSGCT specimens (49 NSGCT for 5yDSS) for which we had expression but not geno-mic data, to avoid over-fitting of the predictive model.
Table 2. Genomic regions and putative target genes associated with 5yDSS in NSGCT patients.
Chr Region (in Mb)
No. Alt P Value
OR 95% C.I. Sig Genes
FDR (%)
Target Genes with
>2X exp Rel to Samples w/o Alteration
Target Genes with>3X exp Rel to Normal Samples
14 38.7–41.8 8 Gain 0.026 9.00 1.32–61.14 6 10 none none
14 62.9–76.5 11 Gain 0.018 7.93 1.48–42.58 104 9.76 ALDH6A1,MED6,SGPP1 ACTN1,DLST,PGF
18 26.1–77.6 3 Gain 0.029 INF N/A 74 9.34 226974_at,227542_at,233446_at,
239911_at,ACAA2,B4GALT6,C18orf10,
DSC2,DSG2,FLJ20793,KIAA1468,
LOC284267,ME2,MYO5B,NARS,
NEDD4L,P15RS,POLI,RKHD2,SLC39A6,
SMAD4,TNFRSF11A
226974_at,227542_at,233446_at,
239911_at,ACAA2,DSC2,DSG2,
MYO5B,NEDD4L,TNFRSF11A
1 19.2–26.4 15 Loss 0.040 5.04 1.13–22.50 None N/A N/A N/A
1 83.8–92.1 13 Loss 0.034 5.63 1.24–25.49 None N/A N/A N/A
2 78.5–118.7 5 Loss 0.013 INF N/A 114 9.69 238768_at,ACTR3,ANAPC1,ASCC3L1,
EIF2AK3,INPP4A,LOC129531,MAP4K4,
RANBP2,RW1,SEPT10,STARD7,
TGOLN2,TXNDC9
241234_at,BUB1,C2orf23,
GCC2,JMJD1A,LIPT1,MAP4K4,
RANBP2,RANBP2L1,SEPT10,
UXS1,VPS24
2 163.1–
178.6
10 Loss 0.026 7.27 1.31–40.43 29 7.78 none AGPS,LOC401022,MTX2
4 0–58.2 30 Loss 0.009 5.82 1.53–22.17 14 5.42 HOP CPEB2,FBXL5,HOP,KIAA1458
4 72.7–190.6 28 Loss 0.001 10.70 2.46–46.53 2 0 SYNPO2 SYNPO2
6 78.6–84.6 19 Loss 0.027 4.71 1.25–17.71 None N/A N/A N/A
7 102.6–
121.2
6 Loss 0.015 17.50 1.56–
196.33
None N/A N/A N/A
9 0.2–35.9 23 Loss 0.002 8.40 2.12–33.29 None N/A N/A N/A
9 116.9–
128.5
26 Loss 0.031 4.67 1.25–17.36 None N/A N/A N/A
14 38.7–41.8 19 Loss 0.024 5.14 1.29–20.52 None N/A N/A N/A
14 62.9–70.5 18 Loss 0.047 4.37 1.07–17.79 None N/A N/A N/A
17 0.7–5.9 12 Loss 0.025 7.20 1.35–38.33 44 7.06 CXCL16,SERPNIF1 GPS2,SERPINF1
Chr: chromosomal location of copy number alteration associated with outcome Region: chromosomal region associated with outcome
No.: number of tumors that display the copy number alteration Alt.: copy number alteration type (gain or loss)
p-value: p-value of the association between copy number alteration and outcome OR: odds ratio for the event
95% C.I.: 95% confidence interval of the odds ratio
Sig. Gene: number of significantly differentially expressed genes that map to region FDR: false discovery rate of significant genes mapping to region
For 2yDFS, the full set of 39 probe sets was optimal, but only gave a prediction rate of 64.2% in the independent tumor set. This is consistent with our findings from our expression only studies [5], in which we were unable to identify a strong signature that predicted 2yDFS.
For 5yDSS, the full set of 75 probe sets was optimal, giving a prediction rate of 75.6% in the independent data set. Since 2yDFS is also strongly correlated with 5yDSS (i.e, patients with poor 2yDFS are more likely to have poor 5yDSS), and given the high degree of overlap between the regions and genes identified for the two outcome endpoints, we decided to model the effect of including the non-overlapping genes identified in the 2yDFS screen (101 total probe sets) with the 5yDSS gene set. We built a model with the combined gene sets in the training cohort and tested it in the independent validation cohort. Interestingly, the combined set of genes gave a superior performance in the independent data set (prediction rate of 79.6%). This result was not unexpected, since patients with poor 2yDFS would be more likely to have poor 5yDSS, as mentioned above.
Based on the predicted outcome using only the 5yDSS associated probe sets or the combined set of probe sets in the independent tumor set, we performed survival analysis by the Kaplan-Meier method (Fig 1A and 1B). In both cases, patients with good predicted outcome had signifi-cantly better survival than those with poor predicted outcome (p<0.001 when using all genes;
p= 0.018 when using the genes associated with 5yDSS). For the full set of genes, a multivariate analysis using linear regression and IGCCCG classification as a continuous variable showed that the gene set was an independent prognostic factor (p= 0.017 for gene model,p= 0.002 for IGCCCG risk). Similarly, if the IGCCCG was used as a binary variable (with intermediate and poor risk classes combined to account for the relatively small sample size; N = 27), the gene set was still significant (p= 0.016 for gene model,p= 0.012 for binary IGCCCG risk). As expected, when we applied the gene predictor to patients with elevated risk (i.e., intermediate or poor risk), there was a significant difference in patient survival, as shown by the Kaplan-Meier method (Fig 1C), indicating that the gene signature may have clinical utility in stratifying high risk patients. Anecdotally, there was only one good risk patient in the independent set of tumors that died of disease, and this patient was predicted to die from disease by the combined gene model.
Since the approach of identifying outcome-associated genes using this combined genomic and expression profiling would be expected to identify genes that were expressed in subsets of
Fig 1. A.Kaplan-Meier curves show differential survival of patients with predicted good (red) and poor (blue) outcome using the full set of genes associated with 2yDFS and 5yOS.B.Kaplan-Meier curves show differential survival of patients with predicted good (red) and poor (blue) outcome using genes associated with 5yOS.C.Kaplan-Meier curves show differential survival of patients with intermediate and poor IGCCCG risk with predicted good (red) or poor (blue) outcome using genes associated with 2yDFS and 5yOS.
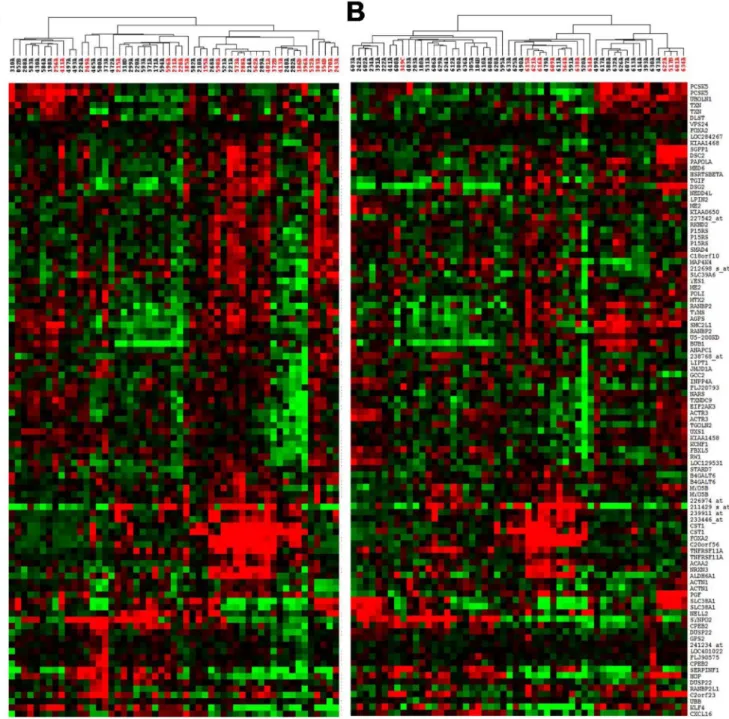
patients, we performed hierarchical clustering on both sets of tumors (i.e. combined array CGH-expression set and the independent expression set) to visualize the tumor and gene grouping patterns. As expected, there were mixtures of small, distinct subgroups consisting of good and poor outcome patients based on variable gene expression across these specimens (see
Fig 2), as opposed to our previous expression-only based study which showed strong
separa-tion of good and poor outcome patients into distinct groups [5].
Fig 2. Hierarchical clustering of outcome associated genes in training set (A) and validation set (B) showing poor outcome in distinct subsets of tumors.Red samples indicate patients who died from disease prior to 5 years.
Comparison to expression gene sets
We compared the gene lists that we generated in the present study to the ones from our expres-sion only study [5]. Of the 104 unique probe sets from the combined CGH-expression study and the 174 probe sets from the expression only study, there were three genes that showed overlap (SYNPO2,HOP, andCPEB2). Interestingly, all three of these genes mapped to chr4, which was lost in a high percentage of cases.
Discussion
Development of high throughput screening techniques over the past decade have led to the identification of a number of gene sets that are predictive of patient outcome in a number of different cancers, including breast [14], lung [15], and prostate [16]. Due to the relative rarity of GCTs, there have not been any large scale studies to identify such predictive gene sets in tes-tes cancer until recently. We completed a large study with both training and validation sets to identify genes associated with patient outcome using an expression based approach [5]. While these gene sets are useful, one limitation of our previous approach is that gene expression is averaged over the entire group. As a result, genes that are only expressed in a small subset of patients but are highly correlated with patient outcome may be missed. While computational approaches may allow the identification of such changes [6], we chose a different approach to identifying genes that are found only in subsets of tumors. We used array CGH, a well-accepted and accurate method for measuring copy number alterations [17], to identify genomic regions associated with patient outcome. We then identified significant genes from our expression pro-filing studies that mapped to those regions. We were then able to build an outcome prediction model and validate it in an independent set of tumor specimens.
This approach allowed us to identify altered genomic regions that were associated with both 2yDFS as well as 5yDSS. We identified a number of regions that overlapped between the two endpoints, which would be expected since patients that had poor 2yDFS (i.e., they had an incomplete response to chemotherapy or relapsed within two years) would be more likely to have poor 5yDSS than patients who had a complete response. These regions included gain of chr14 and losses on chr1, 4, and 9.
kidney cancer, and that expression ofNELL2contributes toHNF4αmediated inhibition of pro-liferation in kidney cells [22].
Given that we did not have an additional CGH cohort available for validation, we instead focused on genes that mapped within the regions of interest. Since we knew the types of changes (i.e., gain or loss), we used SAM to identify genes that showed at least 2 fold expression level changes in the expected direction (increase for gains, decrease for losses) in order to maxi-mize their potential predictive power. This was in part due to the fact that any assays that are developed in the future will likely require at least 2-fold changes in expression in order to be reproducibly detected between good and poor outcome patient groups.
The genes we identified showed very little overlap with the genes that we previously identi-fied in our expression only approach [5]. This was not surprising, since the combined aCGH-expression approach would be expected to identify genomic regions and genes that had alter-ations associated with outcome that were present in subsets of samples, whereas the expression only approach identifies genes that on average, are expressed in either good or poor outcome groups. The exception to this was the presence of three genes (SYNPO2,HOP, andCPEB2) in both studies, which was not unexpected since all three map to chr4, which is lost in a large pro-portion of tumors, and thus could be expected to be present in a large enough number of sam-ples to be identified without genomic information. Interestingly, bothHOPandSYNPO2have been implicated as tumor suppressor genes,HOPin female choriocarcinomas associated with hydatiform moles and esophageal tumors, andSYNPO2in bladder and prostate cancer [23,24].
The performance of combined CGH-expression classifier is difficult to compare with the pre-dictive ability of our previously expression only based classifier [21] since the validation sets dif-fered in composition. This was due to the fact that some of the samples in the original training set did not have array CGH data available, while some of the original validation set did have array CGH data available, leading to different makeup of both the training and validation sets between the two studies. Unfortunately, no independent data sets exist to our knowledge, and thus a rigorous comparison of the predictive abilities of the two methods is not possible at this time. As a result, at this time we can only state that the performance of our new predictor appears similar to that of our original expression predictor; although the gene sets share almost no commonality. Anecdotally, we did observe an individual case that differed between the two sets. This was sample 616A, from a patient who died of disease, who was predicted to have poor outcome by the expression-based predictor, but good outcome by the combined CGH-expres-sion-based predictor. Interestingly, all other misclassified cases that overlapped between the two validation sets were consistent: one case in which the patient died of disease (634A), in which both predictors classified the patient as a good outcome case, and two cases in which the predic-tors gave a poor prognosis but the patients survived past the 5y cutoff (611A, 626A). These latter cases may represent surgical cures, which cannot be predicted by gene expression methods.
Interestingly, for many of the regions that were associated with outcome, we were unable to identify significantly differentially expressed genes mapping to those regions. There may be several explanations for this. First, it is possible that methylation events may lead to silencing of the target genes in poor outcome patients without the genomic alteration, and thus would be difficult to detect as being differentially expressed when performing the comparison. Another possibility is that small non-coding RNA’s could map to these regions, and their expression could influence expression of other vital target genes that lie outside the altered regions. Indeed, microRNAs that target TP53 have been identified in GCT cell lines [25].
copy number control to eliminate any small polymorphic regions that might have been present in patient samples that might have been identified as associated with outcome. Unfortunately, matched normal specimens were not readily available to us for this study. However, we feel it is unlikely that any of the genomic changes associated with outcome are due to germline poly-morphisms, since most of the regions we identified are much larger than typical polymor-phisms that have been observed in individuals.
The genes that we identified were highly predictive of patient outcome in an independent set of tumor specimens, and represent a non-overlapping set of genes from the predictive gene sets that we had previously identified. As with our other predictive gene set [5], this gene list is an independent prognostic indicator when combined with IGCCCG risk stratification. Addi-tionally, the gene set appears to be effective in further stratifying patients who are at higher risk, which could be beneficial in identifying patients who would benefit from more stringent monitoring and/or aggressive chemotherapy. Adaptation of these genomic regions or gene sets into clinically applicable assays could improve outcome prediction in GCT patients, and may provide novel targets for therapeutic intervention.
Supporting Information
S1 Fig. Comparison of copy number alteration calls made between array CGH (black) and Agilent 44K snp chips (red) for three GCT samples.The y-axis in each plot denotes copy number level (either gain, normal, or loss) and the x-axis denotes position, ordered by chromo-some from 1 to X. Note the excellent concordance scores for the copy number calls, and the gain of 12p in all three samples.
(TIF)
S1 Table. Table outlining clinical features for the patients included in this study.
(XLSX)
S2 Table. Copy number calls for the three tumors run on the Agilent snp chips, ordered from 1 to X chromosome.
(XLSX)
Acknowledgments
The authors wish to thank the MSKCC genomics core facility for hybridization, washing, and imaging of the Affymetrix and Agilent microarrays for expression analysis.
Author Contributions
Conceived and designed the experiments: JEK JH RSKC. Performed the experiments: JEK SH VER. Analyzed the data: JEK ABO. Wrote the paper: JEK RSKC. Clinical inputs and review and manuscript review: DRF GJB.
References
1. Bosl GJ, Motzer RJ. Testicular germ-cell cancer. N Engl J Med. 1997; 337(4):242–53. Epub 1997/07/
24. PMID:9227931.
2. Kondagunta GV, Bacik J, Bajorin D, Dobrzynski D, Sheinfeld J, Motzer RJ, et al. Etoposide and cis-platin chemotherapy for metastatic good-risk germ cell tumors. J Clin Oncol. 2005; 23(36):9290–4.
Epub 2005/12/20. 23/36/9290 [pii] doi:10.1200/JCO.2005.03.6616PMID:16361627.
cell tumors. J Clin Oncol. 2007; 25(3):247–56. Epub 2007/01/20. 25/3/247 [pii] doi:10.1200/JCO.2005.
05.4528PMID:17235042.
4. Voss MH, Feldman DR, Bosl GJ, Motzer RJ. A review of second-line chemotherapy and prognostic models for disseminated germ cell tumors. Hematol Oncol Clin North Am. 2011; 25(3):557–76, viii–ix.
PMID:21570609. doi:10.1016/j.hoc.2011.03.007
5. Korkola JE, Houldsworth J, Feldman DR, Olshen AB, Qin LX, Patil S, et al. Identification and validation of a gene expression signature that predicts outcome in adult men with germ cell tumors. J Clin Oncol. 2009; 27(31):5240–7. PMID:19770384. doi:10.1200/JCO.2008.20.0386
6. Tomlins SA, Rhodes DR, Perner S, Dhanasekaran SM, Mehra R, Sun XW, et al. Recurrent fusion of TMPRSS2 and ETS transcription factor genes in prostate cancer. Science. 2005; 310(5748):644–8.
PMID:16254181.
7. Korkola JE, Heck S, Olshen AB, Reuter VE, Bosl GJ, Houldsworth J, et al. In vivo differentiation and genomic evolution in adult male germ cell tumors. Genes Chromosomes Cancer. 2008; 47(1):43–55.
Epub 2007/10/19. doi:10.1002/gcc.20504PMID:17943972.
8. Korkola JE, Houldsworth J, Chadalavada RS, Olshen AB, Dobrzynski D, Reuter VE, et al. Down-regu-lation of stem cell genes, including those in a 200-kb gene cluster at 12p13.31, is associated with in vivo differentiation of human male germ cell tumors. Cancer Res. 2006; 66(2):820–7. PMID:16424014.
9. Korkola JE, Houldsworth J, Dobrzynski D, Olshen AB, Reuter VE, Bosl GJ, et al. Gene expression-based classification of nonseminomatous male germ cell tumors. Oncogene. 2005; 24(32):5101–7.
PMID:15870693.
10. Olshen AB, Venkatraman ES, Lucito R, Wigler M. Circular binary segmentation for the analysis of array-based DNA copy number data. Biostatistics. 2004; 5(4):557–72. PMID:15475419.
11. Tusher VG, Tibshirani R, Chu G. Significance analysis of microarrays applied to the ionizing radiation response. Proc Natl Acad Sci U S A. 2001; 98(9):5116–21. PMID:11309499.
12. Tibshirani R, Hastie T, Narasimhan B, Chu G. Diagnosis of multiple cancer types by shrunken centroids of gene expression. Proc Natl Acad Sci U S A. 2002; 99(10):6567–72. PMID:12011421.
13. International Germ Cell Consensus Classification: a prognostic factor-based staging system for meta-static germ cell cancers. International Germ Cell Cancer Collaborative Group. J Clin Oncol. 1997; 15 (2):594–603. PMID:9053482.
14. van de Vijver MJ, He YD, van't Veer LJ, Dai H, Hart AA, Voskuil DW, et al. A gene-expression signature as a predictor of survival in breast cancer. N Engl J Med. 2002; 347(25):1999–2009. Epub 2002/12/20.
doi:10.1056/NEJMoa021967347/25/1999 [pii]. PMID:12490681.
15. Chen HY, Yu SL, Chen CH, Chang GC, Chen CY, Yuan A, et al. A five-gene signature and clinical out-come in non-small-cell lung cancer. N Engl J Med. 2007; 356(1):11–20. Epub 2007/01/05. 356/1/11 [pii]
doi:10.1056/NEJMoa060096PMID:17202451.
16. Dhanasekaran SM, Barrette TR, Ghosh D, Shah R, Varambally S, Kurachi K, et al. Delineation of prog-nostic biomarkers in prostate cancer. Nature. 2001; 412(6849):822–6. Epub 2001/08/24. doi:10.1038/
35090585[pii]. PMID:11518967.
17. Pinkel D, Albertson DG. Array comparative genomic hybridization and its applications in cancer. Nature genetics. 2005; 37 Suppl:S11–7. doi:10.1038/ng1569PMID:15920524.
18. Noel EE, Perry J, Chaplin T, Mao X, Cazier JB, Joel SP, et al. Identification of genomic changes associ-ated with cisplatin resistance in testicular germ cell tumor cell lines. Genes Chromosomes Cancer. 2008; 47(7):604–13. Epub 2008/04/04. doi:10.1002/gcc.20564PMID:18384131.
19. Wilson C, Yang J, Strefford JC, Summersgill B, Young BD, Shipley J, et al. Overexpression of genes on 16q associated with cisplatin resistance of testicular germ cell tumor cell lines. Genes Chromosomes Cancer. 2005; 43(2):211–6. Epub 2005/03/12. doi:10.1002/gcc.20173PMID:15761863.
20. Rao PH, Houldsworth J, Palanisamy N, Murty VV, Reuter VE, Motzer RJ, et al. Chromosomal amplifica-tion is associated with cisplatin resistance of human male germ cell tumors. Cancer Res. 1998; 58 (19):4260–3. PMID:9766648.
21. Murty VV, Houldsworth J, Baldwin S, Reuter V, Hunziker W, Besmer P, et al. Allelic deletions in the long arm of chromosome 12 identify sites of candidate tumor suppressor genes in male germ cell tumors. Proc Natl Acad Sci U S A. 1992; 89(22):11006–10. PMID:1332066.
22. Grigo K, Wirsing A, Lucas B, Klein-Hitpass L, Ryffel GU. HNF4 alpha orchestrates a set of 14 genes to down-regulate cell proliferation in kidney cells. Biol Chem. 2008; 389(2):179–87. Epub 2008/01/01. doi:
10.1515/BC.2008.011PMID:18163890.
24. Yu YP, Luo JH. Myopodin-mediated suppression of prostate cancer cell migration involves interaction with zyxin. Cancer Res. 2006; 66(15):7414–9. Epub 2006/08/04. 66/15/7414 [pii] doi:
10.1158/0008-5472.CAN-06-0227PMID:16885336.
25. Voorhoeve PM, le Sage C, Schrier M, Gillis AJ, Stoop H, Nagel R, et al. A genetic screen implicates miRNA-372 and miRNA-373 as oncogenes in testicular germ cell tumors. Cell. 2006; 124(6):1169–81.