Non-flat audiograms in sensorineural hearing loss
and speech perception
Kelly Cristina Lira de Andrade,IPedro de Lemos Menezes,IIAline Teno´rio Lins Carnau´ba,IRenato Glauco de Sousa Rodrigues,III Mariana de Carvalho Leal,ILiliane Desgualdo PereiraIV
IUniversidade Federal de Pernambuco (UFPE), Fonoaudiologia, Recife/PE, Brazil.IIUniversidade Estadual de Cieˆncias da Sau´de de Alagoas, Maceio´/AL,
Brazil.IIIUniversidade Federal do Rio Grande (FURG), Fı´sica, Rio Grande/RS, Brazil.IVUniversidade Federal de Sa˜o Paulo (UNIFESP), Escola Paulista de Medicina, Fonoaudiologia, Sa˜o Paulo/SP, Brazil.
OBJECTIVE: The audibility thresholds for the sound frequency of 137 upward- and downward-sloping audiograms showing sensorineural hearing loss were selected and analyzed in conjunction with speech recognition thresholds obtained from individuals seen at a public otolaryngology clinic to determine which frequencies in slope audiograms best represent speech recognition thresholds.
METHOD:The linear regression model and mean square error were used to determine the associations between the threshold values.
RESULT:The mean square error identified larger errors when using thresholds of 500, 1000, and 2000 Hz than when using audibility thresholds of 500, 1000, 2000, and 4000 Hz. The linear regression model showed a higher correlation (91%) between the audiogram thresholds for frequencies of 500, 1000, 2000, and 4000 Hz than for the frequencies of 500, 1000, and 2000 Hz (88%).
CONCLUSION:Frequencies of 500, 1000, 2000, and 4000 Hz were the most significant in predicting the speech recognition threshold.
KEYWORDS: Speech Perception; Speech Discrimination Tests; Test; Speech Reception Threshold; Hearing Loss.
Andrade KC, Menezes PL, Carnau´ba AT, Rodrigues RG, Leal MC, Pereira LD. Non-flat audiograms in sensorineural hearing loss and speech perception. Clinics. 2013;68(6):815-819.
Received for publication onDecember 3, 2012;First review completedDecember 20, 2012;Accepted for publication onFebruary 19, 2013 E-mail: [email protected]
Tel.: 55 82 3315-6813
& INTRODUCTION
For years, the question of which audiogram sound frequencies contribute to the speech recognition threshold (SRT) in the presence of downward-sloping hearing loss, with steep slopes at high frequencies, has been discussed in the literature. The relationship between pure-tone-thresh-olds at 500, 1000, and 2000 Hz and the speech reception threshold was studied in 1946 by Carhart (1), who noted which type of curve, duration, and type of hearing loss interfered with this relationship.
The purpose of assessing the SRT is to measure an individual’s speech reception at a given intensity to predict day-to-day communication problems. The SRT aids in selecting hearing aids and indicating the need for cochlear implants (2,3), and it contributes to the diagnosis of functional or psychogenic hearing loss.
Sensorineural hearing loss has been linked to speech understanding difficulties, especially in downward-sloping audiograms (4). A group of young individuals with normal hearing, who were presented with noise masks to simulate downward-sloping hearing loss, showed reductions in speech understanding (5).
A sound level difference of up to 10 dB higher than the mean threshold obtained at frequencies of 500, 1000, and 2000 Hz is acceptable for the SRT, particularly in cases with a downward-sloping audiometric configuration (6). There is much disagreement among authors regarding the sound frequencies involved in predicting the SRT.
Frequencies of 500, 1000, and 2000 Hz are optimal guides for predicting the SRT, except in cases of downward-sloping hearing loss with steep slopes at high frequencies. In 1971, Robert Carhart (7), one of the founders of audiology, recommended that audibility thresholds of 500 and 1000 Hz be used in these cases.
A simplified formula for predicting the speech reception threshold was recommended by Fletcher and Galt (8), who suggested using the average value for the two best audiogram thresholds obtained among frequencies of 500, 1000, and 2000 Hz.
Audiogram frequencies were studied using a multiple regression equation, such as the method proposed by
Copyrightß2013CLINICS– This is an Open Access article distributed under the terms of the Creative Commons Attribution Non-Commercial License (http:// creativecommons.org/licenses/by-nc/3.0/) which permits unrestricted non-commercial use, distribution, and reproduction in any medium, provided the original work is properly cited.
No potential conflict of interest was reported.
Quiggle et al. for predicting speech reception thresholds (9). Quiggle observed a higher correlation using weighted frequencies of 500, 1000, and 1500 Hz compared with speech reception thresholds. Frequencies above 2000 Hz did not improve or worsen the correlation.
In another study, Kryter et al. (10) obtained more data on the relationship between auditory acuity for pure tones and speech recognition ability and established correlation coefficients for frequencies of 500, 1000, 2000, 3000, 4000, and 6000 Hz in several speech tests. The investigation revealed the importance of higher frequencies, suggesting that mean audibility thresholds between frequencies of 1000, 2000, and 3000 Hz and between 2000, 3000, and 4000 Hz would be equivalent and suitable for predicting speech reception thresholds. In practice, the mean thresh-olds for frequencies of 1000, 2000, and 3000 Hz have produced better outcomes. In a study conducted by Gjaevenes (11), the author proposed a regression equation based on the correlation between the speech reception thresholds and different pure-tone thresholds, obtaining the highest correlation indices with frequencies of 500, 1000, and 3000 Hz.
Despite the consensus among scientists regarding the need for a mathematical operation to obtain a marker corresponding to the relationship between hearing and communication, the audiogram frequencies that best repre-sent the speech recognition threshold in cases of a non-flat audiogram in hearing loss have not been determined.
This study aimed to ascertain the contribution of each pure tone to the SRT. These data may help determine the impact of hearing loss on the communication process, as the audiogram provides clues to understanding communication disorders and facilitates the early detection of ear diseases. It is important to emphasize that part of the daily routine of an audiologist is to determine the consistency between different audiologic measures of hearing loss, such as the SRT and audiogram.
& MATERIALS AND METHODS
Data were collected from the medical charts of indivi-duals treated at a public otolaryngology clinic between 2006 and 2011. The objective of the study was to determine which audiogram frequencies represent the SRT in a non-flat audiogram in sensorineural hearing loss.
The following inclusion criteria were established: exam-inations with audiometric configurations consisting of an upward- and downward-sloping ramp, with minimum differences of 20 dB between the frequencies of 500 and 1000 Hz, 1000 and 2000 Hz, or 500 and 2000 Hz and type A tympanograms; acoustic reflexes present; and an age ranging from 18 to 60 years. Exclusion criteria were exposure to occupational or leisure noise, ear surgery, more than three ear infections within the past year, use of ototoxic medication, and the presence of hereditary deafness. In total, 137 audiograms were selected: 64 from women and 73 from men. The audibility thresholds at the audiogram frequencies were studied based on the combinations presented in Table 1.
The present study investigated the interference of the weighted frequencies selected to minimize the differences between each combination and the SRT. After data tabula-tion, we used two methods to highlight which audiogram frequency combinations exhibited a greater relationship
with the SRT, i.e., the combinations that yielded a smaller error.
The first method employed was the mean square error (MSE), which can be used as a measure of prediction errors. The MSE is the sum of the squared prediction errors divided by the number of errors in the calculation (12). PC-based software in the C++language was developed to apply the
MSE to determine the initial and final errors of each frequency combination.
The second method applied was linear regression. This technique showed which of the eight audiogram frequencies (250, 500, 1000, 2000, 3000, 4000, 6000, and 8000 Hz) best represented the SRT as a dependent variable. A weighted mean was then calculated and rounded to the nearest whole number. This result was considered the model of audiogram frequencies for the present study. Finally, this model and the mean audiogram frequencies at 500, 1000, and 2000 Hz were statistically analyzed and individually compared with the SRT using the Wilcoxon and bivariate correlation tests, with the degree of linear relationship indicated by Pearson’s coefficient.
To understand what occurs with the SRT and the audiogram when there is a difference between the audibility threshold at frequencies of 500, 1000, and 2000 Hz and a SRT.10 dB, we created another set of data from a group exhibiting these traits. These data were used to investigate which combinations of audiogram frequencies (T1 and Q1) were significant in predicting the SRT according to the mathematical model adopted in this study. The Wilcoxon signed ranks test was applied to perform this comparison.
The data are presented in tables and graphs that show the mean acuity thresholds and their respective standard deviations (SDs) and 95% confidence intervals (CIs).
The linear regression and the other statistical tests were calculated using PASW StatisticsH 17.0. (IBM, USA). A significance level of 0.05 was established (i.e.,p-values,0.05 were considered significant). The beta value was set at 0.1.
Ethics
The procedures were in accordance with the ethical standards of the committee responsible for human experi-mentation and with the Helsinki Declaration of 1975, which was revised in 1983.
& RESULTS
The study sample consisted of the audibility thresholds of 137 audiograms, corresponding to tone threshold audio-metry examinations of 64 women and 73 men. The mean
Table 1 -Frequency combinations selected for the study.
Combinations Frequencies (Hz)
T1 500 1000 2000
T2 500 1000 4000
T3 250 4000 80000
T4 500 1000 2000 4000
Q1 500 1000 2000 4000
Q2 250 500 1000 2000
Q3 250 500 1000 4000
Q4 250 500 2000 4000
P1 500 1000 2000 4000 8000
P2 500 1000 2000 4000 6000
P3 250 500 1000 2000 4000
(SD) age of the sample population was 38.2 (5.53) years (range, 18 to 60 years).
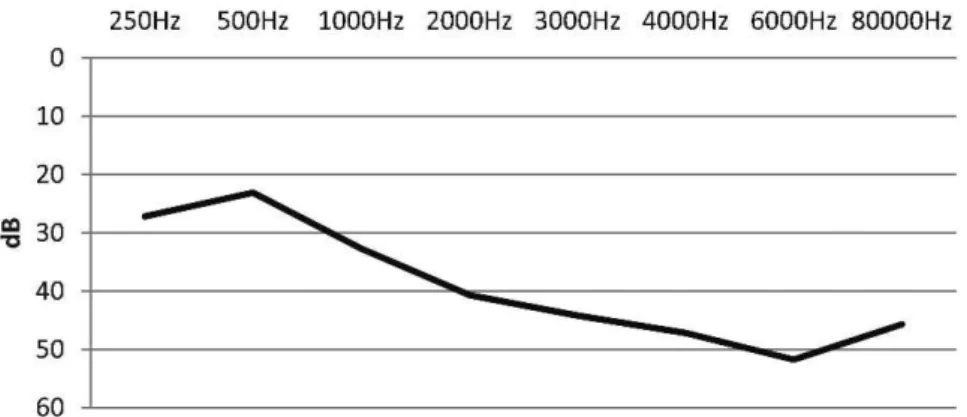
Figure 1 shows the mean audibility threshold for the frequencies of 500, 1000, and 2000 Hz selected as inclusion criteria. The data in the first analysis were classified according to the type of audiogram slope (i.e., downward-or upward-sloping).
The analysis of audiogram data considering all frequen-cies together revealed downward-sloping hearing loss (Figure 2).
The MSE, used to determine frequency combinations exhibiting the smallest error when compared with the SRT,
showed that the combination of the frequencies 500, 1000, and 2000 Hz (T1) contains an initial and final error of 16.34 and 15.63 dB2, respectively. The other frequency groups displayed a smaller error (final) with the frequency combinations: Q1 (15 dB2), Q3 (14.5 dB2), P1 (14.2 dB2), P2 (14.4 dB2), P3 (14.5 dB2), and Octo (14 dB2).
Table 2 depicts the B coefficients, calculated to demon-strate the importance of each audiogram frequency in the SRT.
According to this method, the combination of frequencies in Q1 was the most significant, withp,0.05. The frequencies of 250, 3000, 6000, and 8000 Hz were the least important in predicting the SRT because the B coefficient approached zero.
A linear regression was applied to all proposed combina-tions, i.e., T, Q, P, and O, with those combinations including the mean of frequencies T1 and Q1 deemed important combinations.
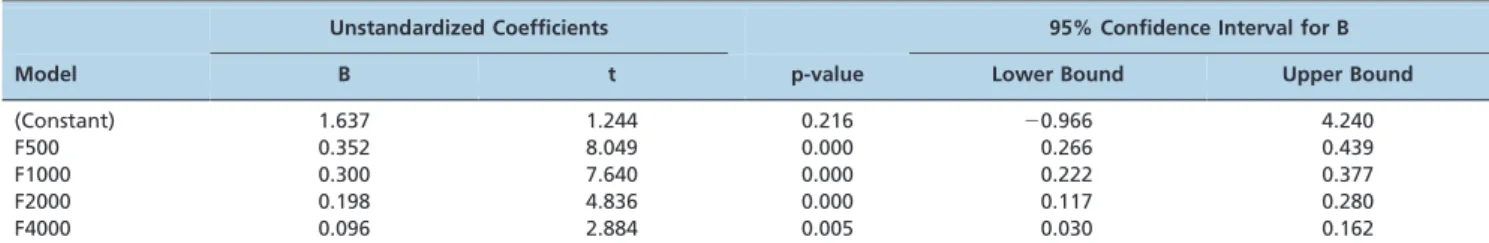
Another study on the B coefficient was conducted with data from the audiogram frequencies most important for predicting the SRT, i.e., those nearest to whole numbers. Table 3 depicts the beta values, p values, and 95% CIs for combination Q1. It is important to emphasize that all beta values were significant in predicting the SRT.
Based on the data presented in Table 3, the weights assigned to 500, 1000, 2000, and 4000 Hz were 4, 3, 2, and 1, respectively, for the combination Q1. A comparison between the weighted Q1 and T1 and the SRT using the Wilcoxon test revealedp= 0.910 andp= 0.889, respectively.
The bivariate correlation test between the two models and the SRT, with the degree of linear relationship reflected by Pearson’s coefficient, showed significant values (p,0.000)
Figure 1 -The mean audibility threshold for frequencies of 500, 1000, and 2000 Hz classified according to the type of audiogram slope.
Figure 2 -The mean audibility threshold for all frequencies and audiograms.
Table 2 -Calculated B coefficients for each audiogram frequency in the SRT.
Unstandardized Coefficients 95% Confidence Interval for B
Model B t p-value Lower Bound Upper Bound
(Constant) 1.107 0.781 0.437 21.699 3.912
F250 0.090 1.553 0.123 20.025 0.205
F500 0.277 3.917 0.000 0.137 0.417
F1000 0.308 7.773 0.000 0.230 0.387
F2000 0.216 3.830 0.000 0.105 0.328
F3000 20.015 20.192 0.848 20.174 0.143
F4000 0.122 2.026 0.045 0.003 0.240
F6000 20.054 21.085 0.280 20.153 0.045
and correlation coefficients of 0.930 and 0.935 for the T1-and Q1-weighted combinations, respectively.
We found audiograms of 46 ears with a difference between the mean audibility threshold of frequencies 500, 1000, and 2000 Hz and the SRT of more than 10 dB. The mean differences between the models and the SRT were 25.1 dB for T1 and 23.7 dB for the weighted Q1, and the Wilcoxon signed ranks test showed a lower, statistically significant Q1 error, with ap= 0.001.
& DISCUSSION
The present study, in contrast to most of those found in the literature (1,7-10), investigated the relationship between the SRT and audiogram frequencies in a sample character-ized by non-flat audiograms associated with hearing loss. This choice is justified because the more the pure-tone threshold curve tends toward a linear configuration, the less relevant the mean combinations of audibility thresholds at these frequencies are in predicting the SRT. For a completely linear curve, one need only determine the individual value of any of the pure-tone thresholds.
In previous audiology studies (1,7-10,13), investigators looked for correlations between the auditory pure-tone thresholds and speech tests. There has been no consensus on which audiogram frequencies best represent speech.
According to the MSE applied in the present study, the combinations Q1, Q3, P1, P2, P3, and O1 had a smaller error than T1 compared with the SRT. For the linear regression method, Q1 and T1 produced the best results. According to the two statistical methods applied, two combinations of frequencies exhibited better correlations with the SRT. The first combination (Q1) encompasses frequencies of 500, 1000, 2000, and 4000 Hz, and the second combination (T1) is the mean audibility threshold at the frequencies 500, 1000, and 2000 Hz used in audiology.
These findings differ from those obtained by Camargo et al (14) in patients with predominantly conductive hearing loss. The authors found that the SRT was closest to the mean of 250, 500, 1000, and 2000 Hz. This result partially corroborates the study conducted by Harris et al. (15), who demonstrated a relationship between hearing loss at 500, 1000, 2000, 4000, and 6000 Hz and speech perception. However, the results also agree with those reported by Cassiola et al. (16), who demonstrated a greater proximity between the SRT and the mean audibility threshold for frequencies between 500 and 4000 Hz.
Classifying the degree of hearing loss indicates an individual’s speech perception difficulty, and the findings of the present study demonstrate that frequency thresholds of 500, 1000, 2000, and 4000 Hz must be taken into account, in accordance with Bureau International d’Audiophonologie (BIAP) recommendation no. 02/01 bis (17,18).
In clinical audiology, audiograms often show a difference of more than 10 dB between the SRT threshold and pure-tone thresholds of 500, 1000, and 2000 Hz, as demonstrated by Berger (19).
In the present study, when the difference between the SRT and the mean of the frequencies 500, 1000, and 2000 Hz was greater than 10 dB, the two combinations tested exhibited similar responses compared with the SRT.
The new weighted model that we propose is as efficient as the mean of the frequencies 500, 1000, and 2000 Hz commonly observed in audiological practice, and it yields a significant improvement in specific situations (in non-flat audiograms). A change in the model should be made only if it results in significant gains in auditory diagnosis. We suggest conducting further studies aimed at using the new model adopted by BIAP (17), as it is more efficient in different hearing assessment situations.
The weighted audiogram frequencies of 500, 1000, 2000, and 4000 Hz in patients with non-flat sensorineural hearing loss audiograms were more efficient in representing the SRT and predicting speech perception than the mean of 500, 1000, and 2000 Hz. Including the frequency of 4 kHz opens the possibility of considering notches in audiograms whenever they may be present (20).
& ACKNOWLEDGMENTS
We thank the staff of the San Francisco Edit for the editing and English review. We also acknowledge the support of CNPq.
& AUTHOR CONTRIBUTIONS
Andrade KC planned, conducted the research, and was responsible for the manuscript writing. Menezes PL provided advice, planned, conducted the research, and wrote the manuscript. Carnau´ba AT conducted the research. Rodrigues RG planned the study. Leal MC planned and provided advice. Pereira LD provided advice and wrote the manuscript.
& REFERENCES
1. Carhart R. Individual differences in hearing for speech. Ann Otol Rhinol Laryngol. 1946;55(1):233-66.
2. Penrod JI. Speech Discrimination Testing. In: Katz J (ed.) Handbook of Clinical Audiology. Baltimore: MD, 1994;235-55.
3. Gelfand SA. Speech audiometry. In: Gelfand SA. Essentials of audiology. New York: Thieme Medical Publishers, 1997;253-86.
4. Humes LE. Speech understanding in the elderly. J Am Acad Audiol. 1996;7(3):161-7.
5. Humes LE, Roberts L. Speech recognition difficulties of the hearing-impaired elderly: the contributions of audibility. J Speech Hear Res. 1990;33(4):726-35.
6. Musiek FE, Rintelmann WF. Contemporary Perspectives in Hearing Assessment. Boston: Allyn and Bacon, 1999;72-133.
7. Carhart R. Observations on Relations between Thresholds for pure tones and for speech. J Speech Hear Dis. 1971;36(S6):476-83.
8. Fletcher H, Galt RH. A method of calculating hearing loss for speech from an audiogram. J Acoust Soc Am. 1950;22(1):1-5, http://dx.doi.org/ 10.1121/1.1906567.
9. Quiggle RR, Gloring A, Delk JH, Summerfield AB. Predicting hearing loss for speech from pure tone audiograms. Laringoscope. 1957;67(1):1-15. Table 3 -Comparison of beta values for Q1.
Unstandardized Coefficients 95% Confidence Interval for B
Model B t p-value Lower Bound Upper Bound
(Constant) 1.637 1.244 0.216 20.966 4.240
F500 0.352 8.049 0.000 0.266 0.439
F1000 0.300 7.640 0.000 0.222 0.377
F2000 0.198 4.836 0.000 0.117 0.280
10. Kryter KD, Williams C, Green DM. Auditory acuity and the perception of speech. J Acoust Soc Am. 1962;34(1):1217-23, http://dx.doi.org/10. 1121/1.1918305.
11. Gjaevenes K. Estimating speech reception threshold from pure tone hearing loss. J Aud Res. 1969;9(1):139-44.
12. Schumacker RE, Lomax RG. A beginner guide to structural equation modeling. Mahwah: Lawrence Erlbaum Associates, 1996;33-52. 13. Jerger JF, Carhart R, Tillman TW, Peterson JL. Some relations between
normal hearing for pure tones and for speech. J Speech Hear Res. 1959;2(1):126-40.
14. Camargo MBB, Neves IF, Favaro MA, Lopes O, Redondo MC. Speech reception threshold: Study about the relationship between the SRT and the tonal thresholds of the frequencies of 250 Hz a 4000 Hz. Brazilian Journal of Otorhinolaryngology. 1989;55(1):11-21.
15. Harris JD, Haines HL, Myers CK. A new formula for using the audiogram to predict speech hearing loss. Arch Otolaryngol. 1956;63(2):158-76.
16. Cassiola V, Castiquini EAT, Meyer ASA. Pesquisa do limiar de recepc¸a˜o da fala em diferentes configurac¸o˜es audiome´tricas. Jornal Brasileiro de Fonoaudiologia. 2003;4(2):253-6.
17. BIAP Recommendation n˚ 02/1 bis. Audiometric classification of hearing impairments, 1996. In: BIAP - International Bureau for Audio Phonology. Available at: http://www.biap.org/en/recommendations/ 65-ct-2-classification-des-surdites/5-recommandation-biap-021-bis. Acce-ssed May 10, 2012.
18. Kano CE, Mezzena LH, Guida HL. Comparative study for classifying the hearing loss degree in institutionalized elderly. Rev CEFAC. 2009;11(3):473-7, http://dx.doi.org/10.1590/S1516-18462009005000024. 19. Berger KW. Speech Audiometry. In: Rose DE. Audiological Assessment.
Englewood Cliffs: Prentice Hall, 1978;227-60.