Article
Urinary Albumin Excretion Reflects Cardiovascular Risk in
Postmenopausal Women without Diabetes: The 2011 to
2013 Korean National Health and Nutrition Examination
Survey
Hee Jung Ahn, Do Sik Moon, Da Yeong Kang, Jung In Lee, Da Young Kim, Jin Hwa Kim, Sang Yong Kim, Hak Yeon Bae
Division of Endocrinology and Metabolism, Department of Internal Medicine, Chosun University Hospital, Chosun University School of Medicine, Gwangju, Korea
Background: The objective of the current study was to determine whether there was an association between urinary albumin
excre-tion and cardiovascular disease (CVD) risk by estimating the Framingham Risk Score (FRS) in postmenopausal women without dia-betes.
Methods: This study was based on data from the Korea National Health and Nutrition Examination Survey, which was conducted
by the Korean Ministry of Health and Welfare in 2011 to 2013. Data on 2,316 postmenopausal women from a total of 24,594 partici-pants was included in the analysis.
Results: The mean FRS was significantly different in each of the urinary albumin to creatinine ratio (UACR) subgroups, and it
in-creased with UACR. The FRS was 12.69±0.12 in the optimal group, 14.30±0.19 in the intermediate normal group, 14.62±0.26 in the high normal group, and 15.86±0.36 in the microalbuminuria group. After fully adjusting for potential confounding factors, high normal levels and microalbuminuria were significantly associated with the highest tertile of FRS ([odds ratio (OR), 1.642; 95% con-fidence interval (CI), 1.124 to 2.400] and [OR, 3.385; 95% CI, 2.088 to 5.488], respectively) compared with the optimal subgroup. High normal levels and microalbuminuria were also significantly associated with a ≥10% 10-year risk of CVD ([OR, 1.853; 95% CI, 1.122 to 3.060] and [OR, 2.831; 95% CI, 1.327 to 6.037], respectively) after adjusting for potential confounding covariates.
Conclusion: Urinary albumin excretion reflects CVD risk in postmenopausal women without diabetes, and high normal levels and
microalbuminuria were independently associated with a higher risk of CVD.
Keywords: Urinary albumin excretion; Cardiovascular risk; Postmenopause
INTRODUCTION
Microalbuminuria, which is defined as a urinary albumin to
cre-atinine ratio (UACR) between 30 to 300 mg/g, is a known pre-dictive marker of cardiovascular disease (CVD) and mortality in individuals with [1-3] and without diabetes [4-7]. The
Pre-Received: 19 May 2016, Revised: 28 July 2016, Accepted: 4 August 2016
Corresponding author: Sang Yong Kim
Division of Endocrinology and Metabolism, Department of Internal Medicine, Chosun University Hospital, Chosun University School of Medicine, 365 Pilmun-daero, Dong-gu, Gwangju 61453, Korea
Tel: +82-62-220-3011, Fax: +82-62-223-3316, E-mail: [email protected]
Copyright © 2016 Korean Endocrine Society
vention of Renal and Vascular End Stage Disease (PREVEND) study [8] showed that elevated excretion of albumin in the urine could also be used as a metabolic syndrome component to more reliably predict the development of CVD.
Recent studies have suggested that patients with high-normal albuminuria levels (i.e., less than the current cutoff value of mi-croalbuminuria) also have an increased risk of CVD [9-16]. However, it is unclear whether albuminuria and its association with CVD risk appear in all individuals regardless of demo-graphics, such as race/ethnicity, sex, and population. To our knowledge, no studies have focused on postmenopausal women without diabetes, particularly in a large national representative population.
Postmenopause is a period related to unfavorable metabolic changes and is associated with an increased risk of CVD [17,18]. This high burden of CVD during postmenopause enhances the need to identify its surrogate markers to ensure that patients may benefit from personalized interventions to prevent CVD. More-over, a possible influence of postmenopause on urinary albumin excretion has been suggested [19-21].
The objective of the current study was to determine whether there was an association between urinary albumin excretion and CVD risk by estimating the Framingham Risk Score (FRS) in postmenopausal women without diabetes.
METHODS
Study population
This study was based on data from the Korea National Health and Nutrition Examination Survey (KNHANES), which was conducted by the Korean Ministry of Health and Welfare in 2011 to 2013. This cross-sectional and nationally representative survey of non-institutionalized civilians used a stratified, multi-stage, clustered probability sampling design. The sampling units are defined based on data from household registries, including the geographic area, sex, and age groups. KNHANES is com-posed of a health interview survey, a nutrition survey, and a health examination survey conducted by trained investigators. All participants in this survey provided signed informed con-sent. Out of the 24,594 participants in the 2011 to 2013 survey, we used data collected from 4,327 women who were naturally postmenopausal. Menopause was defined as the absence of menses for 12 consecutive months. We excluded women 80 years of age and older (n=267), women who experienced the onset of menopause when they were younger than 40 years (n=130), and women who had fasted for <8 hours (n=140).
We also excluded women with diabetes (n=732). Diabetes was defined as having a fasting plasma glucose (FPG) level ≥126 mg/dL, an glycated hemoglobin (HbA1c) level ≥6.5%, the use of insulin or anti-diabetic medication, or being diagnosed with diabetes by a physician. Women with missing or incomplete data required for the analysis (n=279) were excluded. Women were also excluded if they had myocardial infarction, angina, or stroke (n=144), were undergoing lipid lowering treatment (n=294), or if they had overt macroalbuminuria (UACR ≥300 mg/g; n=25). Finally, data from 2,316 postmenopausal women were retained for the analysis.
Measurement and classification of variables
Height was measured to the nearest 0.1 cm using a portable sta-diometer, with the participants in the upright position. Body weight was measured to the nearest 0.1 kg on a balanced scale. Body mass index (BMI) was calculated as weight in kilograms divided by the square of the height in meters. Waist circumfer-ence (WC) was measured midway between the costal margin and the iliac crest at the end of a normal expiration. Blood pres-sure (BP) was meapres-sured from the right arm using a standard mercury sphygmomanometer after 5 minutes of rest in the sit-ting position. The mean value of two separate BP measurements was used for the analysis. Venous blood samples were obtained after a minimum fasting time of 8 hours. Plasma glucose, total cholesterol, low density lipoprotein cholesterol (LDL-C), high density lipoprotein cholesterol (HDL-C), and triglyceride levels were measured using a Hitachi Automatic Analyzer 7600 (Hita-chi, Tokyo, Japan) from 2011 to 2012 and using the COBAS 8000 C702 (Roche, Mannheim, Germany) in 2013. HbA1c was measured using high-performance liquid chromatography (HLC-723G7, Tosoh, Tokyo, Japan) from 2011 to 2012 and the Tosoh G8 (Tosoh) in 2013. Spot urine albumin concentrations were measured with a turbidimetric assay (Hitachi Automatic Analyzer 7600). Serum and spot urine creatinine levels were measured with a colorimetric assay (Hitachi Automatic Analyz-er 7600) from 2011 to 2012 using the Jaffe rate-blanked and compensated method (COBAS 8000 C702).
Estimated glomerular filtration rate (eGFR) was calculated using the abbreviated equation from the Modification of Diet in Renal Disease study: eGFR (mL/min/1.73 m2
)=175×(serum creatinine)–1.154
×(age)–0.203
×0.742 [22].
The UACR was calculated as the ratio of urine albumin to creatinine, expressed in milligrams per gram.
Self-reported questionnaires were administered to determine smoking status, alcohol use, family income, education level, residential area, and regular exercise habits. The residential area was categorized (according to the Korean administrative dis-trict) as urban or rural. Regular exercise was recorded as ‘yes’ when the subject performed moderate exercise on a regular ba-sis (more than 30 minutes at a time and more than five times per week). Known hypertension was defined as being treated or di-agnosed by a physician. The subjects were also asked to recall certain reproductive issues, including age at menarche, age at menopause, lactation history, and oral contraceptive use.
Statistical analysis
Complex sample analysis was applied to the KNHANES data to weigh all values, following the recommendations from the Korea Centers for Disease Control and Prevention. Continuous variables are reported as mean±SD, and categorical variables are reported as weighted percentages. Comparisons among groups were performed using the complex samples general lin-ear model for continuous variables, and the chi-square test was used for categorical variables. To further analyze significant dif-ferences between each subgroup, we compared each set of two subgroups using the t test.
For data analysis, albuminuria was categorized according to the UACR into optimal (≤5.0 mg/g), intermediate normal (5.1 to 9.9 mg/g), high normal (10.0 to 29.9 mg/g), and microalbu-minuria (30.0 to 299.9 mg/g) groups [16,24]. The subjects were also subdivided into three tertile groups based on FRS as fol-lows: tertile 1, FRS ≤12; tertile 2, 12 <FRS<16; and tertile 3, FRS ≥16.
Multivariate logistic regression analyses were used to mea-sure the association between urinary albumin excretion and CVD risk (estimated by FRS) by evaluating the odds ratio (OR), after adjusting for confounding factors that were associated with an increased risk of CVD and their influence on urinary albu-min excretion. The analyses were adjusted for potential con-founders in a series of models. Covariates were added to the model. First, we added lifestyle behaviors (alcohol drinking and regular exercise) and sociodemographic factors (residential area, family income, and education), and then we added known CVD risk factors (diastolic BP, BMI, WC, FPG, triglyceride, and LDL-C), reproductive factors (age at menarche, age at menopause, oral contraceptive use, and lactation history), eGFR level and hypertension history.
Statistical analyses were performed using SPSS version 18.0 (SPSS Inc., Chicago, IL, USA), and a P<0.05 was considered to be statistically significant.
RESULTS
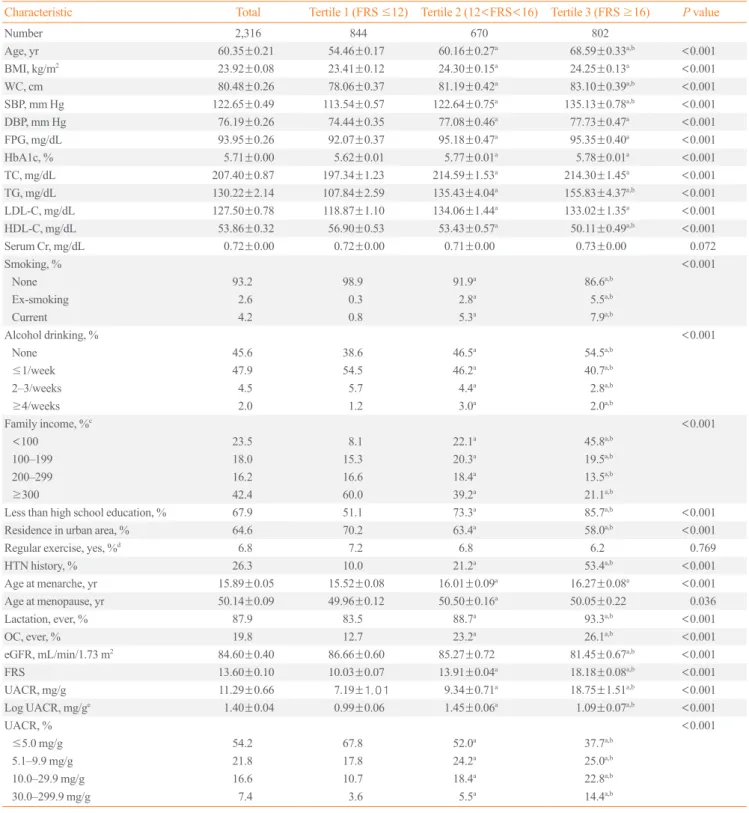
The subjects’ clinical and biochemical characteristics are pre-sented in Table 1. The mean patient age was 60.35±0.21 years, and the mean FRS was 13.60±0.10. As expected, the subjects with higher FRS had less favorable cardiometabolic profiles (e.g., higher BMI, WC, BP, FPG, total cholesterol, LDL-C, and triglyceride levels and lower HDL-C levels) and hypertension histories compared to those with lower FRS. Lower family in-come, education level, and residence in a rural area were more common among the subjects with a higher FRS. Reproductive factors, such as age at menarche, age at menopause, lactation history, and oral contraceptive use, differed between the FRS subgroups. Lifestyle behaviors (smoking and alcohol drinking) and eGFR levels also differed among the FRS subgroups.
The mean UACR was 11.29±0.66 mg/g. The mean value of UACR differed significantly between the FRS subgroups and increased with increased FRS (tertile 1, 7.19±1.01 mg/g; tertile 2, 9.34±0.71 mg/g; and tertile 3, 18.75±1.51 mg/g).
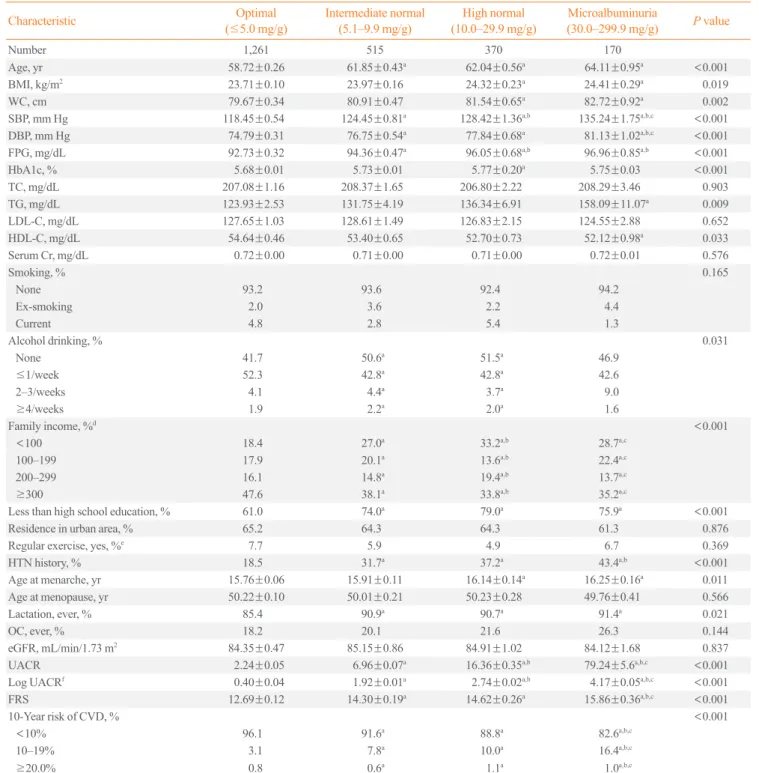
Comparison of clinical characteristics and FRS among the UACR subgroups
Table 2 shows the characteristics of the subjects stratified into four groups by UACR. Subjects with a higher UACR had high-er BMI, WC, BP, FPG, HbA1c, and triglychigh-eride levels but lowhigh-er HDL-C levels; they also had a longer history of hypertension and were more likely to have lower family income and educa-tion levels. Alcohol drinking and reproductive factors, such as age at menarche and lactation history, differed between the UACR subgroups.
The mean FRS differed significantly in each of the UACR subgroups, and it increased as the UACR increased. The FRS was 12.69±0.12 in the optimal albuminuria group, 14.30±0.19 in the intermediate normal albuminuria group, 14.62±0.26 in the high normal albuminuria group, and 15.86±0.36 in the mi-croalbuminuria group. The distribution of the 10-year risk of CVD differed significantly between the UACR subgroups, and the proportion of patients with a higher 10-year risk of CVD in-creased with higher albuminuria levels.
Relationship between FRS and UACR
Table 1. Characteristics of the Study Population according to Framingham Risk Score Tertile
Characteristic Total Tertile 1 (FRS ≤12) Tertile 2 (12<FRS<16) Tertile 3 (FRS ≥16) P value
Number 2,316 844 670 802
Age, yr 60.35±0.21 54.46±0.17 60.16±0.27a 68.59
±0.33a,b
<0.001
BMI, kg/m2 23.92
±0.08 23.41±0.12 24.30±0.15a 24.25
±0.13a
<0.001
WC, cm 80.48±0.26 78.06±0.37 81.19±0.42a
83.10±0.39a,b
<0.001
SBP, mm Hg 122.65±0.49 113.54±0.57 122.64±0.75a 135.13
±0.78a,b
<0.001
DBP, mm Hg 76.19±0.26 74.44±0.35 77.08±0.46a 77.73
±0.47a
<0.001
FPG, mg/dL 93.95±0.26 92.07±0.37 95.18±0.47a 95.35
±0.40a
<0.001
HbA1c, % 5.71±0.00 5.62±0.01 5.77±0.01a 5.78
±0.01a
<0.001
TC, mg/dL 207.40±0.87 197.34±1.23 214.59±1.53a
214.30±1.45a
<0.001
TG, mg/dL 130.22±2.14 107.84±2.59 135.43±4.04a 155.83
±4.37a,b
<0.001
LDL-C, mg/dL 127.50±0.78 118.87±1.10 134.06±1.44a 133.02
±1.35a
<0.001
HDL-C, mg/dL 53.86±0.32 56.90±0.53 53.43±0.57a 50.11
±0.49a,b
<0.001
Serum Cr, mg/dL 0.72±0.00 0.72±0.00 0.71±0.00 0.73±0.00 0.072
Smoking, % <0.001
None 93.2 98.9 91.9a 86.6a,b
Ex-smoking 2.6 0.3 2.8a 5.5a,b
Current 4.2 0.8 5.3a 7.9a,b
Alcohol drinking, % <0.001
None 45.6 38.6 46.5a 54.5a,b
≤1/week 47.9 54.5 46.2a 40.7a,b
2–3/weeks 4.5 5.7 4.4a 2.8a,b
≥4/weeks 2.0 1.2 3.0a 2.0a,b
Family income, %c
<0.001
<100 23.5 8.1 22.1a 45.8a,b
100–199 18.0 15.3 20.3a 19.5a,b
200–299 16.2 16.6 18.4a 13.5a,b
≥300 42.4 60.0 39.2a
21.1a,b
Less than high school education, % 67.9 51.1 73.3a 85.7a,b
<0.001
Residence in urban area, % 64.6 70.2 63.4a 58.0a,b
<0.001
Regular exercise, yes, %d 6.8 7.2 6.8 6.2 0.769
HTN history, % 26.3 10.0 21.2a 53.4a,b
<0.001 Age at menarche, yr 15.89±0.05 15.52±0.08 16.01±0.09a
16.27±0.08a
<0.001
Age at menopause, yr 50.14±0.09 49.96±0.12 50.50±0.16a 50.05
±0.22 0.036
Lactation, ever, % 87.9 83.5 88.7a 93.3a,b
<0.001
OC, ever, % 19.8 12.7 23.2a 26.1a,b
<0.001 eGFR, mL/min/1.73 m2
84.60±0.40 86.66±0.60 85.27±0.72 81.45±0.67a,b
<0.001
FRS 13.60±0.10 10.03±0.07 13.91±0.04a 18.18
±0.08a,b
<0.001
UACR, mg/g 11.29±0.66 7.19±1.01 9.34±0.71a 18.75
±1.51a,b
<0.001
Log UACR, mg/ge 1.40
±0.04 0.99±0.06 1.45±0.06a 1.09
±0.07a,b
<0.001
UACR, % <0.001
≤5.0 mg/g 54.2 67.8 52.0a
37.7a,b
5.1–9.9 mg/g 21.8 17.8 24.2a 25.0a,b
10.0–29.9 mg/g 16.6 10.7 18.4a 22.8a,b
30.0–299.9 mg/g 7.4 3.6 5.5a 14.4a,b
Values are expressed as mean±SD.
FRS, Framingham Risk Score; BMI, body mass index; WC, waist circumference; SBP, systolic blood pressure; DBP, diastolic blood pressure; FPG, fasting plasma glucose; HbA1c, glycated hemoglobin; TC, total cholesterol; TG, triglyceride; LDL-C, low density lipoprotein cholesterol; HDL-C, high density lipoprotein cho-lesterol; Cr, creatinine; HTN, hypertension; OC, oral contraceptive; eGFR, estimated glomerular filtration rate; UACR, urinary albumin to creatinine ratio.
aP
<0.05 for tertile 1 vs. tertile 2 and tertile 1 vs. tertile 3; bP
Table 2. Characteristics of the Study Population according to the Urinary Albumin to Creatinine Ratio
Characteristic Optimal (≤5.0 mg/g)
Intermediate normal (5.1–9.9 mg/g)
High normal (10.0–29.9 mg/g)
Microalbuminuria
(30.0–299.9 mg/g) P value
Number 1,261 515 370 170
Age, yr 58.72±0.26 61.85±0.43a 62.04
±0.56a 64.11
±0.95a
<0.001
BMI, kg/m2 23.71
±0.10 23.97±0.16 24.32±0.23a 24.41
±0.29a 0.019
WC, cm 79.67±0.34 80.91±0.47 81.54±0.65a 82.72
±0.92a 0.002
SBP, mm Hg 118.45±0.54 124.45±0.81a 128.42
±1.36a,b 135.24
±1.75a,b,c
<0.001
DBP, mm Hg 74.79±0.31 76.75±0.54a 77.84
±0.68a 81.13
±1.02a,b,c
<0.001
FPG, mg/dL 92.73±0.32 94.36±0.47a 96.05
±0.68a,b 96.96
±0.85a,b
<0.001
HbA1c, % 5.68±0.01 5.73±0.01 5.77±0.20a 5.75
±0.03 <0.001
TC, mg/dL 207.08±1.16 208.37±1.65 206.80±2.22 208.29±3.46 0.903
TG, mg/dL 123.93±2.53 131.75±4.19 136.34±6.91 158.09±11.07a
0.009
LDL-C, mg/dL 127.65±1.03 128.61±1.49 126.83±2.15 124.55±2.88 0.652
HDL-C, mg/dL 54.64±0.46 53.40±0.65 52.70±0.73 52.12±0.98a 0.033
Serum Cr, mg/dL 0.72±0.00 0.71±0.00 0.71±0.00 0.72±0.01 0.576
Smoking, % 0.165
None 93.2 93.6 92.4 94.2
Ex-smoking 2.0 3.6 2.2 4.4
Current 4.8 2.8 5.4 1.3
Alcohol drinking, % 0.031
None 41.7 50.6a 51.5a 46.9
≤1/week 52.3 42.8a
42.8a
42.6
2–3/weeks 4.1 4.4a
3.7a
9.0
≥4/weeks 1.9 2.2a 2.0a 1.6
Family income, %d
<0.001
<100 18.4 27.0a 33.2a,b 28.7a,c
100–199 17.9 20.1a 13.6a,b 22.4a,c
200–299 16.1 14.8a 19.4a,b 13.7a,c
≥300 47.6 38.1a 33.8a,b 35.2a,c
Less than high school education, % 61.0 74.0a 79.0a 75.9a
<0.001
Residence in urban area, % 65.2 64.3 64.3 61.3 0.876
Regular exercise, yes, %e
7.7 5.9 4.9 6.7 0.369
HTN history, % 18.5 31.7a 37.2a 43.4a,b
<0.001
Age at menarche, yr 15.76±0.06 15.91±0.11 16.14±0.14a 16.25
±0.16a 0.011
Age at menopause, yr 50.22±0.10 50.01±0.21 50.23±0.28 49.76±0.41 0.566
Lactation, ever, % 85.4 90.9a 90.7a 91.4a 0.021
OC, ever, % 18.2 20.1 21.6 26.3 0.144
eGFR, mL/min/1.73 m2 84.35
±0.47 85.15±0.86 84.91±1.02 84.12±1.68 0.837
UACR 2.24±0.05 6.96±0.07a 16.36
±0.35a,b 79.24
±5.6a,b,c
<0.001
Log UACRf 0.40
±0.04 1.92±0.01a 2.74
±0.02a,b 4.17
±0.05a,b,c
<0.001
FRS 12.69±0.12 14.30±0.19a
14.62±0.26a
15.86±0.36a,b,c
<0.001
10-Year risk of CVD, % <0.001
<10% 96.1 91.6a 88.8a 82.6a,b,c
10–19% 3.1 7.8a 10.0a 16.4a,b,c
≥20.0% 0.8 0.6a 1.1a 1.0a,b,c
Values are expressed as mean±SD.
BMI, body mass index; WC, waist circumference; SBP, systolic blood pressure; DBP, diastolic blood pressure; FPG, fasting plasma glucose; HbA1c, glycated he-moglobin; TC, total cholesterol; TG, triglyceride; LDL-C, low density lipoprotein cholesterol; HDL-C, high density lipoprotein cholesterol; Cr, creatinine; HTN, hypertension; OC, oral contraceptive; eGFR, estimated glomerular filtration rate; UACR, urinary albumin to creatinine ratio; FRS, Framingham Risk Score; CVD, cardiovascular disease.
aP
<0.05 for optimal vs. intermediate normal, optimal vs. high normal, and optimal vs. microalbuminuria; bP
<0.05 for intermediate normal vs. high normal and intermediate normal vs. microalbuminuria; cP
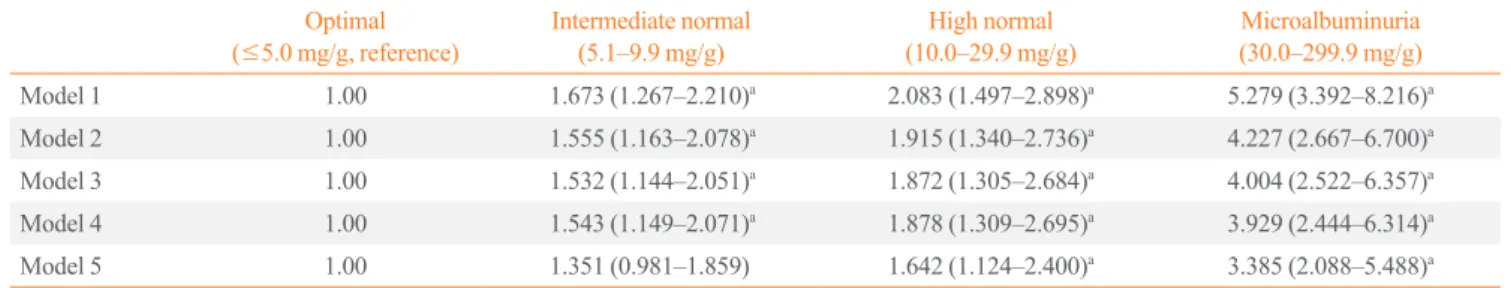
the highest tertiles of the FRS and the UACR range. After ad-justing for lifestyle behaviors and sociodemographic factors, in-termediate normal, high normal, and microalbuminuria levels were significantly associated with the highest tertile of FRS ([OR, 1.673; 95% confidence interval (CI), 1.267 to 2.210], [OR, 2.083; 95% CI, 1.497 to 2.898], and [OR, 5.279; 95% CI, 3.392 to 8.216], respectively) compared to the optimal sub-group. After further adjustments for known CVD risk factors, the ORs were attenuated but remained significant ([intermediate normal: OR, 1.555; 95% CI, 1.163 to 2.078], [high normal: OR, 1.915; 95% CI, 1.340 to 2.736], and [microalbuminuria: OR, 4.227; 95% CI, 2.667 to 6.700]). These independent associa-tions remained after adjusting for reproductive factors, in addi-tion to the above factors ([intermediate normal: OR, 1.532; 95% CI, 1.144 to 2.051], [high normal: OR, 1.872; 95% CI, 1.305 to 2.684], and [microalbuminuria: OR, 4.004; 95% CI, 2.522 to
6.357]). After adjusting for the previous factors, as well as for eGFR level, the association remained significant ([intermediate normal: OR, 1.543; 95% CI, 1.149 to 2.071], [high normal: OR, 1.878; 95% CI, 1.309 to 2.695], and [microalbuminuria: OR, 3.929; 95% CI, 2.444 to 6.314]). After further adjustments for hypertension history, intermediate normal levels were no longer significantly associated with the highest tertiles of the FRS (OR, 1.351; 95% CI, 0.981 to 1.859), but this association remained significant in subjects with high normal levels (OR, 1.642; 95% CI, 1.124 to 2.400) and microalbuminuria (OR, 3.385; 95% CI, 2.088 to 5.488).
Relationship between CVD risk and UACR
There were few subjects with a ≥20% 10-year risk of CVD (Table 2). Thus, we evaluated the relationship between a ≥10% 10-year risk of CVD and UACR with multivariate logistic re-Table 3. Odds Ratio (95% Confidence Interval) for the Highest Framingham Risk Score Tertile, according to the Urinary Albumin to Creatinine Ratio
Optimal (≤5.0 mg/g, reference)
Intermediate normal (5.1–9.9 mg/g)
High normal (10.0–29.9 mg/g)
Microalbuminuria (30.0–299.9 mg/g)
Model 1 1.00 1.673 (1.267–2.210)a 2.083 (1.497–2.898)a 5.279 (3.392–8.216)a
Model 2 1.00 1.555 (1.163–2.078)a 1.915 (1.340–2.736)a 4.227 (2.667–6.700)a
Model 3 1.00 1.532 (1.144–2.051)a
1.872 (1.305–2.684)a
4.004 (2.522–6.357)a
Model 4 1.00 1.543 (1.149–2.071)a 1.878 (1.309–2.695)a 3.929 (2.444–6.314)a
Model 5 1.00 1.351 (0.981–1.859) 1.642 (1.124–2.400)a 3.385 (2.088–5.488)a
Model 1: adjusted for lifestyle behaviors (alcohol drinking and regular exercise) and sociodemographic factors (residential area, family income, and edu-cation); Model 2: model 1 plus known cardiovascular risk factors (diastolic blood pressure, body mass index, waist circumference, fasting plasma glu-cose, triglyceride, and low density lipoprotein cholesterol); Model 3: model 2 plus reproductive factors (age at menarche, age at menopause, oral contra-ceptive use, and lactation); Model 4: model 3 plus estimated glomerular filtration rate; Model 5: model 4 plus hypertension history.
a P<0.05.
Table 4. Odds Ratio (95% Confidence Interval) for ≥10% 10-Year Risk of Cardiovascular Disease, according to the Urinary Albumin to Creatinine Ratio
Optimal (≤5.0 mg/g, reference)
Intermediate normal (5.1–9.9 mg/g)
High normal (10.0–29.9 mg/g)
Microalbuminuria (30.0–299.9 mg/g)
Model 1 1.00 1.829 (1.123–2.980)a 2.281 (1.398–3.724)a 4.224 (2.288–7.800)a
Model 2 1.00 1.768 (1.075–2.908)a
2.103 (1.285–3.443)a
3.825 (1.987–7.366)a
Model 3 1.00 1.669 (1.027–2.713)a
2.050 (1.270–3.309)a
3.449 (1.682–7.075)a
Model 4 1.00 1.654 (0.997–2.743) 2.134 (1.323–3.444)a 3.389 (1.642–6.994)a
Model 5 1.00 1.390 (0.798–2.424) 1.853 (1.122–3.060)a 2.831 (1.327–6.037)a
Model 1: adjusted for lifestyle behaviors (alcohol drinking and regular exercise) and sociodemographic factors (residential area, family income, and edu-cation); Model 2: model 1 plus known cardiovascular risk factors (diastolic blood pressure, body mass index, waist circumference, fasting plasma glu-cose, triglyceride, and low density lipoprotein cholesterol); Model 3: model 2 plus reproductive factors (age at menarche, age at menopause, oral contra-ceptive use, and lactation); Model 4: model 3 plus estimated glomerular filtration rate; Model 5: model 4 plus hypertension history.
aP
gression analyses (Table 4). After adjustments for lifestyle be-haviors and sociodemographic factors, intermediate normal, high normal levels, and microalbuminuria were significantly as-sociated with a ≥10% 10-year risk of CVD ([OR, 1.829; 95% CI, 1.123 to 2.980], [OR, 2.281; 95% CI, 1.398 to 3.724], and [OR, 4.224; 95% CI, 2.288 to 7.800], respectively) compared with the optimal subgroup. After further adjustments for known CVD risk factors, the ORs were attenuated but remained signifi-cant ([intermediate normal: OR, 1.768; 95% CI, 1.075 to 2.908], [high normal: OR, 2.103; 95% CI, 1.285 to 3.443], and [micro-albuminuria: OR, 3.825; 95% CI, 1.987 to 7.366]). These inde-pendent associations remained after adjusting for reproductive factors, in addition to the above factors ([intermediate normal: OR, 1.669; 95% CI, 1.027 to 2.713], [high normal: OR, 2.050; 95% CI, 1.270 to 3.309], and [microalbuminuria: OR, 3.449; 95% CI, 1.682 to 7.075]). After further adjustments for eGFR levels, intermediate normal levels were no longer significantly associated with a ≥10% 10-year risk of CVD (OR, 1.654; 95% CI, 0.997 to 2.743), but this association remained significant in subjects with high normal levels (OR, 2.134; 95% CI, 1.323 to 3.444]) and microalbuminuria (OR, 3.389; 95% CI, 1.642 to 6.994). After adjustments for the previous factors and hyperten-sion history, the association remained significant ([high normal: OR, 1.853; 95% CI, 1.122 to 3.060] and [microalbuminuria: OR, 2.831; 95% CI, 1.327 to 6.037]).
DISCUSSION
In this study, microalbuminuria was independently associated with a higher risk of increased FRS and a ≥10% 10-year risk of CVD in postmenopausal women without diabetes, after adjust-ing for multiple potential confoundadjust-ing variables. Interestadjust-ingly, this association even extends into the normal range of albumin-uria. Subjects with high normal albuminuria levels (10.0≤
UACR≤29.9 mg/g) had a significantly higher risk of increased FRS and a ≥10% 10-year risk of CVD compared with those in the optimal ranges (UACR ≤5.0 mg/g). To our knowledge, this large population-based study is the first to focus on the associa-tion between albuminuria levels and CVD risk in postmeno-pausal women without diabetes. Our results indicate that micro-albuminuria and micro-albuminuria levels in the high range of normal reflect CVD risk in postmenopausal women without diabetes.
Microalbuminuria is known as a marker of early stage renal damage, which is an independent risk factor of CVD and has been associated with an increased risk of CVD mortality in dia-betes patients [1-3]. Moreover, the relationship between
micro-albuminuria and CVD risk has been reported in nondiabetic pa-tients [4,5,8]. The UACR was positively related to carotid ath-erosclerotic plaque-initiation and plaque-growth in nondiabetic patients [6]. The Heart Outcomes Prevention Evaluation (HOPE) study [7] reported that UACR was an independent and continuous risk factor of future CVD risk in nondiabetic indi-viduals and suggested that any degree of albuminuria is a risk factor of CVD.
Recently, although there has been debate, several studies have suggested that patients with high-normal albuminuria levels that are still within the normal range also have an increased risk of CVD. These studies have questioned the concept that albumin excretion levels less than 30 mg/g are normal [9-16]. In data from the Framingham Heart Study [13], urinary albumin excre-tion below the convenexcre-tional threshold for microalbuminuria predicted the development of CVD and mortality in middle-aged nonhypertensive, nondiabetic individuals. The Strong Heart Study [14] also showed that albuminuria levels lower than the traditional cutoff value predicted CVD and CVD mor-tality independent of other CVD risk factors. Hong et al. [15] reported that albuminuria levels within normal ranges were sig-nificantly associated with estimated cardiovascular (CV) risk based on the FRS and metabolic syndrome in the general Kore-an population. A meta-Kore-analysis has reported that a UACR of 10 mg/g or more was an independent predictor of mortality risk in the general population [16].
In the current study, we evaluated the association between urinary albumin excretion and CVD risk by estimating the FRS in postmenopausal women without diabetes. The FRS is a widely used tool for assessing the 10-year risk of CVD events in asymptomatic individuals [25]. The results of our study are consistent with previous reports showing an association be-tween albuminuria and CVD risk in the general population. We found a significant positive association between albuminuria and FRS, even for levels that were below the traditional cutoff value for microalbuminuria, and this association remained after adjusting for conditions potentially affecting the results, includ-ing traditional and nontraditional CVD risk factors. Hyperten-sion has a known positive correlation with albuminuria [26]. After adjusting for hypertension history, the association was at-tenuated, but it remained significant. This finding suggests that urinary albumin excretion may itself play an independent role in CVD risk in postmenopausal women without diabetes, in addi-tion to other CVD risk factors. Addiaddi-tional studies are needed to explore these potential causal relationships in more detail.
re-lated to albuminuria [19-21]; estrogen reportedly modulates the renin-angiotensin-aldosterone system [27]. In rats, estrogen re-duces the angiotensin converting enzyme mRNA and downreg-ulates angiotensin-converting enzyme (ACE) transcription and the conversion of angiotensin I to angiotensin II, which could decrease the efferent arteriolar pressure. This would therefore decrease intraglomerular pressure and albuminuria levels [19,20]. Based on this evidence, postmenopause, which is an estrogen-deficient state, could affect and mediate the increase in albuminuria. When considering albuminuria as a potential pre-dictor of future CVD risk in the general population, it is impor-tant to identify the association between the degree of urinary al-bumin excretion and CVD risk in postmenopausal women. Moreover, postmenopause is related to metabolically deleteri-ous changes in insulin, glucose, BP, and lipids, and it is associ-ated with CVD risk [17,18]. Roest et al. [28] have demonstrassoci-ated an independent predictive role of urinary albumin excretion in the risk of future CV mortality in postmenopausal women in the general population. However, they did not exclude women with diabetes. With appropriate adjustments for diabetes, it is possi-ble that there are residual and unmeasured confounding effects related to diabetes. We evaluated postmenopausal women with-out diabetes, and our results provide evidence that urinary albu-min excretion may play a role as an indicator of CVD risk and may be useful in stratifying the individual risk in postmeno-pausal women.
This study has a cross-sectional design; therefore, it was not possible to establish pathophysiological mechanisms. One of the potential mechanisms is generalized endothelial dysfunc-tion, which could represent systemic hemodynamic instability, which initiates atherosclerosis. The leakage of albumin into the vessel wall through endothelial dysfunction culminates in an in-flammatory response and a perturbation of the vascular matrix, which mediates atherosclerosis. These vascular disturbances progress to loss of vessel dilatation and vascular impairment, thereby increasing glomerular pressure and leading to increased urinary albumin excretion [29,30]. Endothelial dysfunction can also affect remodeling of the arterial wall and the target vessel, leading to increased arterial stiffness, which affects the glomer-ular barrier permeability and leads to urinary albumin excretion [31,32]. Albuminuria could be an index of subclinical vascular abnormalities.
The strength of this study is that it was a large population-based national representative study that considered a compre-hensive range of possible confounding and mediating factors, including sociodemographic, lifestyle, anthropometric, and
re-productive factors. Nevertheless, there are several limitations. The measurements were performed at a certain time with a cross-sectional design; thus, a causal relationship could not be clearly determined. For the identification and exclusion of diabe-tes, the lack of oral glucose tolerance tests data is also a limita-tion of this study, as is the fact that we had only a single surement of FPG. Another limitation is that the UACR was mea-sured from a single-spot urine sample; therefore, we could not exclude the possibility that UACR variations influenced the re-sults. In addition, the FRS for CVD and specific outcomes could not be assessed; thus, we cannot provide insight into whether in-creased FRS actually led to CVD events. We also did not have information regarding preexisting renal diseases or asymptomat-ic urinary tract infections, whasymptomat-ich can affect albuminuria. Finally, we did not have information regarding specific types of anti-hy-pertensive medication that may influence albuminuria.
In conclusion, urinary albumin excretion reflects CVD risk in postmenopausal women without diabetes, and high normal lev-els and microalbuminuria were independently associated with a higher risk of CVD. We propose that urinary albumin excretion may reflect the CVD risk in postmenopausal women without diabetes, and that it should be considered a risk factor of CVD. Therefore, to effectively prevent CVD in postmenopausal en without diabetes, more attention should be focused on wom-en with microalbuminuria, evwom-en those with higher albuminuria levels that are within the normal range. A prospective study is needed to explore the possible causal relationship between higher urinary albumin excretion and subsequent CVD risk.
CONFLICTS OF INTEREST
No potential conflict of interest relevant to this article was re-ported.
ACKNOWLEDGMENTS
This study was supported by research fund of the Honam Branch of the Korean Endocrine Society.
ORCID
Sang Yong Kim http://orcid.org/0000-0002-3902-622X
REFERENCES
type 2 diabetes and hypertension: a marker, treatment target, or innocent bystander? Diabetes Care 2008;31 Suppl 2:S194-201.
2. Rachmani R, Levi Z, Lidar M, Slavachevski I, Half-Onn E,
Ravid M. Considerations about the threshold value of mi-croalbuminuria in patients with diabetes mellitus: lessons from an 8-year follow-up study of 599 patients. Diabetes Res Clin Pract 2000;49:187-94.
3. de Zeeuw D, Parving HH, Henning RH. Microalbuminuria
as an early marker for cardiovascular disease. J Am Soc Nephrol 2006;17:2100-5.
4. Hillege HL, Janssen WM, Bak AA, Diercks GF, Grobbee
DE, Crijns HJ, et al. Microalbuminuria is common, also in a nondiabetic, nonhypertensive population, and an indepen-dent indicator of cardiovascular risk factors and cardiovas-cular morbidity. J Intern Med 2001;249:519-26.
5. Kweon SS, Shin MH, Choi JS, Nam HS, Lee YH, Park KS,
et al. Prevalence of albuminuria and associated cardiovascu-lar risk factors: a community cohort in Namwon City, Ko-rea. Diabetes Res Clin Pract 2012;97:492-8.
6. Ma H, Lin H, Hofman A, Hu Y, Li X, He W, et al.
Low-grade albuminuria is associated with carotid atherosclerosis in normotensive and euglycemic Chinese middle-aged and elderly adults: the Shanghai Changfeng Study. Atheroscle-rosis 2013;228:237-42.
7. Gerstein HC, Mann JF, Yi Q, Zinman B, Dinneen SF,
Hoog-werf B, et al. Albuminuria and risk of cardiovascular events, death, and heart failure in diabetic and nondiabetic individu-als. JAMA 2001;286:421-6.
8. Hillege HL, Fidler V, Diercks GF, van Gilst WH, de Zeeuw
D, van Veldhuisen DJ, et al. Urinary albumin excretion pre-dicts cardiovascular and noncardiovascular mortality in gen-eral population. Circulation 2002;106:1777-82.
9. Lieb W, Mayer B, Stritzke J, Doering A, Hense HW, Loewel
H, et al. Association of low-grade urinary albumin excretion with left ventricular hypertrophy in the general population: the MONICA/KORA Augsburg Echocardiographic Sub-study. Nephrol Dial Transplant 2006;21:2780-7.
10. Solbu MD, Kronborg J, Jenssen TG, Njolstad I, Lochen
ML, Mathiesen EB, et al. Albuminuria, metabolic syndrome and the risk of mortality and cardiovascular events. Athero-sclerosis 2009;204:503-8.
11. Jorgensen L, Jenssen T, Heuch I, Jacobsen BK. The
com-bined effect of albuminuria and inflammation on all-cause and cardiovascular mortality in nondiabetic persons. J Intern Med 2008;264:493-501.
12. Schmieder RE, Schrader J, Zidek W, Tebbe U, Paar WD,
Bramlage P, et al. Low-grade albuminuria and cardiovascular risk: what is the evidence? Clin Res Cardiol 2007;96:247-57. 13. Arnlov J, Evans JC, Meigs JB, Wang TJ, Fox CS, Levy D, et
al. Low-grade albuminuria and incidence of cardiovascular disease events in nonhypertensive and nondiabetic individu-als: the Framingham Heart Study. Circulation 2005;112:969-75.
14. Xu J, Knowler WC, Devereux RB, Yeh J, Umans JG,
Be-gum M, et al. Albuminuria within the “normal” range and risk of cardiovascular disease and death in American Indi-ans: the Strong Heart Study. Am J Kidney Dis 2007;49:208-16.
15. Hong JW, Ku CR, Noh JH, Ko KS, Rhee BD, Kim DJ.
As-sociation between low-grade albuminuria and cardiovascu-lar risk in Korean adults: the 2011-2012 Korea National Health and Nutrition Examination Survey. PLoS One 2015; 10:e0118866.
16. Chronic Kidney Disease Prognosis Consortium, Matsushita
K, van der Velde M, Astor BC, Woodward M, Levey AS, et al. Association of estimated glomerular filtration rate and al-buminuria with all-cause and cardiovascular mortality in general population cohorts: a collaborative meta-analysis. Lancet 2010;375:2073-81.
17. Kim HM, Park J, Ryu SY, Kim J. The effect of menopause
on the metabolic syndrome among Korean women: the Ko-rean National Health and Nutrition Examination Survey, 2001. Diabetes Care 2007;30:701-6.
18. Stefanska A, Bergmann K, Sypniewska G. Metabolic
syn-drome and menopause: pathophysiology, clinical and diag-nostic significance. Adv Clin Chem 2015;72:1-75.
19. Gallagher PE, Li P, Lenhart JR, Chappell MC, Brosnihan
KB. Estrogen regulation of angiotensin-converting enzyme mRNA. Hypertension 1999;33(1 Pt 2):323-8.
20. Elving LD, Wetzels JF, de Nobel E, Hoitsma AJ, Berden JH.
Captopril acutely lowers albuminuria in normotensive pa-tients with diabetic nephropathy. Am J Kidney Dis 1992;20: 559-63.
21. Schunkert H, Danser AH, Hense HW, Derkx FH, Kurzinger
S, Riegger GA. Effects of estrogen replacement therapy on the renin-angiotensin system in postmenopausal women. Circulation 1997;95:39-45.
22. Lamb EJ, Tomson CR, Roderick PJ; Clinical Sciences
23. National Cholesterol Education Program (NCEP) Expert
Panel on Detection, Evaluation, and Treatment of High Blood Cholesterol in Adults (Adult Treatment Panel III). Third report of the National Cholesterol Education Program (NCEP) Expert Panel on Detection, Evaluation, and Treat-ment of High Blood Cholesterol in Adults (Adult TreatTreat-ment Panel III) final report. Circulation 2002;106:3143-421. 24. Blecker S, Matsushita K, Kottgen A, Loehr LR, Bertoni AG,
Boulware LE, et al. High-normal albuminuria and risk of heart failure in the community. Am J Kidney Dis 2011;58:47-55.
25. Anderson KM, Odell PM, Wilson PW, Kannel WB.
Cardio-vascular disease risk profiles. Am Heart J 1991;121(1 Pt 2): 293-8.
26. Won JC, Lee YJ, Kim JM, Han SY, Noh JH, Ko KS, et al.
Prevalence of and factors associated with albuminuria in the Korean adult population: the 2011 Korea National Health and Nutrition Examination Survey. PLoS One 2013;8:e83273. 27. Xue B, Johnson AK, Hay M. Sex differences in angiotensin
II- and aldosterone-induced hypertension: the central
protec-tive effects of estrogen. Am J Physiol Regul Integr Comp Physiol 2013;305:R459-63.
28. Roest M, Banga JD, Janssen WM, Grobbee DE, Sixma JJ,
de Jong PE, et al. Excessive urinary albumin levels are asso-ciated with future cardiovascular mortality in postmeno-pausal women. Circulation 2001;103:3057-61.
29. Deckert T, Feldt-Rasmussen B, Borch-Johnsen K, Jensen T,
Kofoed-Enevoldsen A. Albuminuria reflects widespread vascular damage. The Steno hypothesis. Diabetologia 1989; 32:219-26.
30. Clausen P, Jensen JS, Jensen G, Borch-Johnsen K,
Feldt-Rasmussen B. Elevated urinary albumin excretion is associ-ated with impaired arterial dilatory capacity in clinically healthy subjects. Circulation 2001;103:1869-74.
31. Jensen JS. Renal and systemic transvascular albumin
leak-age in severe atherosclerosis. Arterioscler Thromb Vasc Biol 1995;15:1324-9.
32. Stehouwer CD, Smulders YM. Microalbuminuria and risk